Copyright
©The Author(s) 2021.
World J Hepatol. Dec 27, 2021; 13(12): 2179-2191
Published online Dec 27, 2021. doi: 10.4254/wjh.v13.i12.2179
Published online Dec 27, 2021. doi: 10.4254/wjh.v13.i12.2179
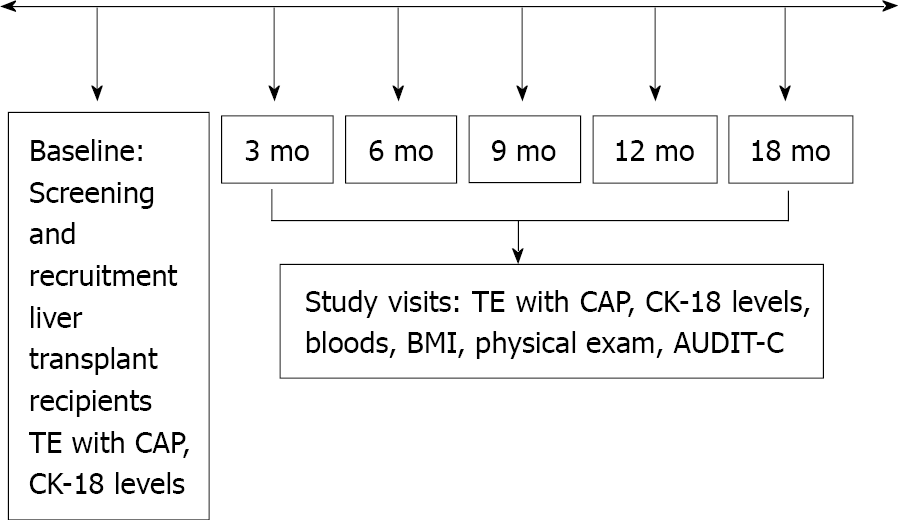
Figure 1 Study design showing baseline and study visit.
AUDIT-C: Alcohol Use Disorders Identification Test; BMI: Body mass index; CAP: Controlled attenuation parameter; TE: Transient elastography; CK-18: Cytokeratin 18.
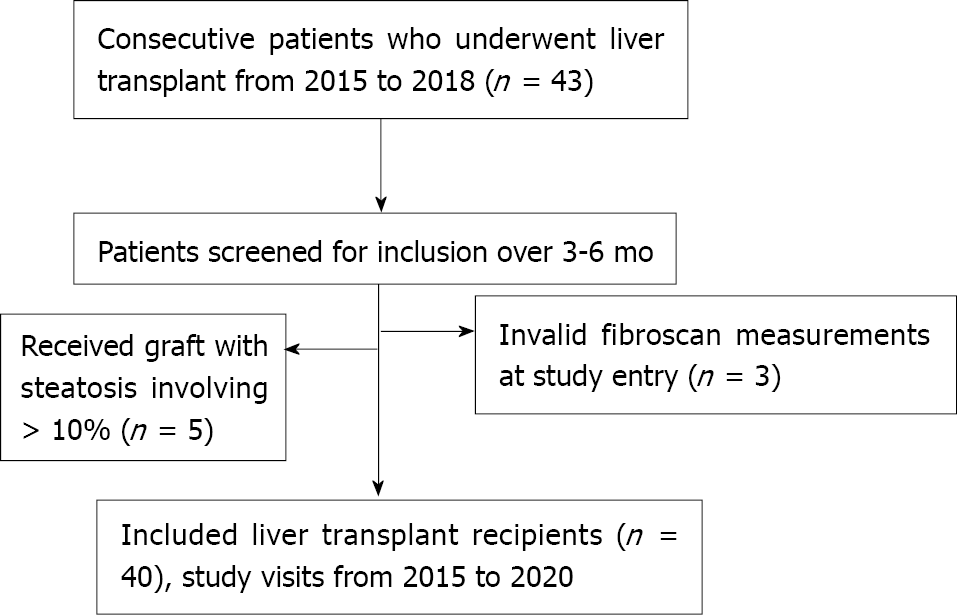
Figure 2 Flow chart displaying the selection of study participants.
Of 48 consecutive patients undergoing liver transplant, 3 were excluded because of invalid TE examination and 5 because they received a liver graft with steatosis involving > 10% of hepatocytes. TE: Transient elastography.
Figure 3 Hazard ratio by body mass index category in nonalcoholic fatty liver disease (log-rank: P < 0.
0001) and in nonalcoholic steatohepatitis (log-rank: P = 0.009). BMI: Body mass index; NAFLD: Nonalcoholic fatty liver disease; NASH: Nonalcoholic steatohepatitis.
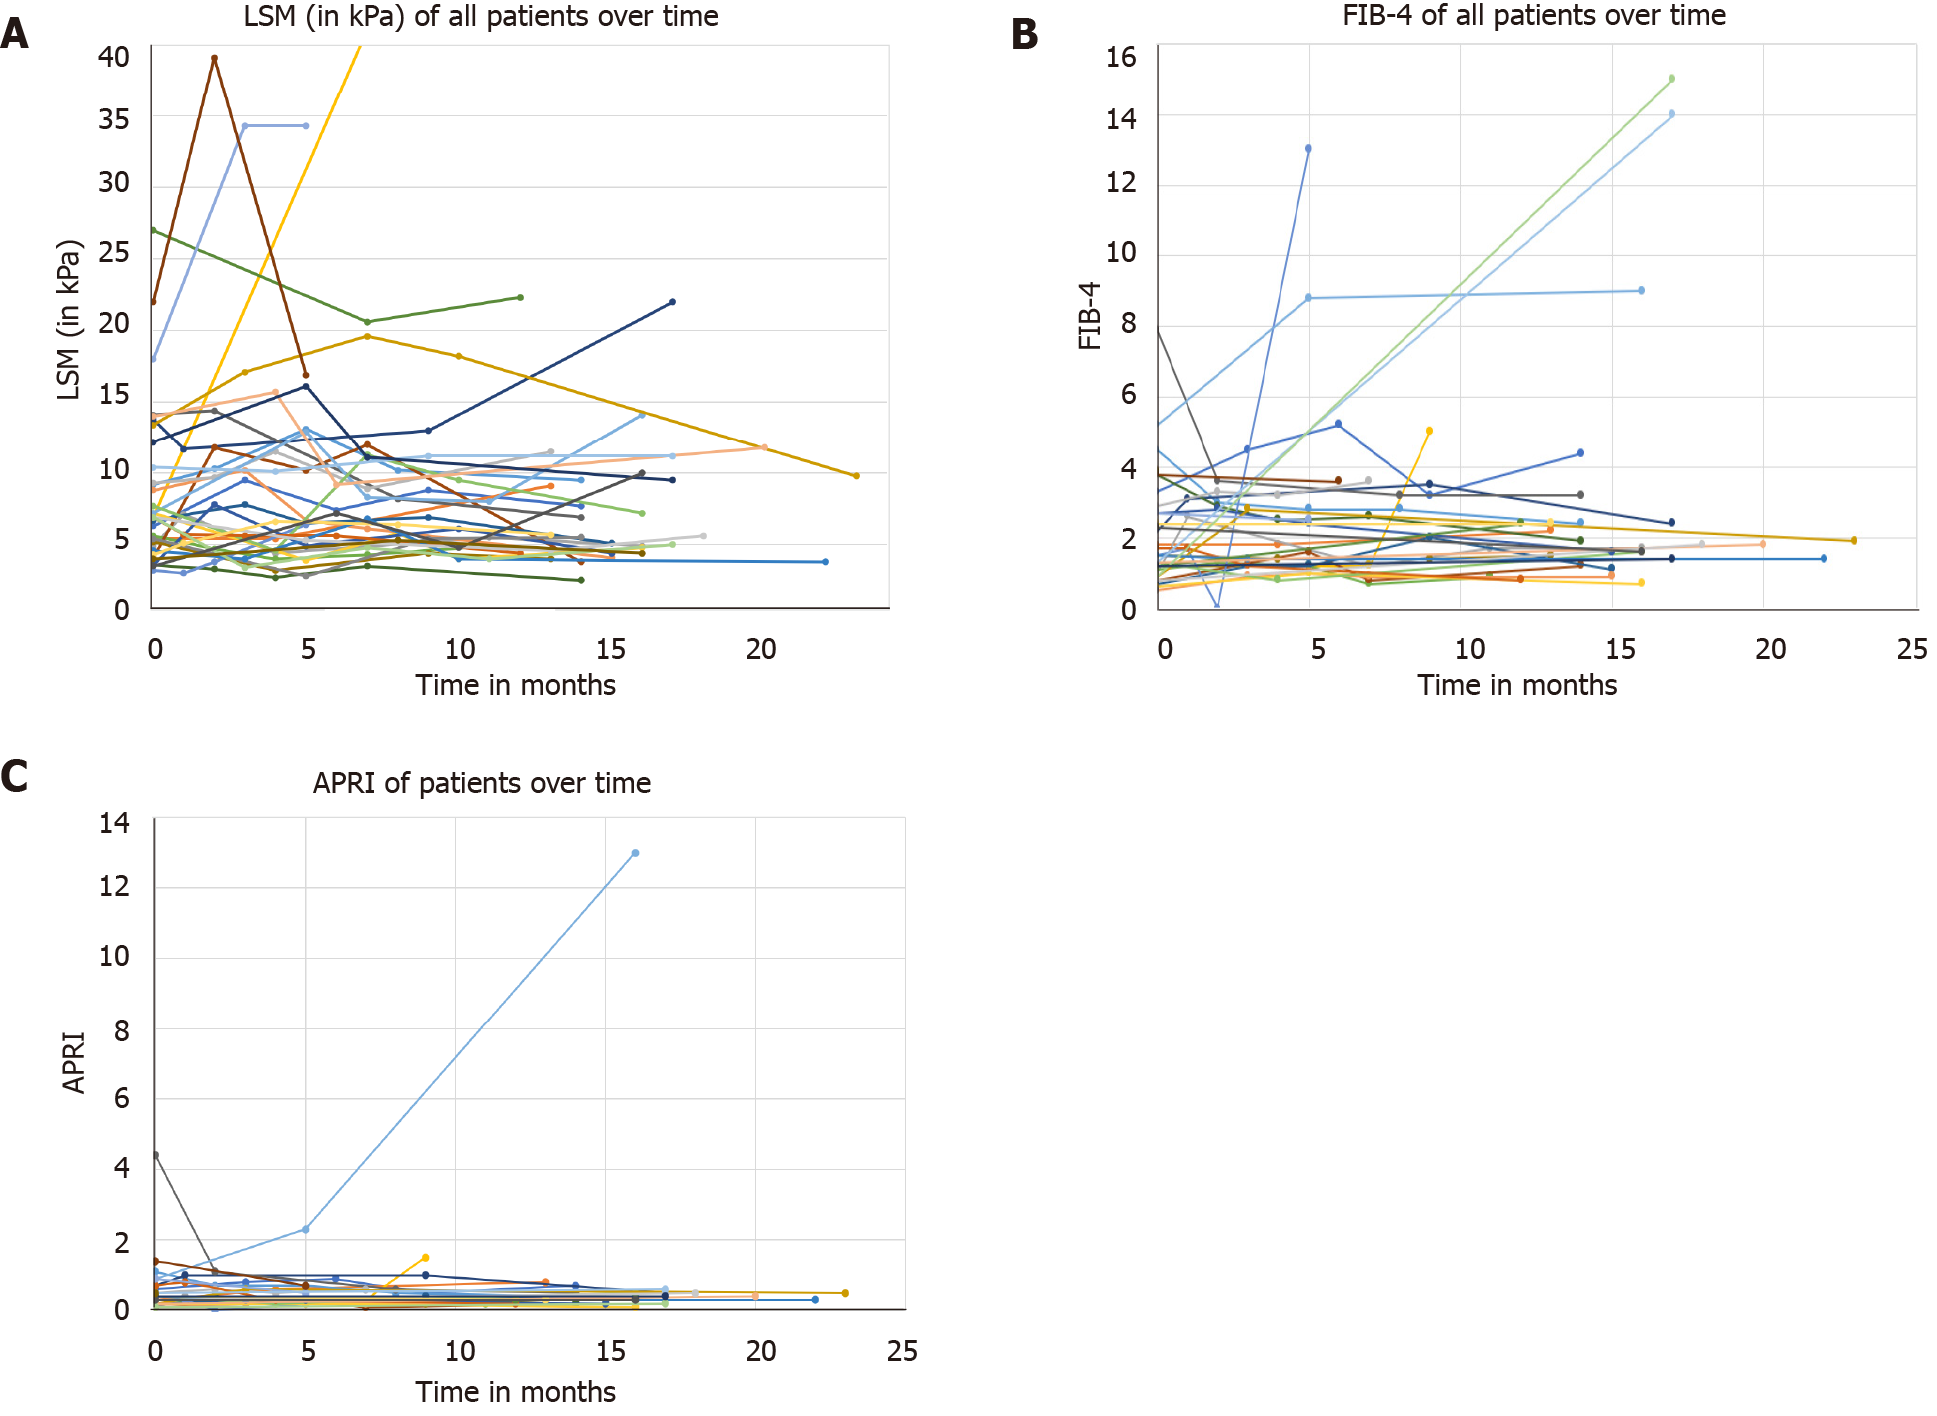
Figure 4 Spaghetti plot of changes.
A: Spaghetti plot of changes in liver stiffness measurement during study period; B: Spaghetti plot of changes in fibrosis-4 during study period; C: Spaghetti plot of changes in aspartate aminotransferase-to-Platelets Ratio Index. APRI: Aspartate aminotransferase-to-Platelets Ratio Index; FIB-4: Fibrosis-4; LSM: Liver stiffness measurement.
- Citation: Alhinai A, Qayyum-Khan A, Zhang X, Samaha P, Metrakos P, Deschenes M, Wong P, Ghali P, Chen TY, Sebastiani G. Non-alcoholic steatohepatitis in liver transplant recipients diagnosed by serum cytokeratin 18 and transient elastography: A prospective study. World J Hepatol 2021; 13(12): 2179-2191
- URL: https://www.wjgnet.com/1948-5182/full/v13/i12/2179.htm
- DOI: https://dx.doi.org/10.4254/wjh.v13.i12.2179


