Copyright
©The Author(s) 2021.
World J Hepatol. Jan 27, 2021; 13(1): 94-108
Published online Jan 27, 2021. doi: 10.4254/wjh.v13.i1.94
Published online Jan 27, 2021. doi: 10.4254/wjh.v13.i1.94
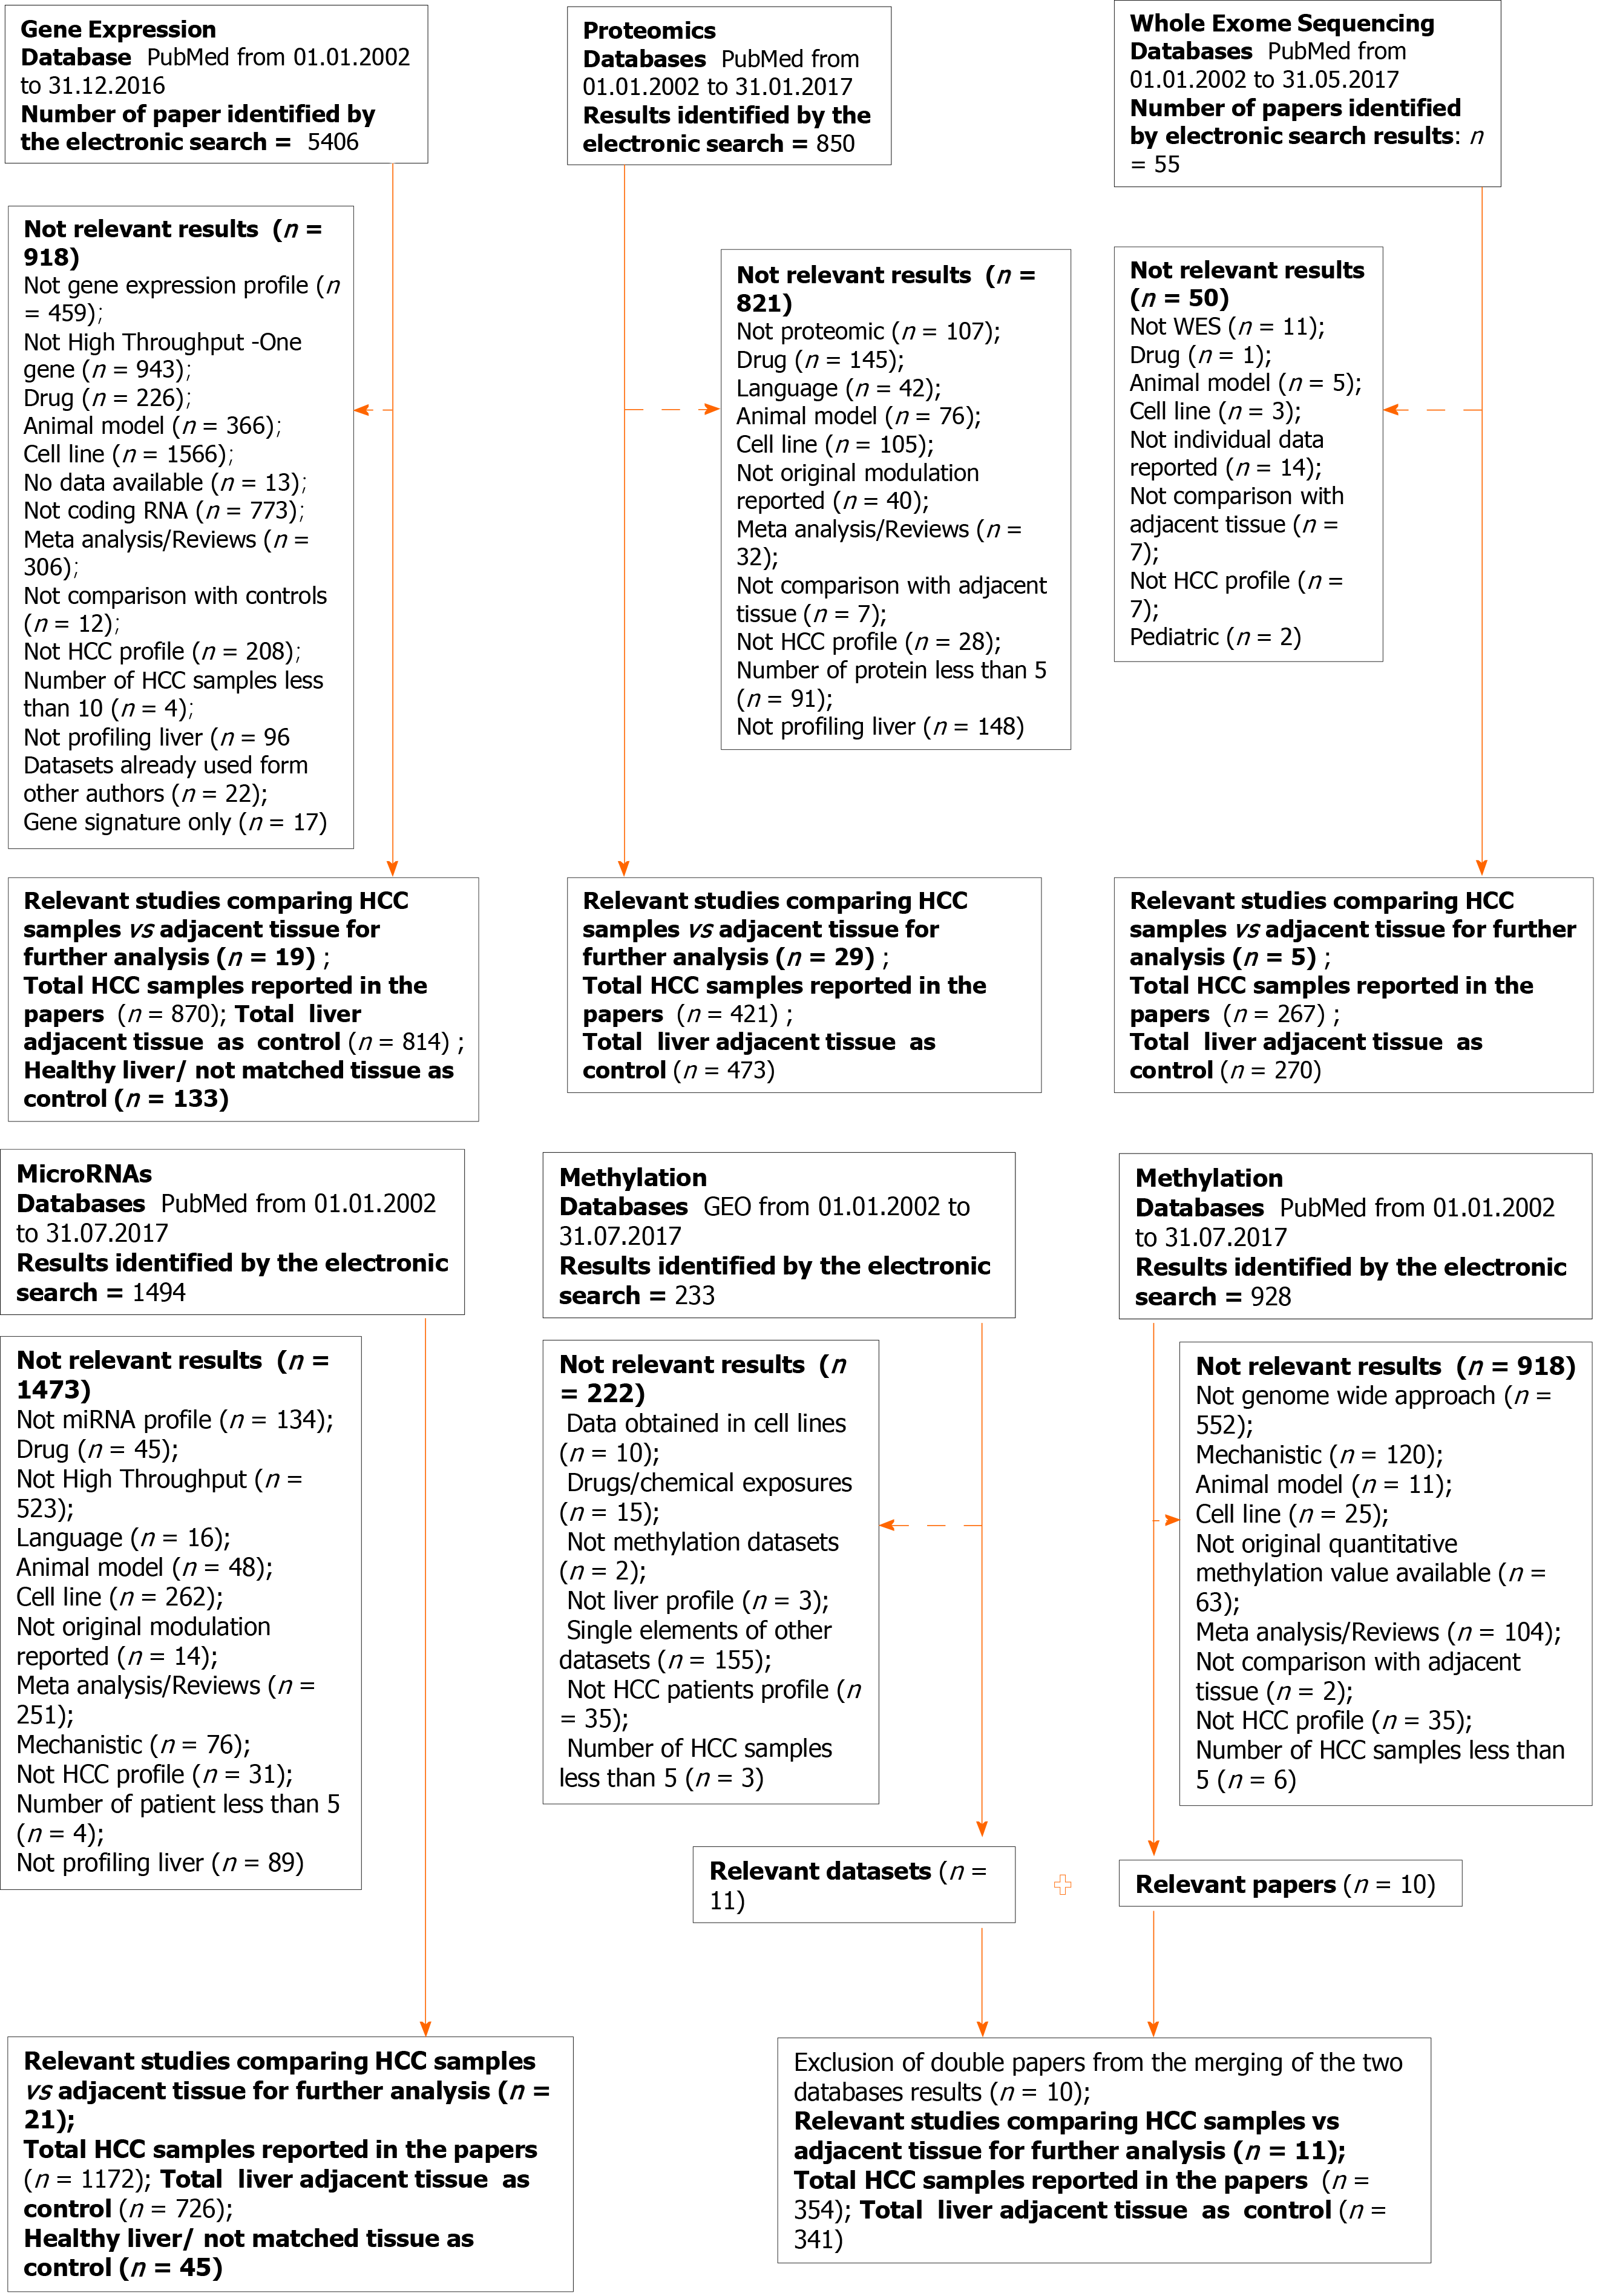
Figure 1 Flow chart showing the paper selection process and exclusion criteria for each data type: Gene expression, proteomics, whole exome sequencing, microRNAs and methylation.
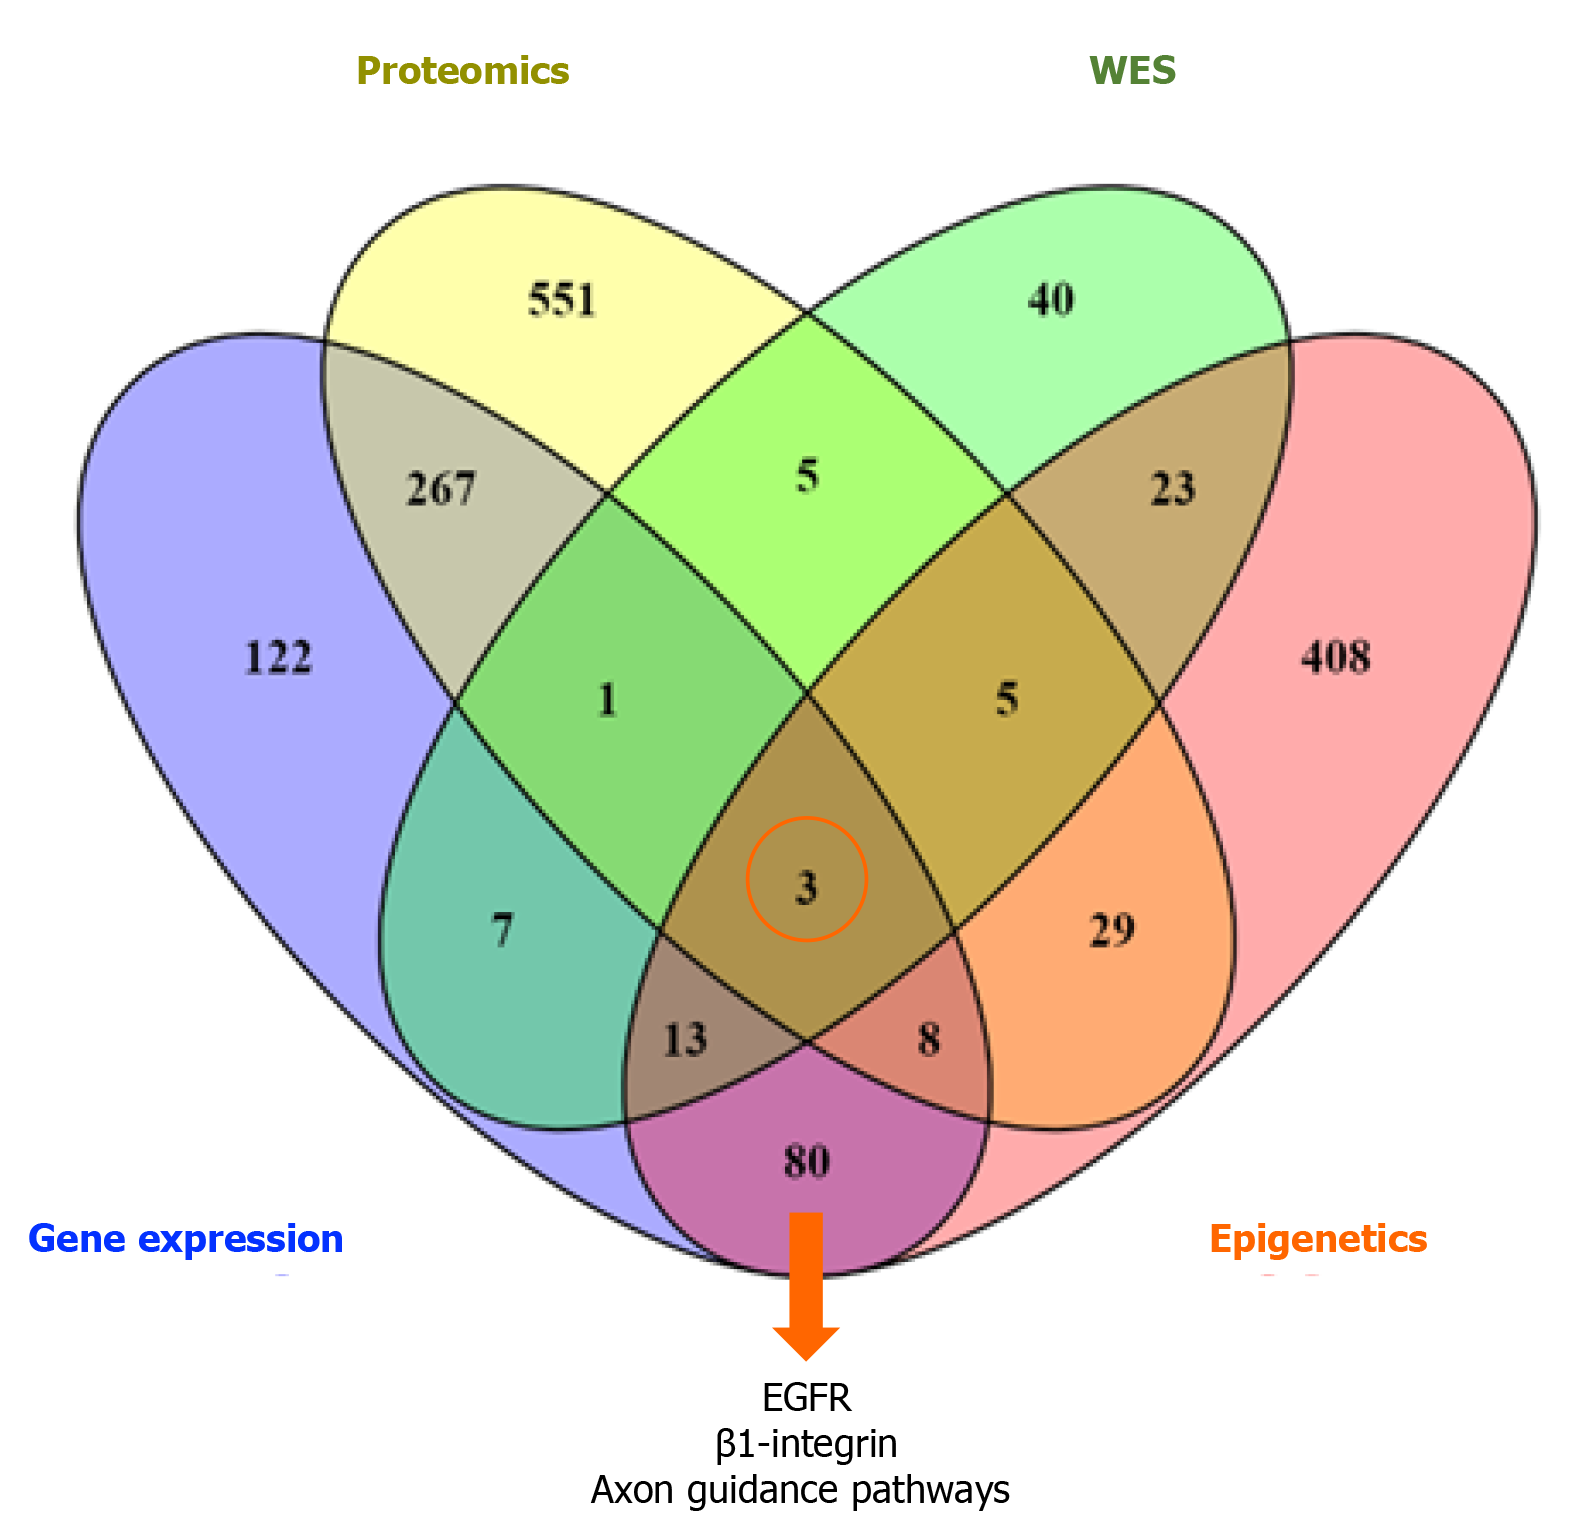
Figure 2 Venn diagram shows the three common pathways (EGFR, epidermal growth factor, β1-integrin, and axon guidance pathways) across the four different types of data.
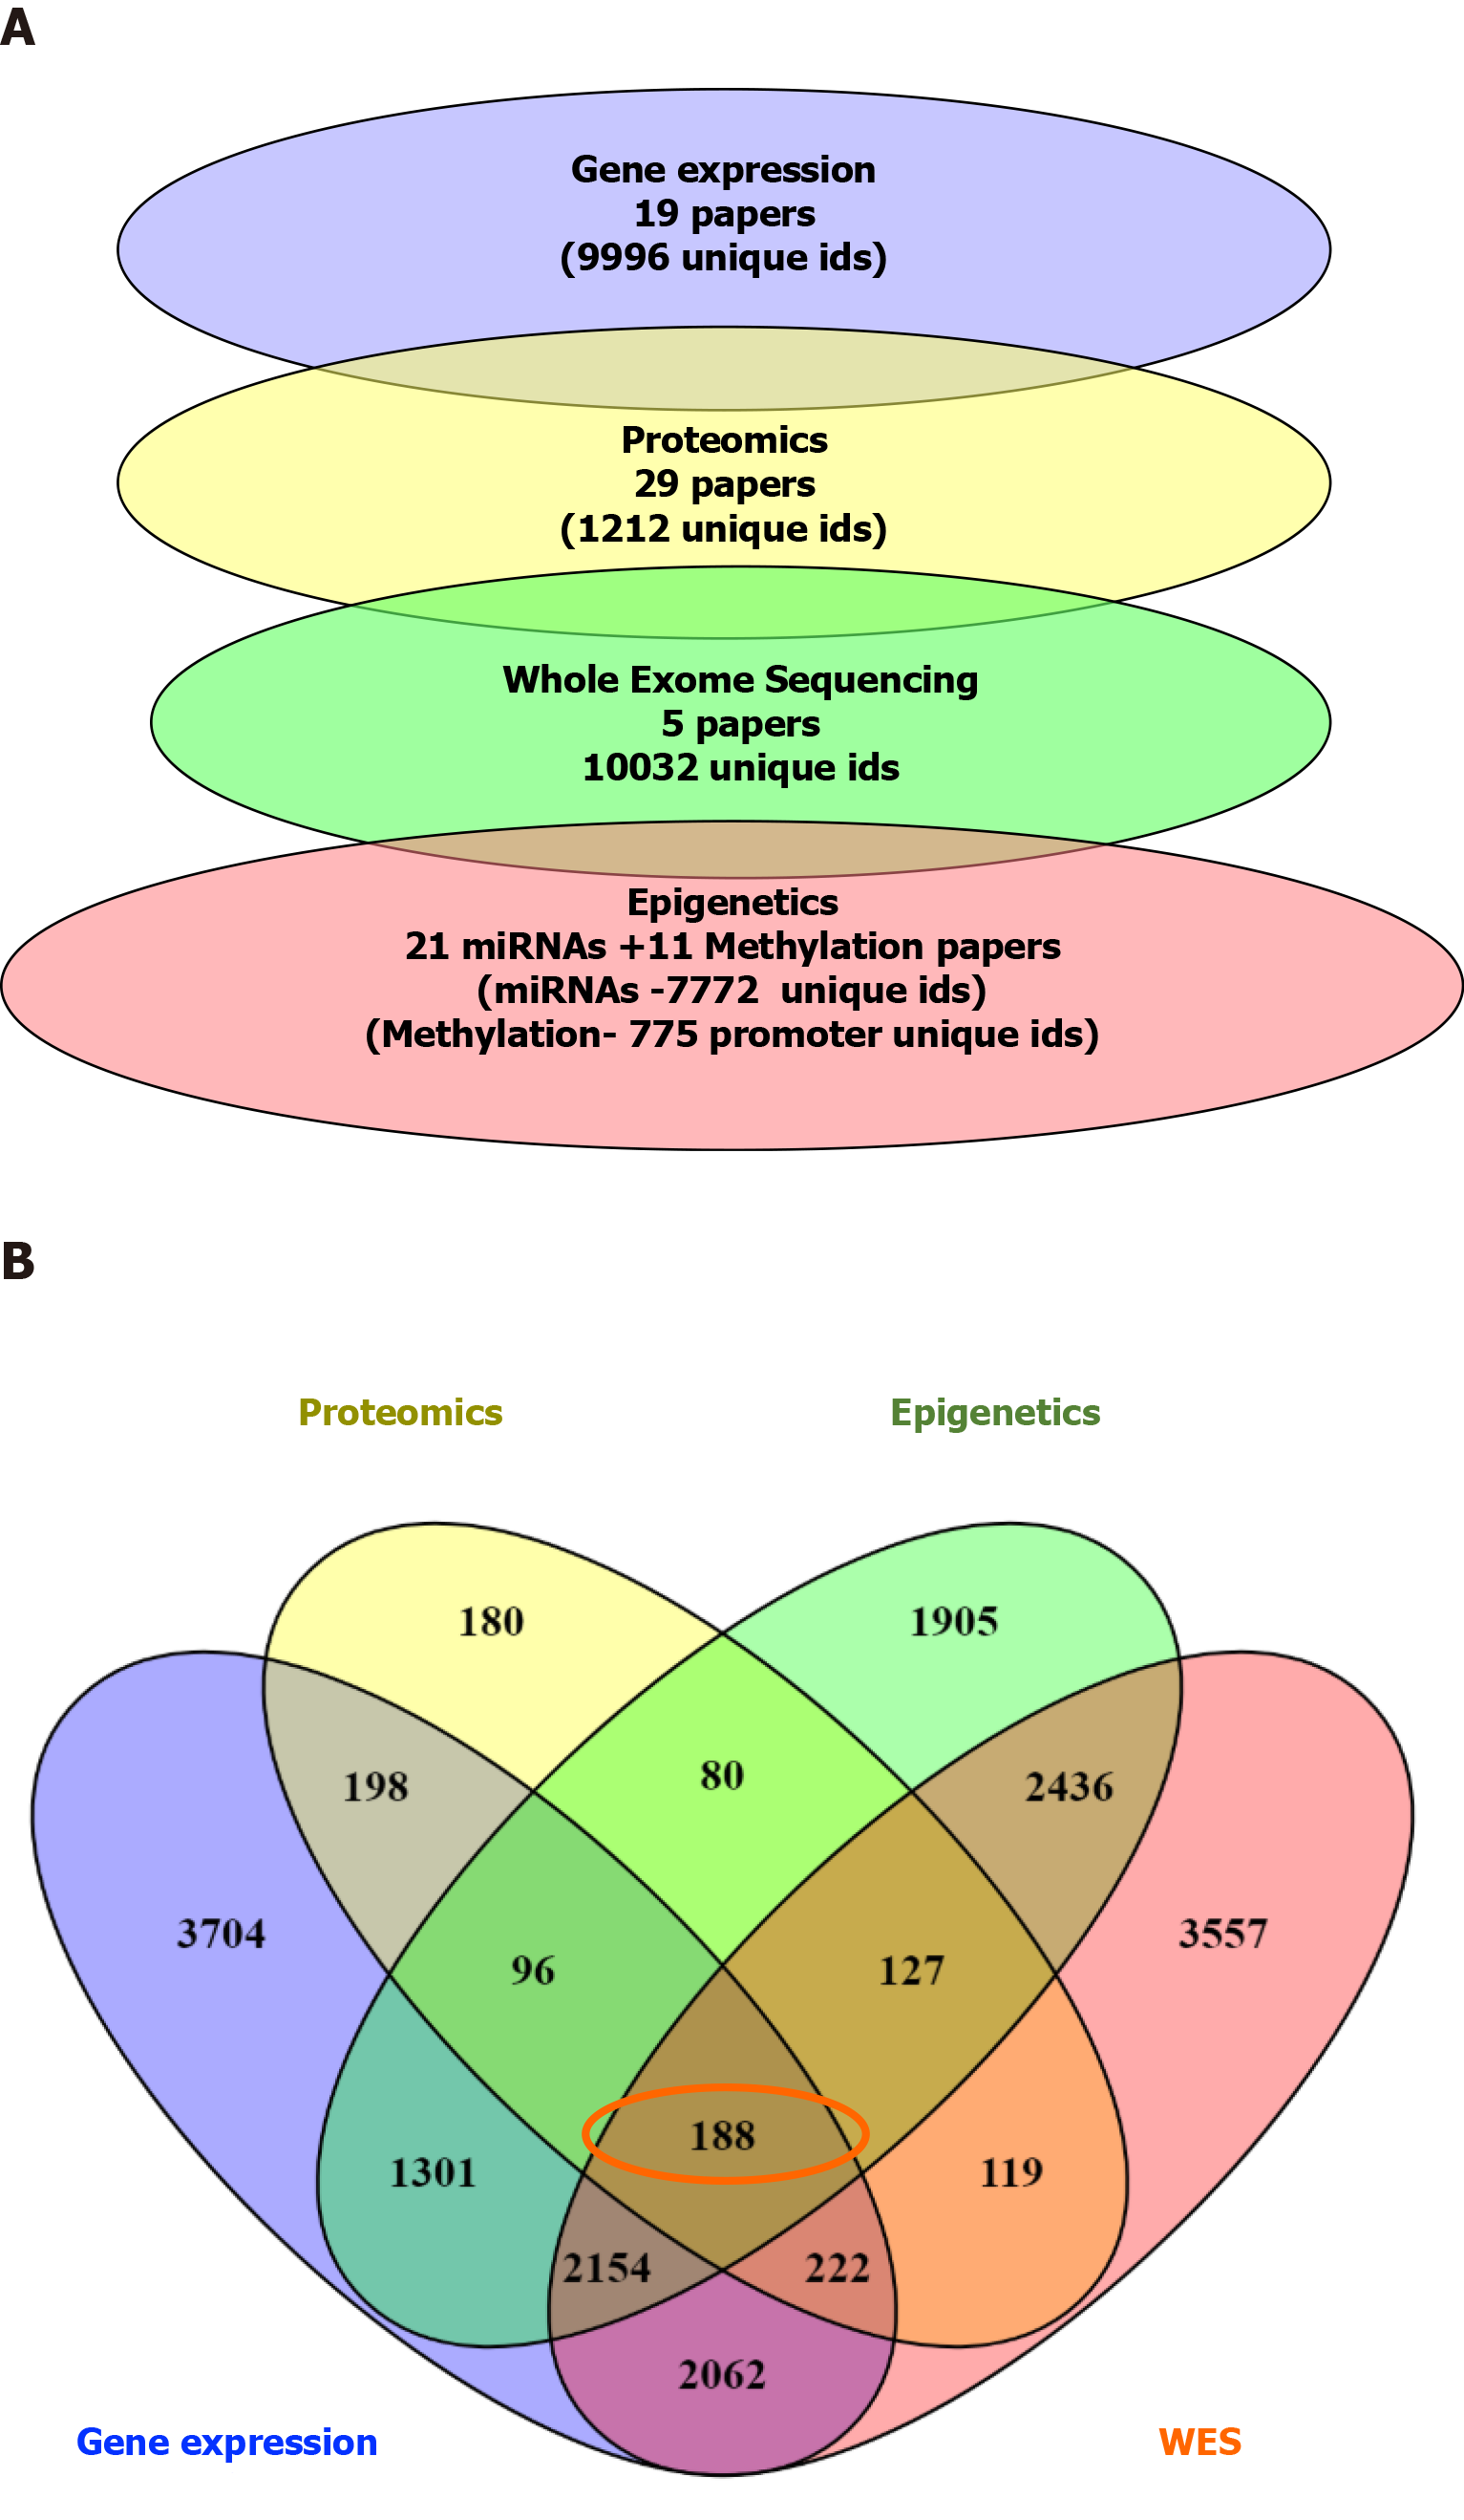
Figure 3 From the previous list of 188 common dysregulated elements in all different layers of data.
A: Number of genes/proteins identified in each data type; B: Venn diagram showing the 188 genes identified as commonly deregulated across the 4 different type of data.
- Citation: Bhat M, Pasini E, Pastrello C, Rahmati S, Angeli M, Kotlyar M, Ghanekar A, Jurisica I. Integrative analysis of layers of data in hepatocellular carcinoma reveals pathway dependencies. World J Hepatol 2021; 13(1): 94-108
- URL: https://www.wjgnet.com/1948-5182/full/v13/i1/94.htm
- DOI: https://dx.doi.org/10.4254/wjh.v13.i1.94


