Copyright
©The Author(s) 2020.
World J Hepatol. Sep 27, 2020; 12(9): 661-671
Published online Sep 27, 2020. doi: 10.4254/wjh.v12.i9.661
Published online Sep 27, 2020. doi: 10.4254/wjh.v12.i9.661
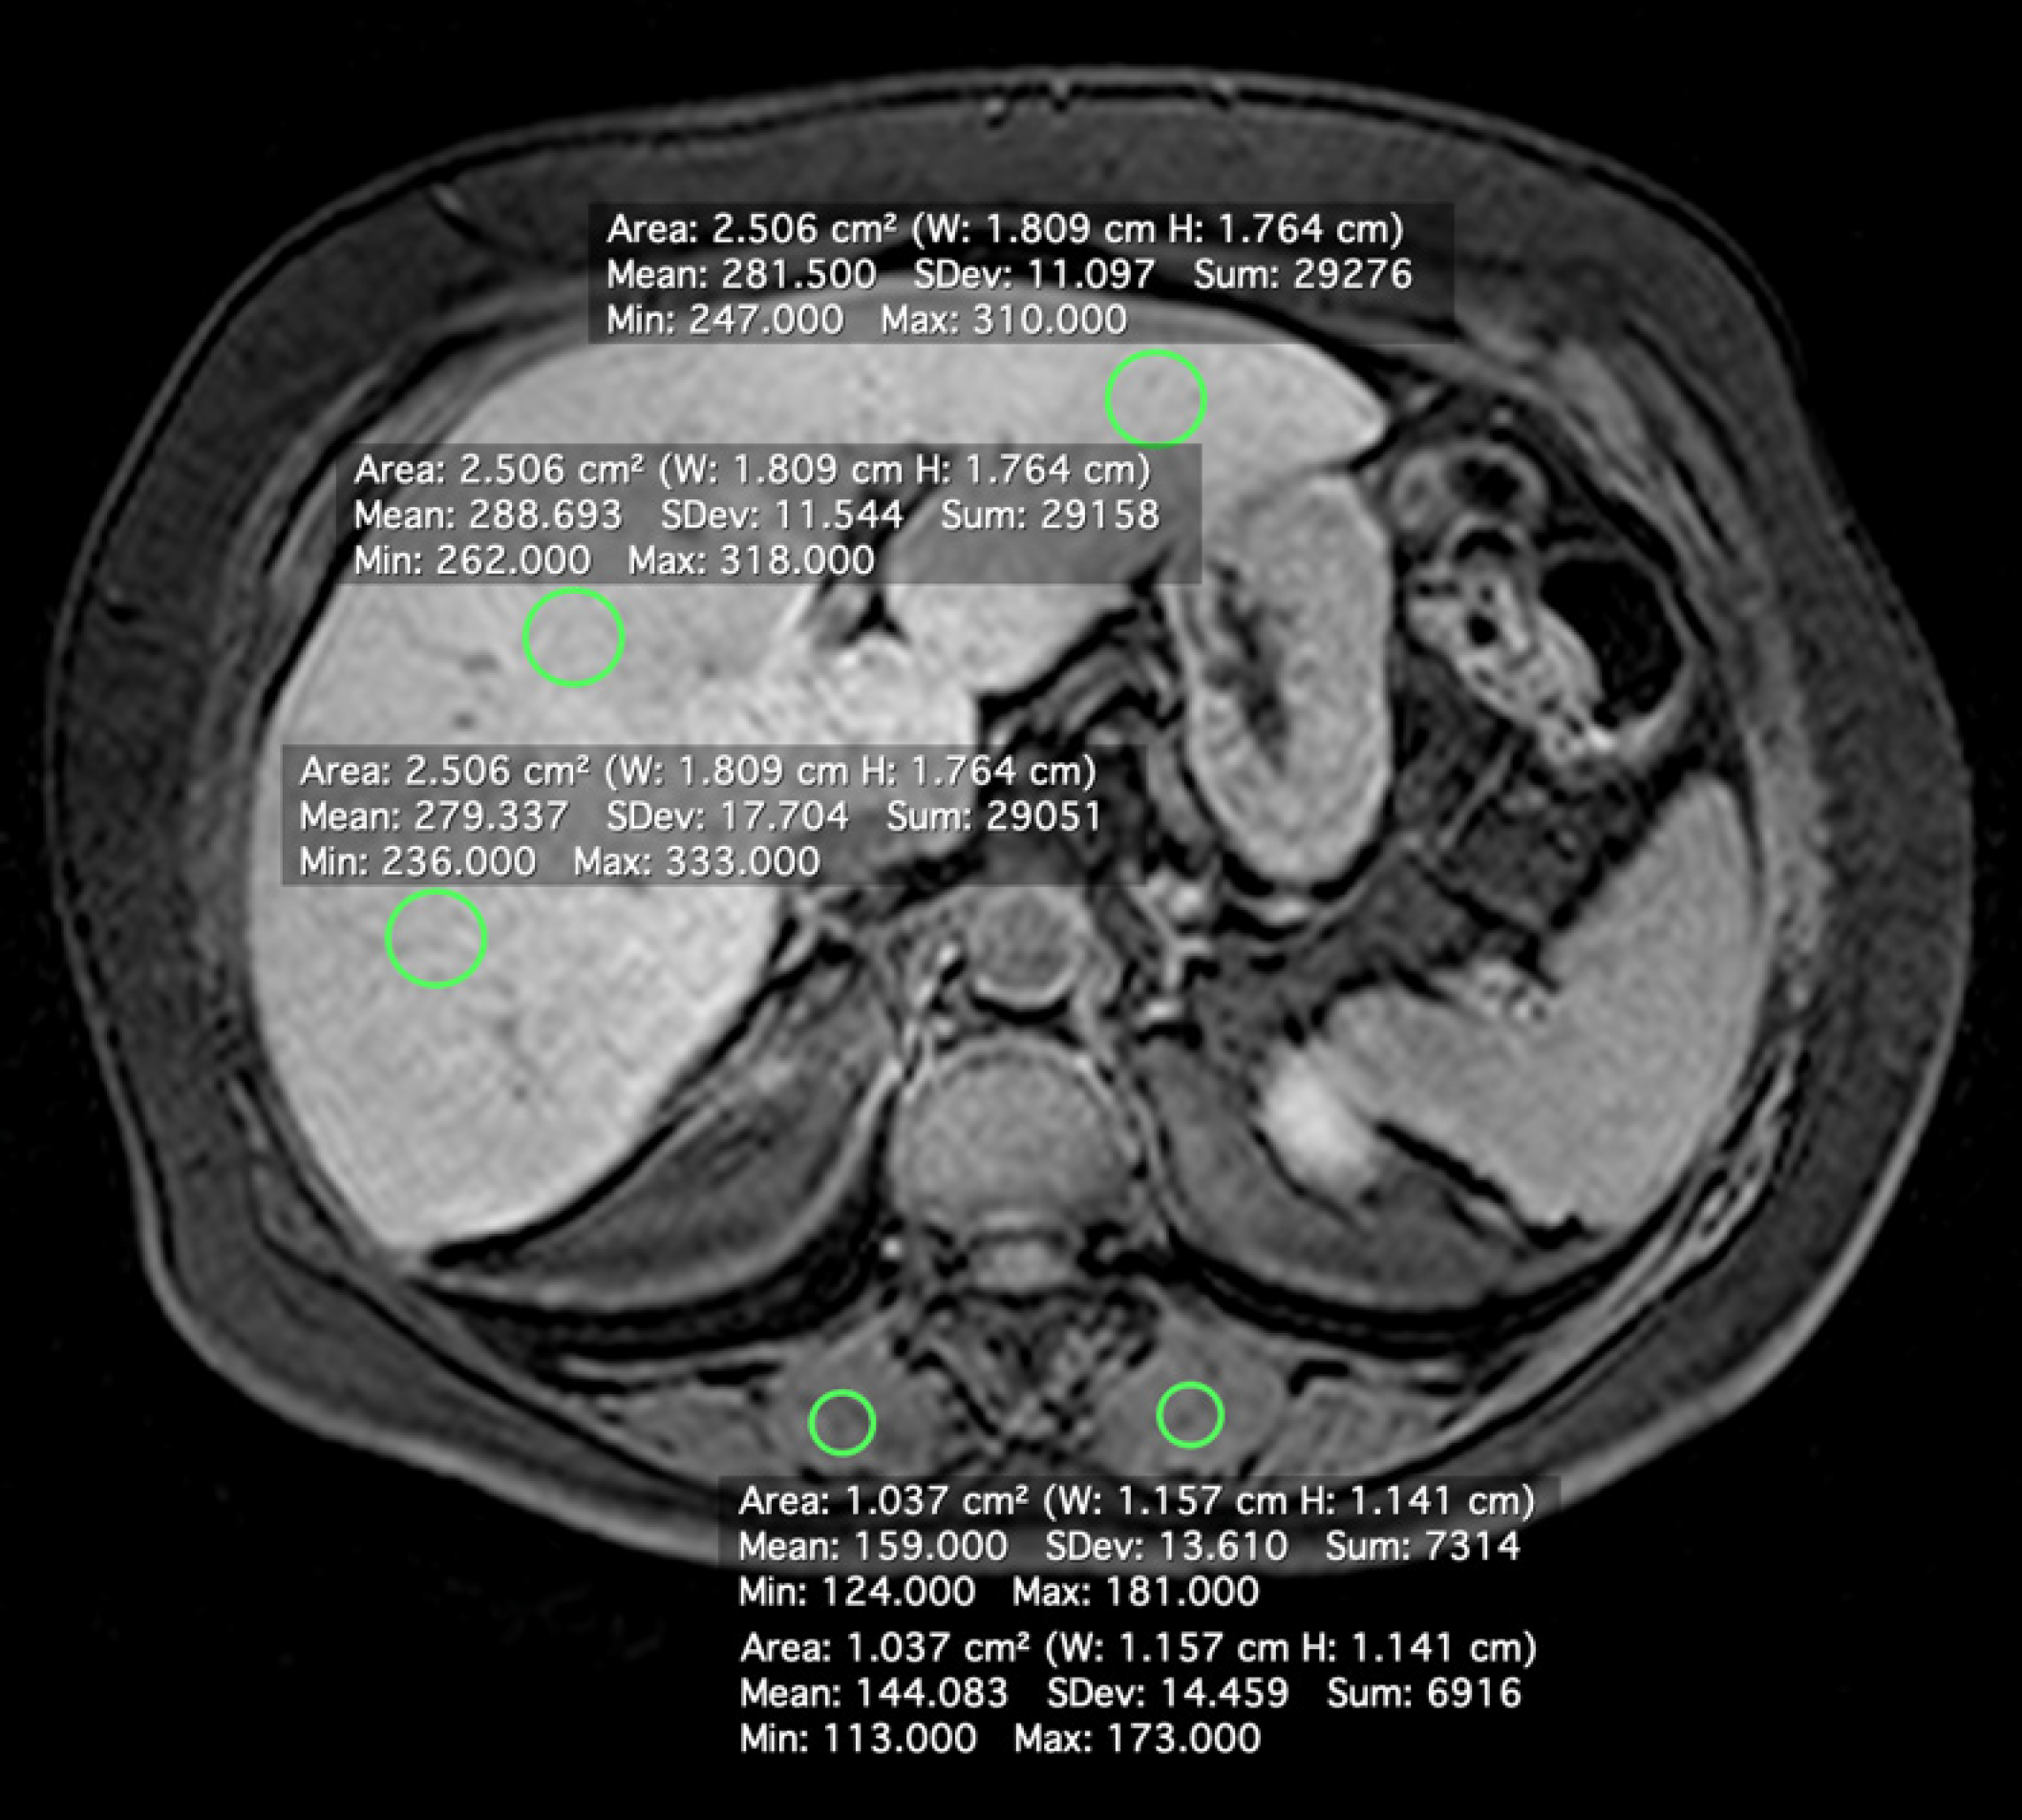
Figure 1 Axial magnetic resonance image showing the positions of regions of interest for the measurement of signal intensity of the liver parenchyma and paravertebral muscles.
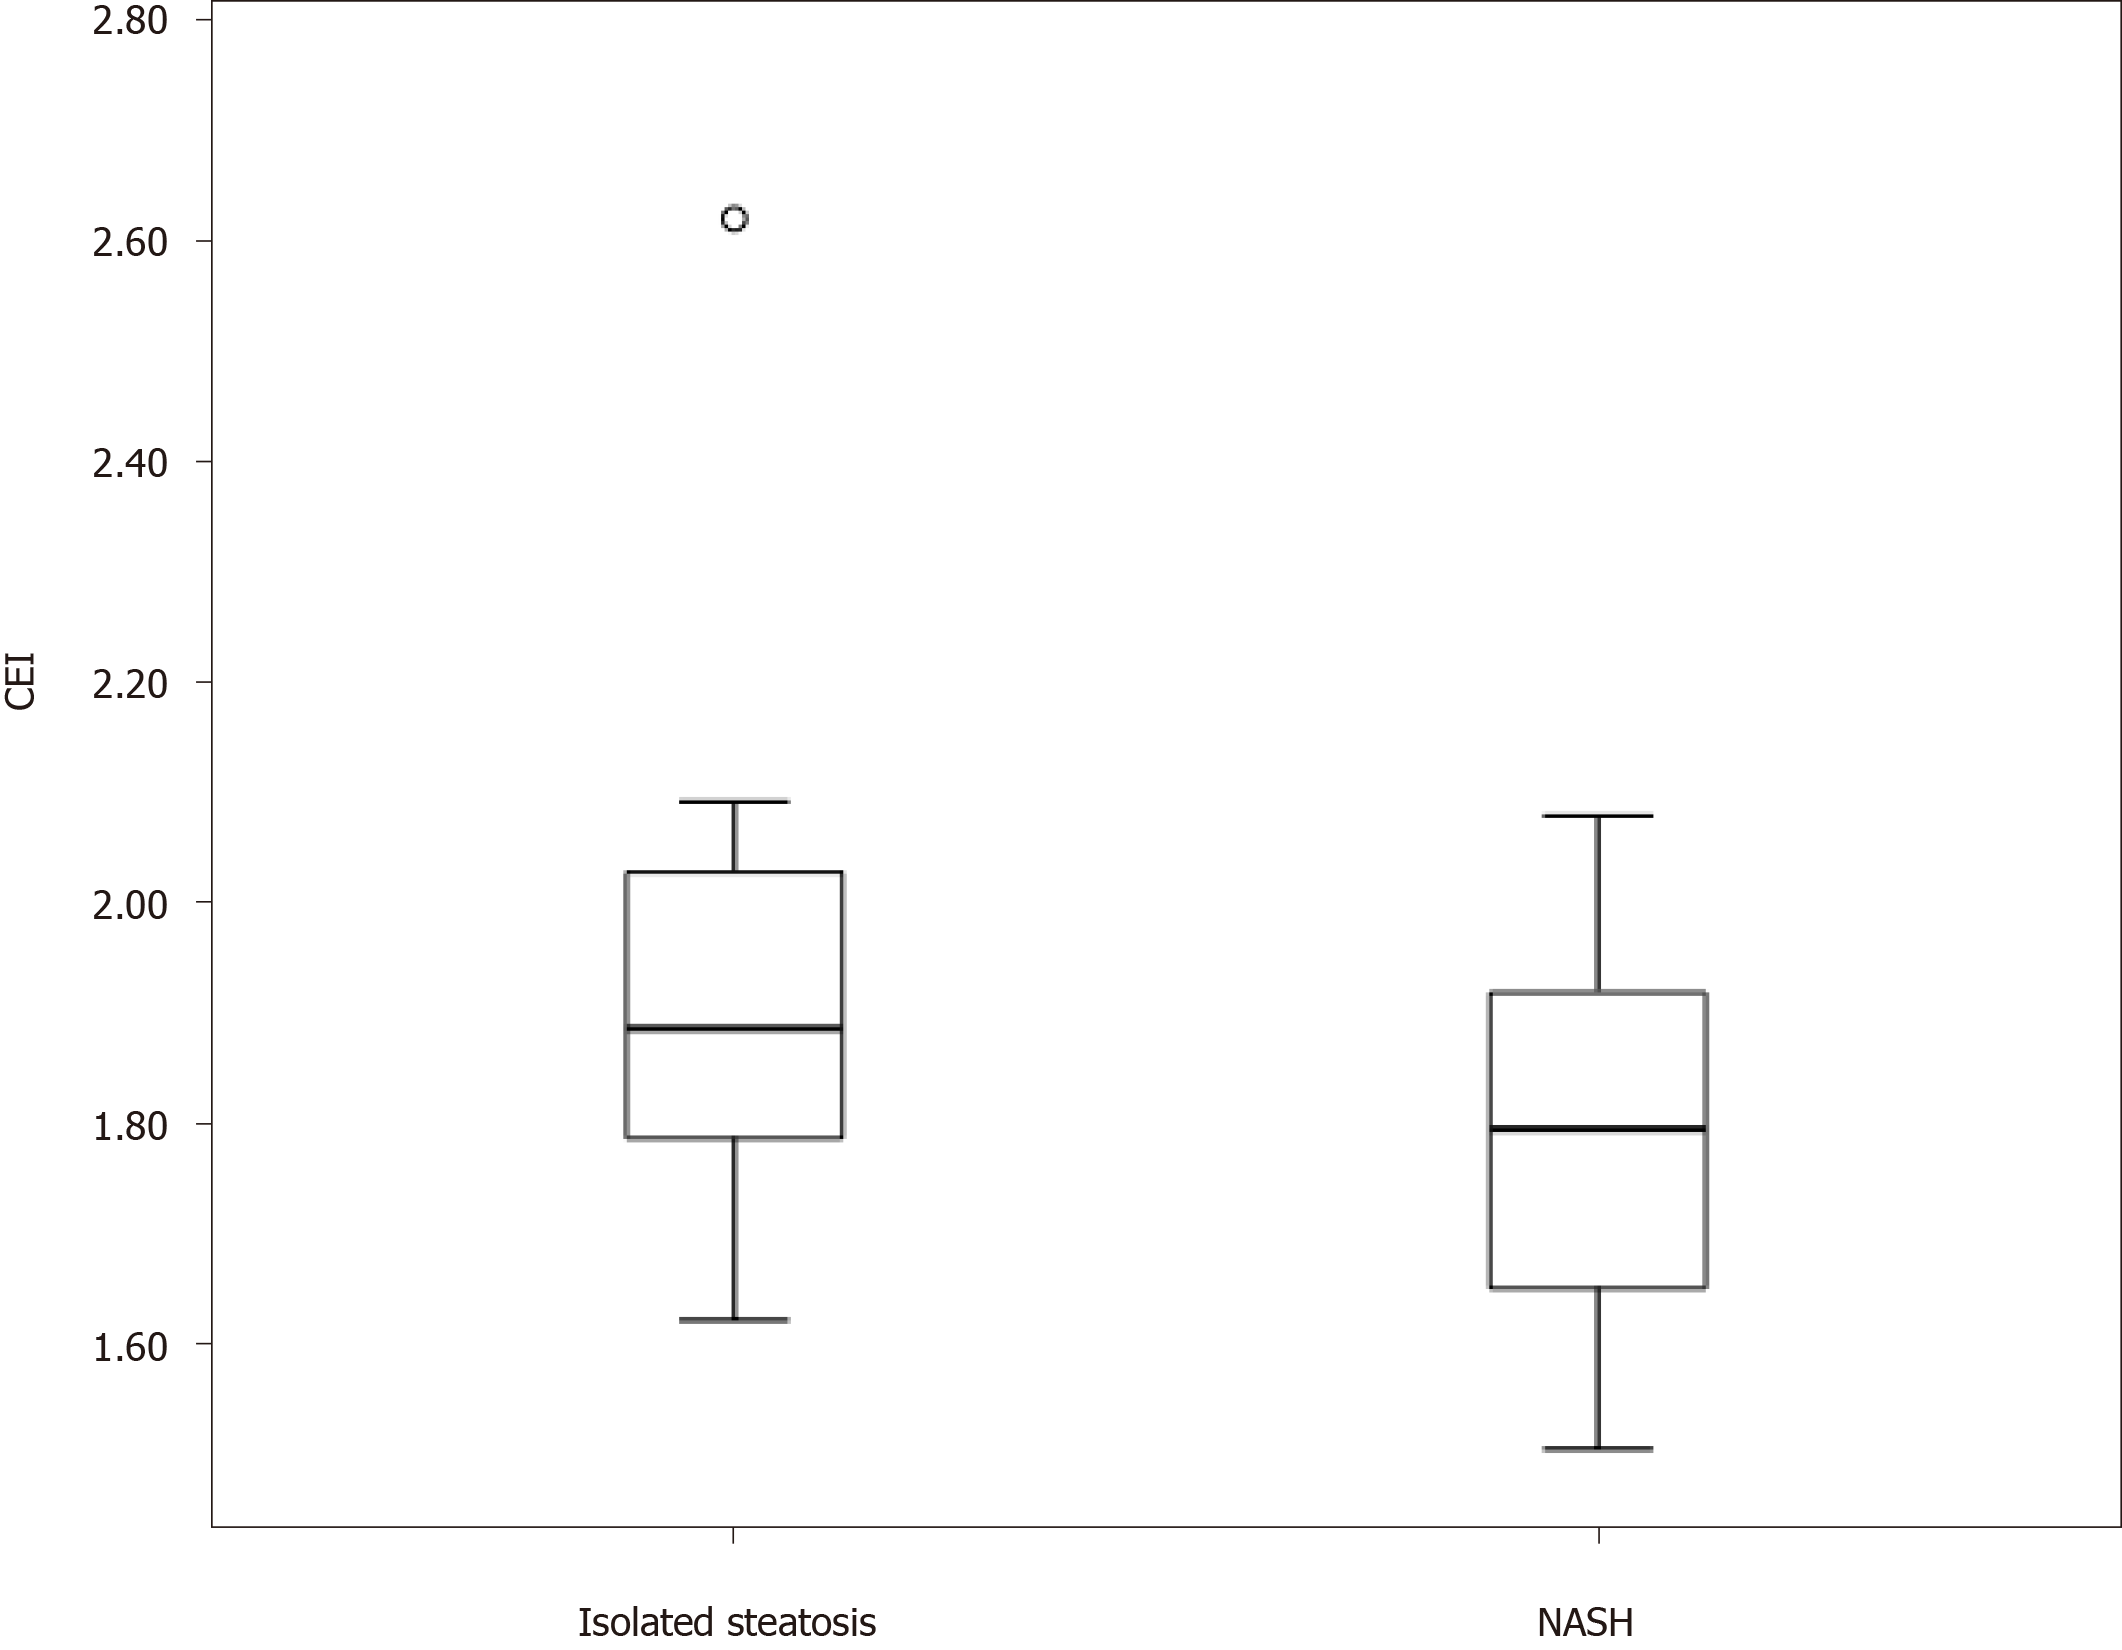
Figure 2 Boxplot of contrast enhancement indices in the isolated steatosis and nonalcoholic steatohepatitis groups.
CEI: Contrast enhancement index.
Figure 3 Contrast enhancement index cut-offs values suggested.
NASH: Nonalcoholic steatohepatitis; CEI: Contrast enhancement index.
- Citation: Amorim VB, Parente DB, Paiva FF, Oliveira Neto JA, Miranda AA, Moreira CC, Fernandes FF, Campos CFF, Leite NC, Perez RM, Rodrigues RS. Can gadoxetic acid–enhanced magnetic resonance imaging be used to avoid liver biopsy in patients with nonalcoholic fatty liver disease? World J Hepatol 2020; 12(9): 661-671
- URL: https://www.wjgnet.com/1948-5182/full/v12/i9/661.htm
- DOI: https://dx.doi.org/10.4254/wjh.v12.i9.661


