Copyright
©The Author(s) 2020.
World J Hepatol. Dec 27, 2020; 12(12): 1276-1288
Published online Dec 27, 2020. doi: 10.4254/wjh.v12.i12.1276
Published online Dec 27, 2020. doi: 10.4254/wjh.v12.i12.1276
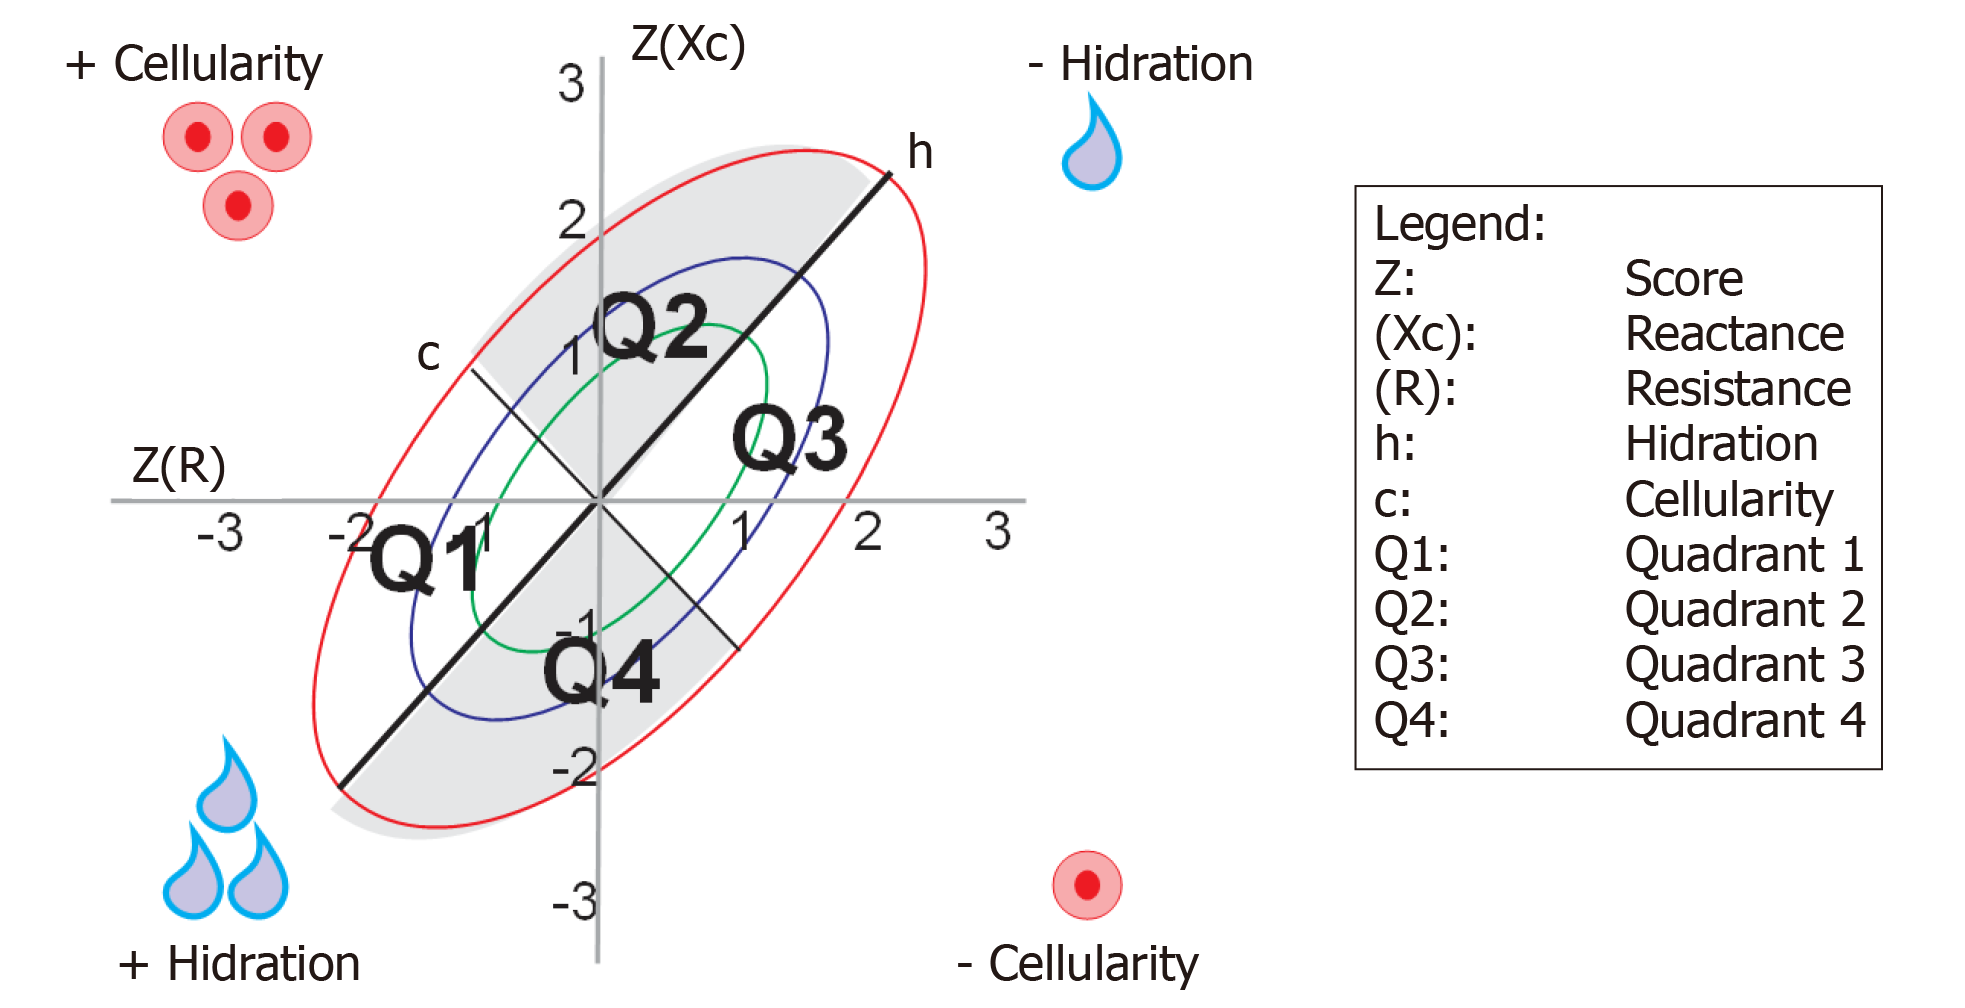
Figure 1 Graphic representation of bioelectrical impedance vector analysis by quadrants and ellipses, according to body conditions.
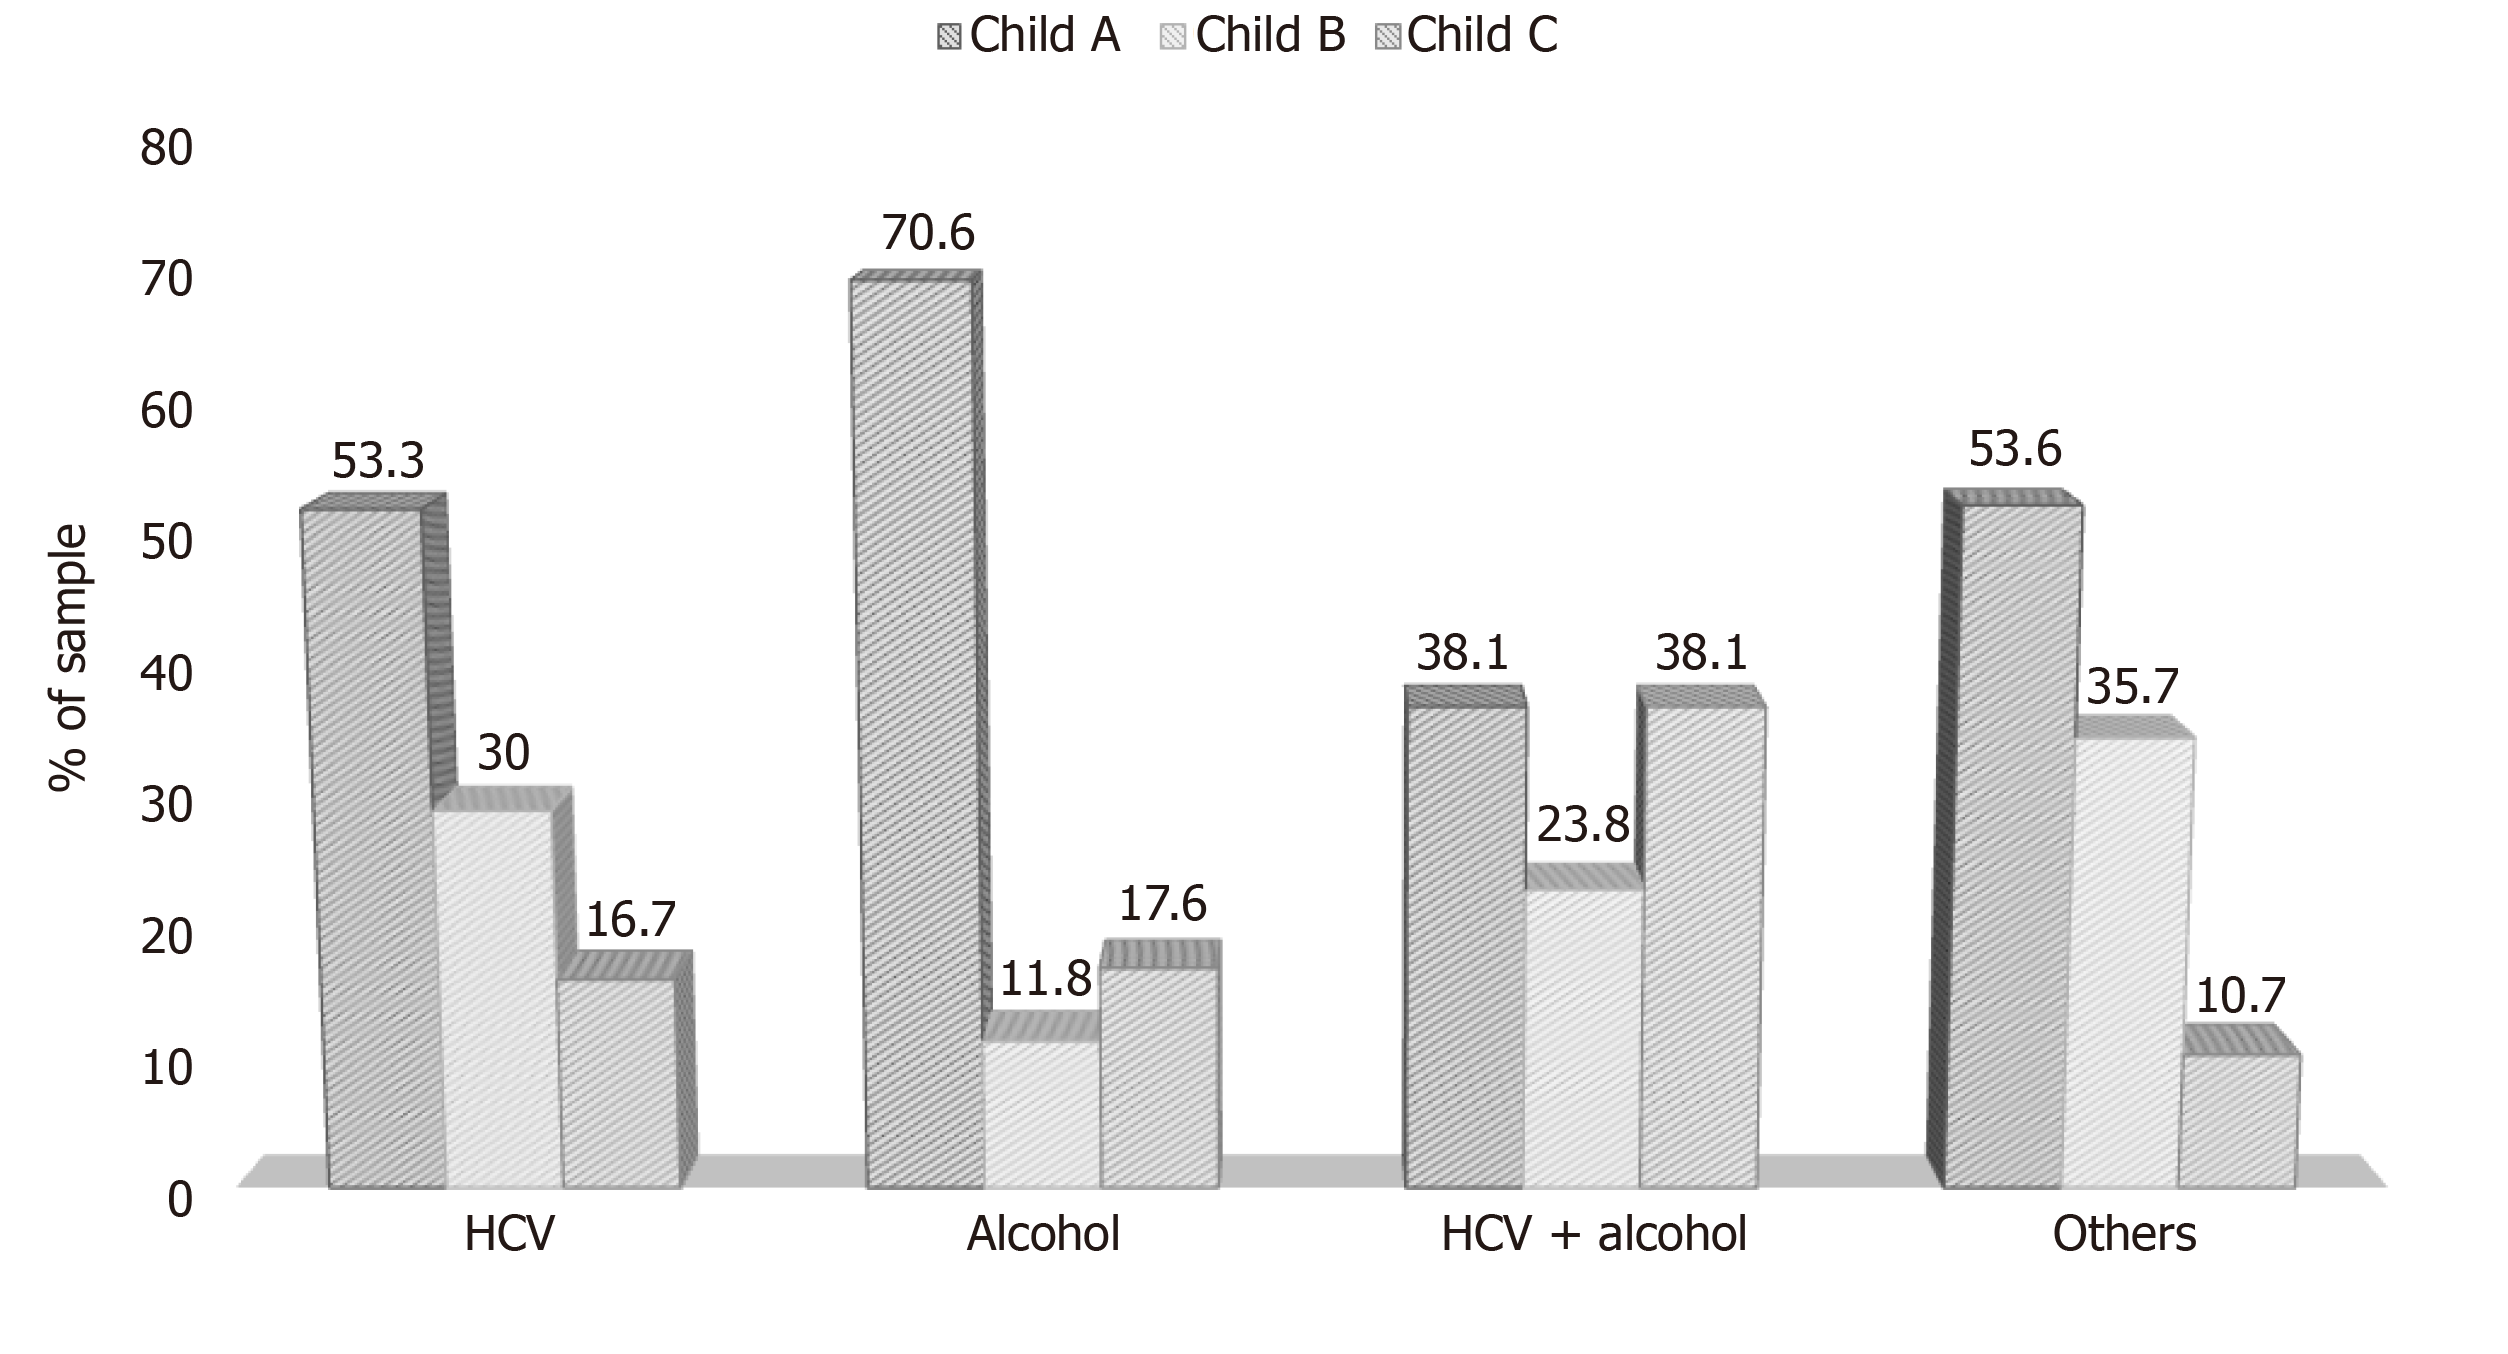
Figure 2 Association between etiology and the Child-Turcotte-Pugh score.
Others refer to hepatitis B virus, autoimmune, cholestatic disease, non-alcoholic fatty liver disease, and cryptogenic. HCV: Hepatitis C virus.
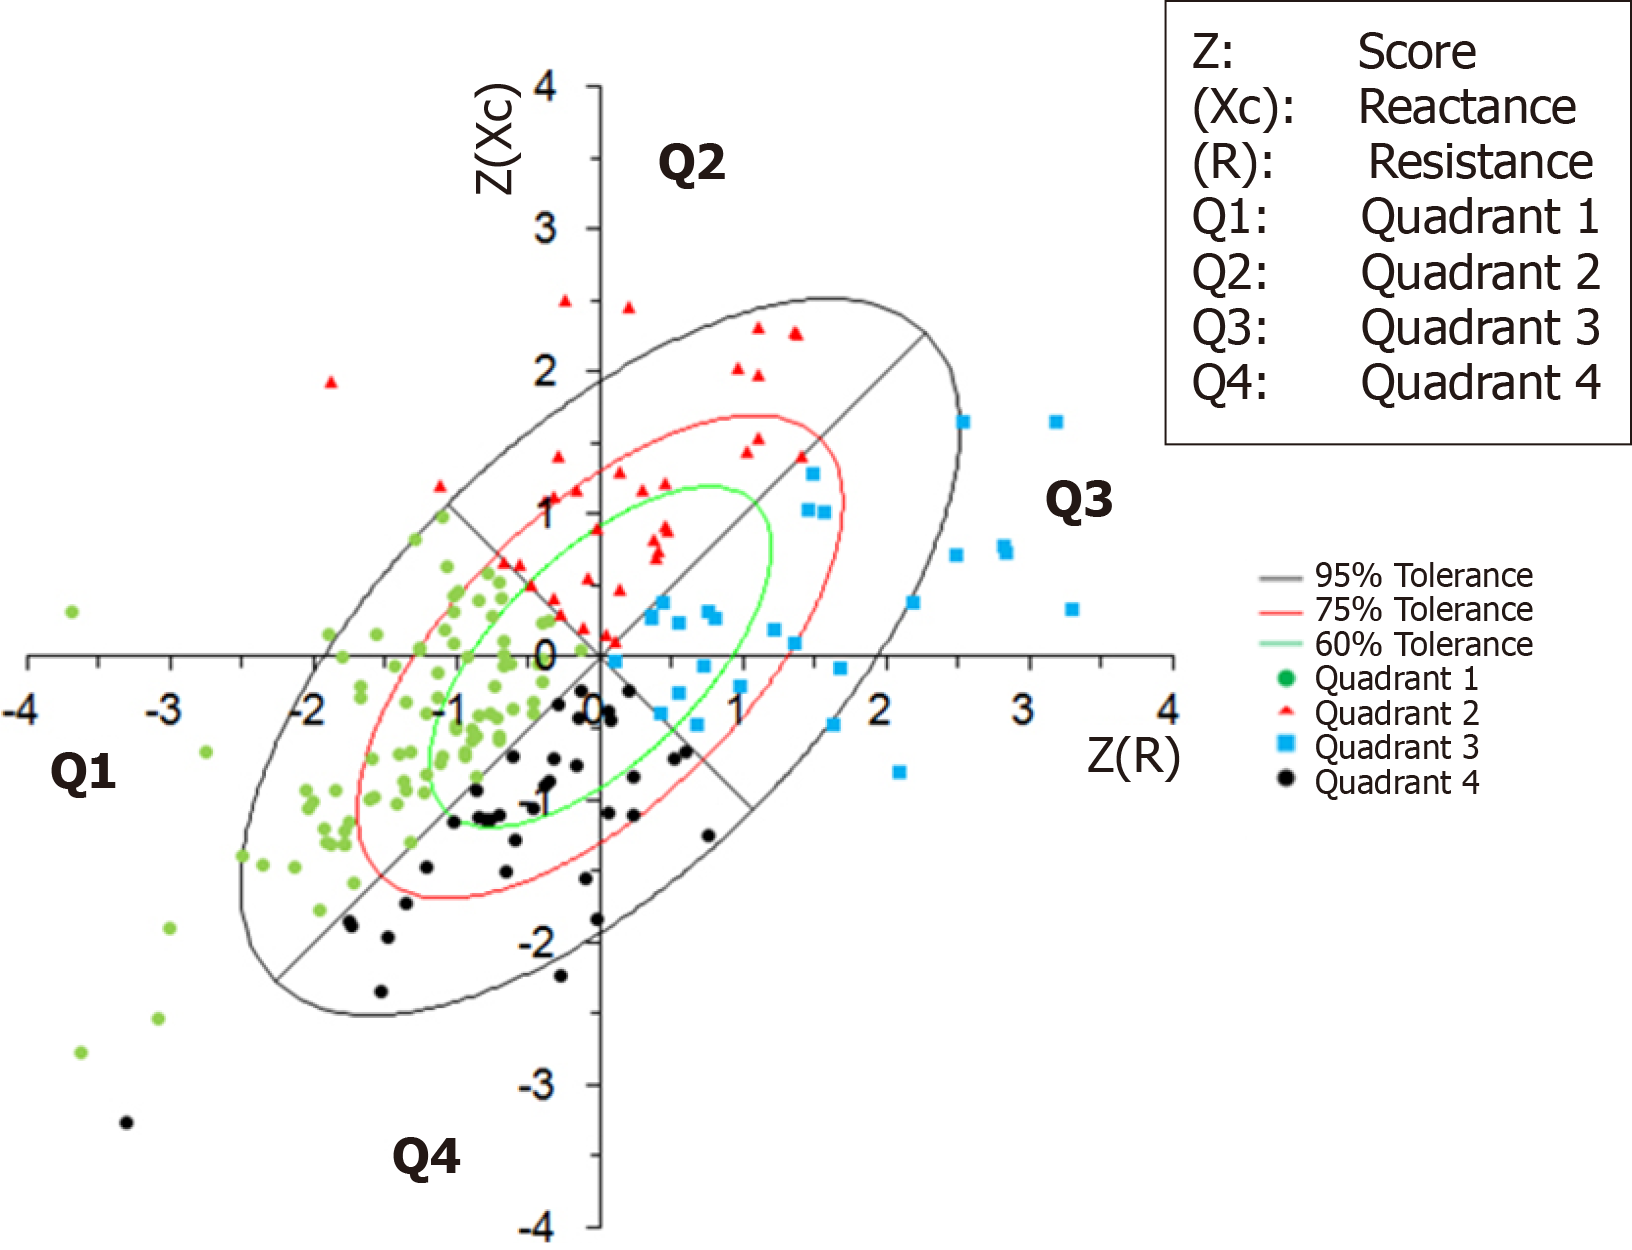
Figure 3 Bioelectrical impedance vector analysis - sample distribution.
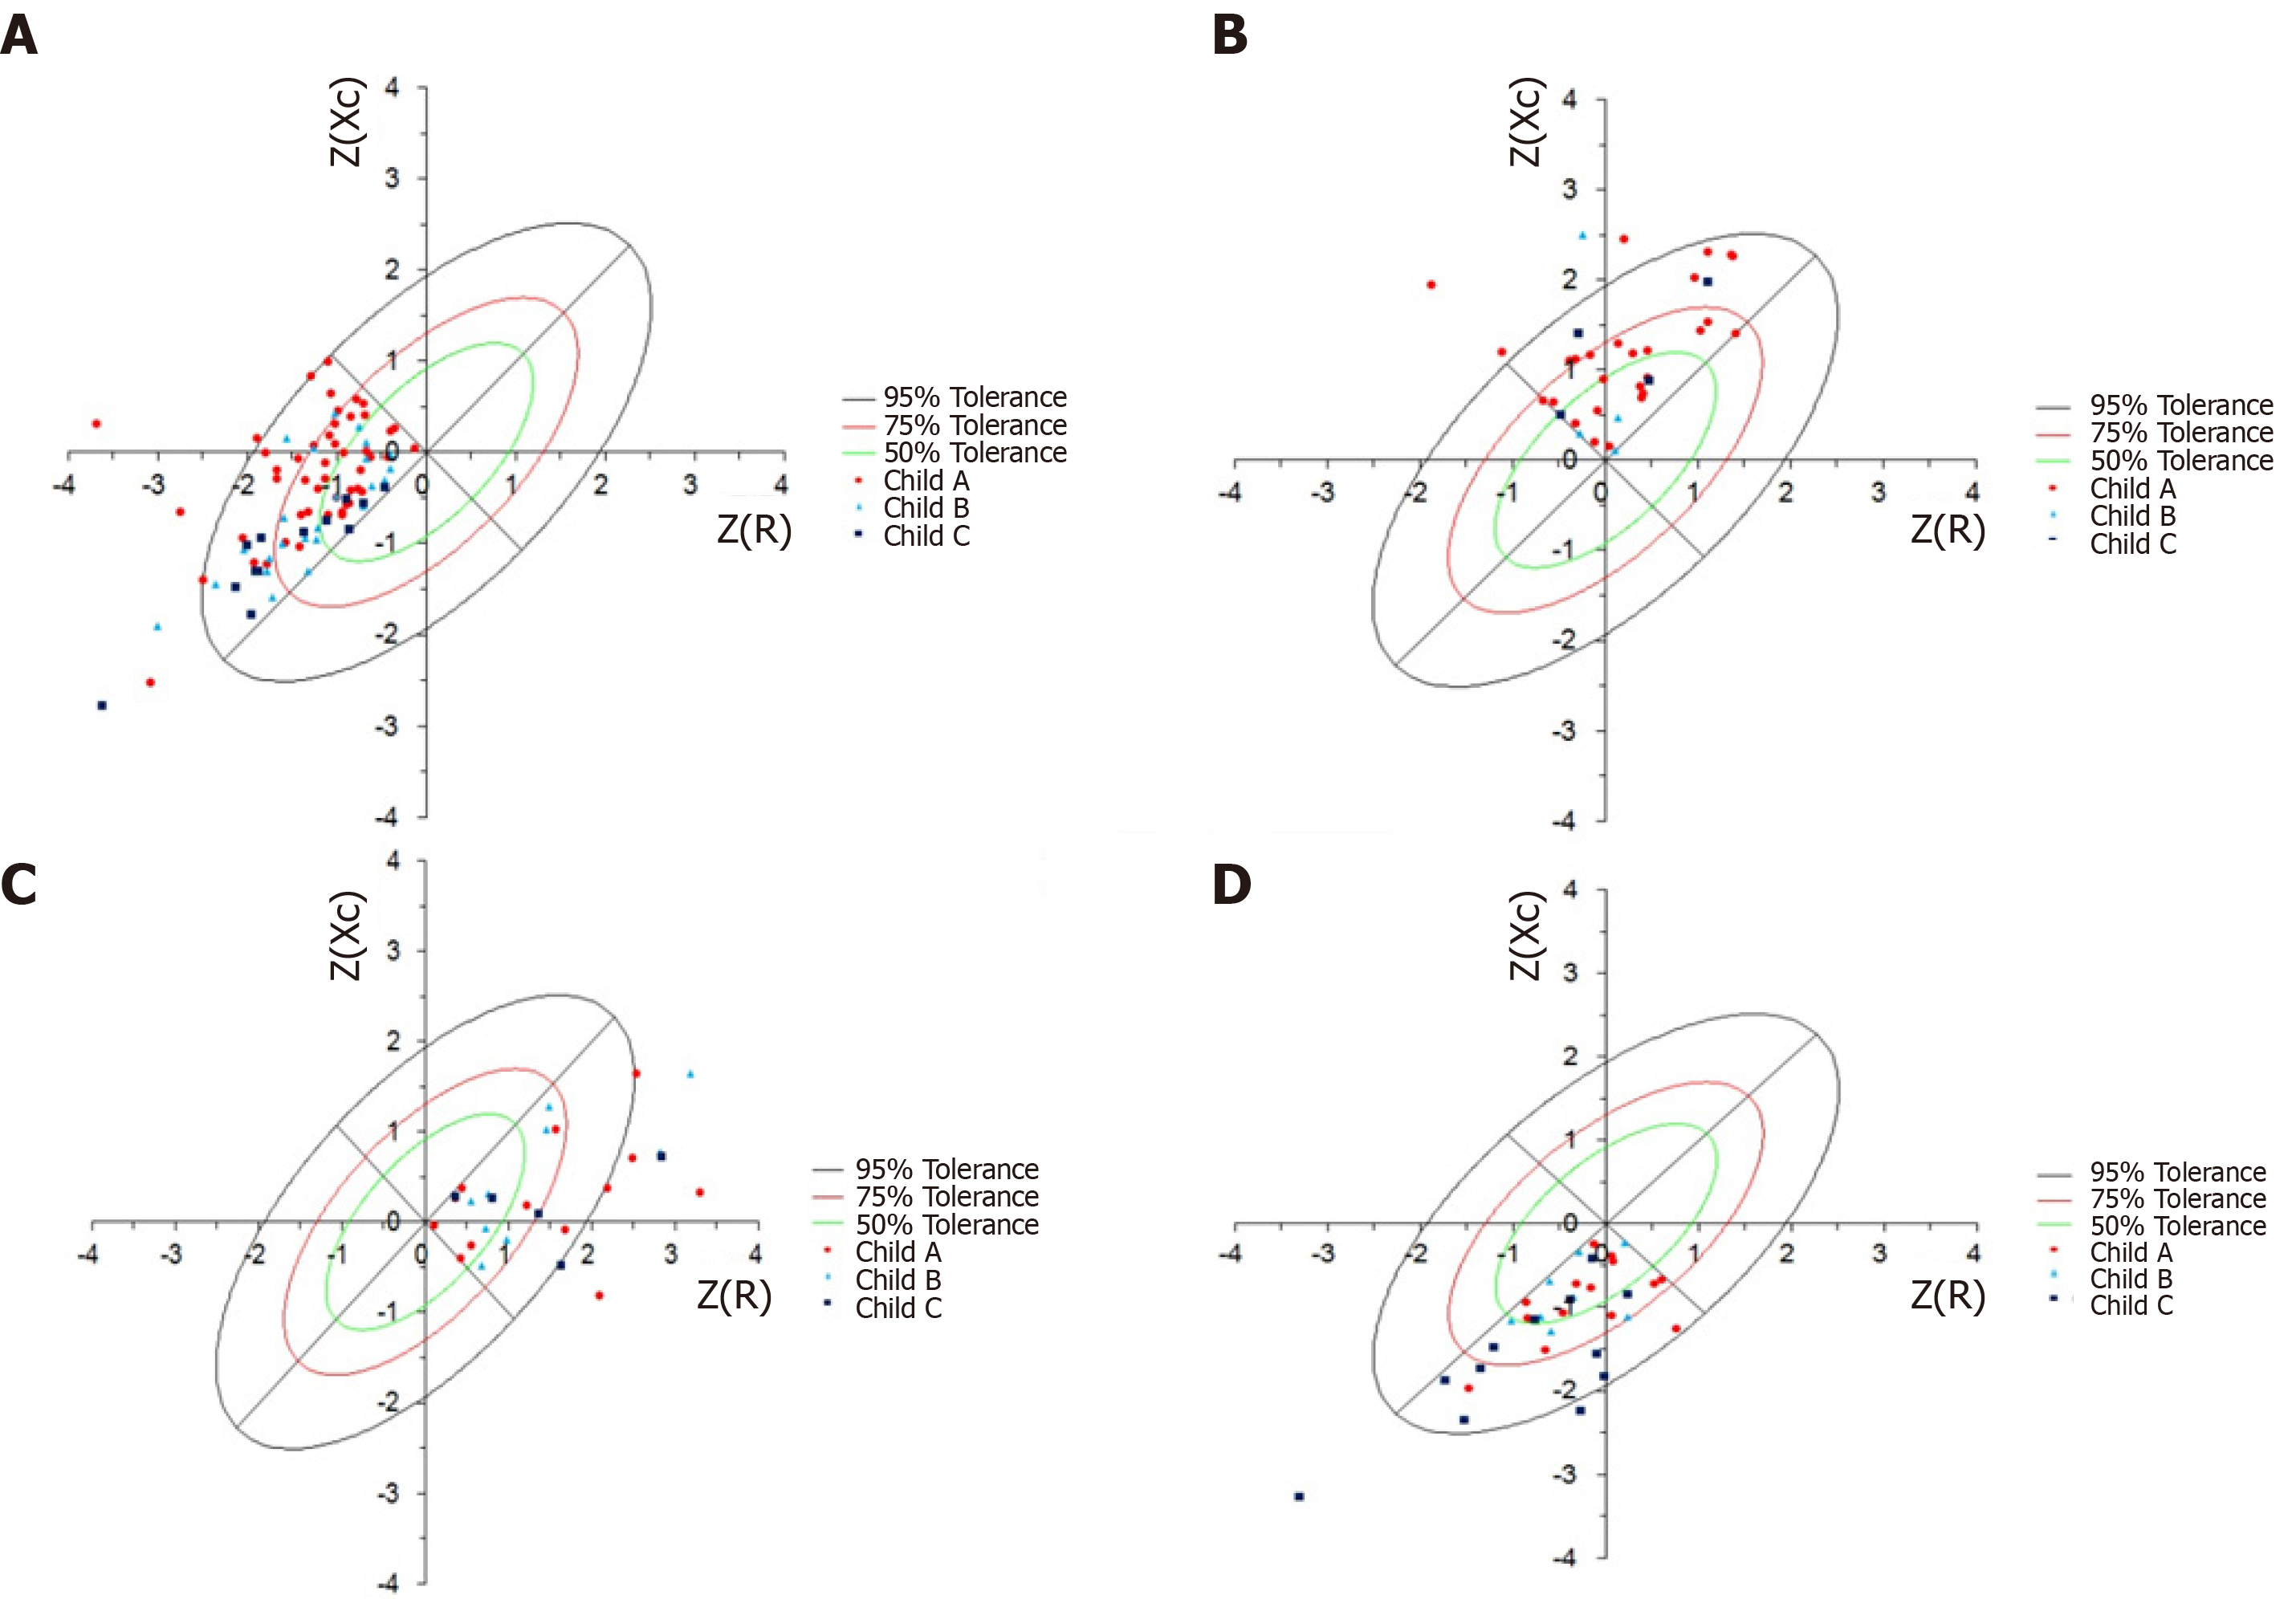
Figure 4 Classification of bioelectrical impedance vector analysis quadrants associated with Child-Turcotte-Pugh classification.
A: Bioelectrical impedance vector analysis (BIVA) - patients plotted in quadrant 1; B: BIVA - patients plotted in quadrant 2 - higher proportion of Child-Turcotte-Pugh A; C: BIVA - patients plotted in quadrant 3; D: BIVA - patients plotted in quadrant 4 - greater proportion of Child-Turcotte-Pugh C (P < 0.002). Z: Score; (R): Resistance; (Xc): Reactance.
- Citation: Fernandes SA, Leonhardt LR, da Silva DM, Alves FD, Marroni CA. Bioelectrical impedance vector analysis evaluates cellularity and hydration in cirrhotic patients. World J Hepatol 2020; 12(12): 1276-1288
- URL: https://www.wjgnet.com/1948-5182/full/v12/i12/1276.htm
- DOI: https://dx.doi.org/10.4254/wjh.v12.i12.1276


