Copyright
©The Author(s) 2020.
World J Hepatol. Nov 27, 2020; 12(11): 1055-1066
Published online Nov 27, 2020. doi: 10.4254/wjh.v12.i11.1055
Published online Nov 27, 2020. doi: 10.4254/wjh.v12.i11.1055
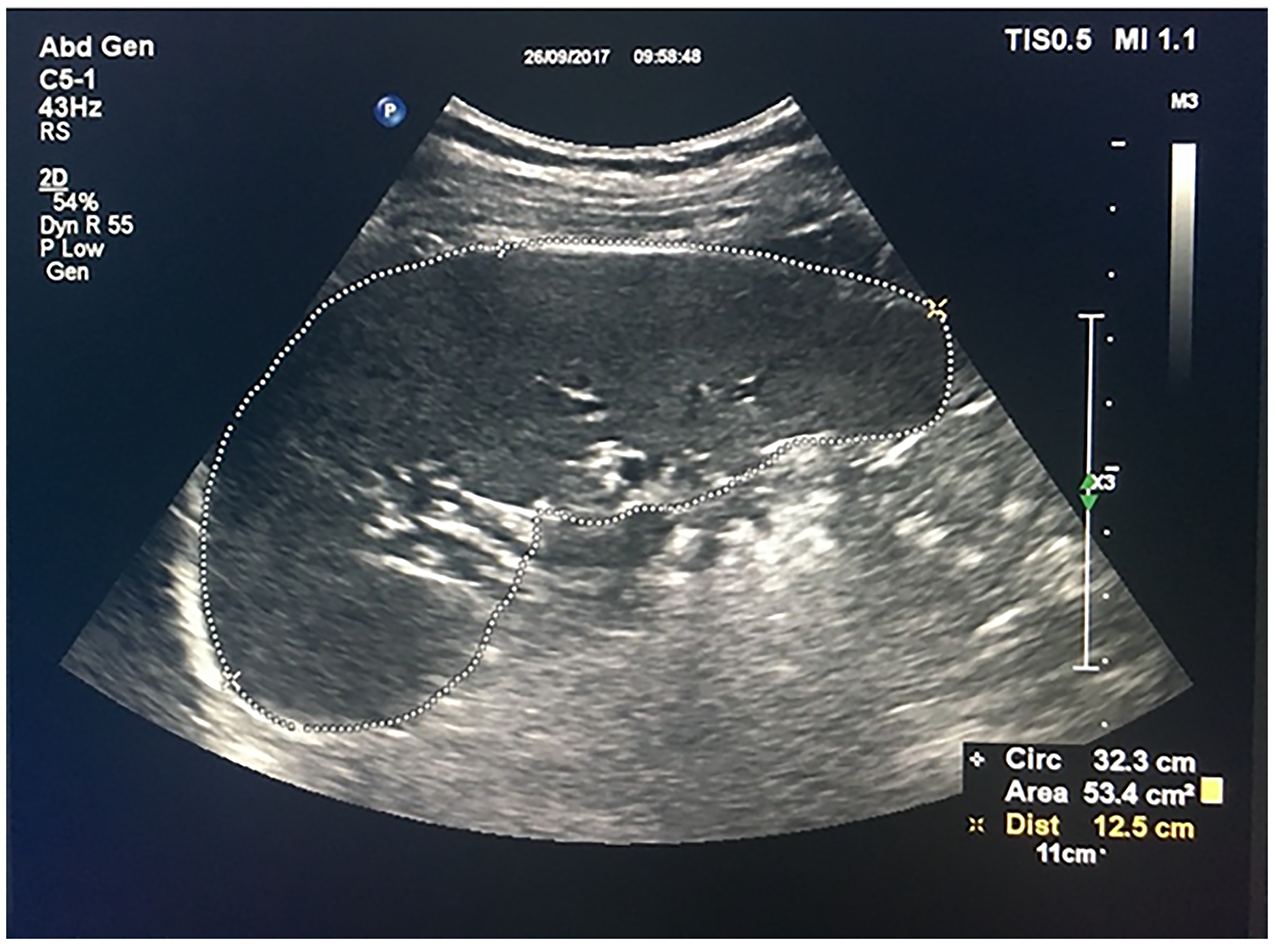
Figure 1 Spleen area and spleen diameter measurements using the elastography point quantification.
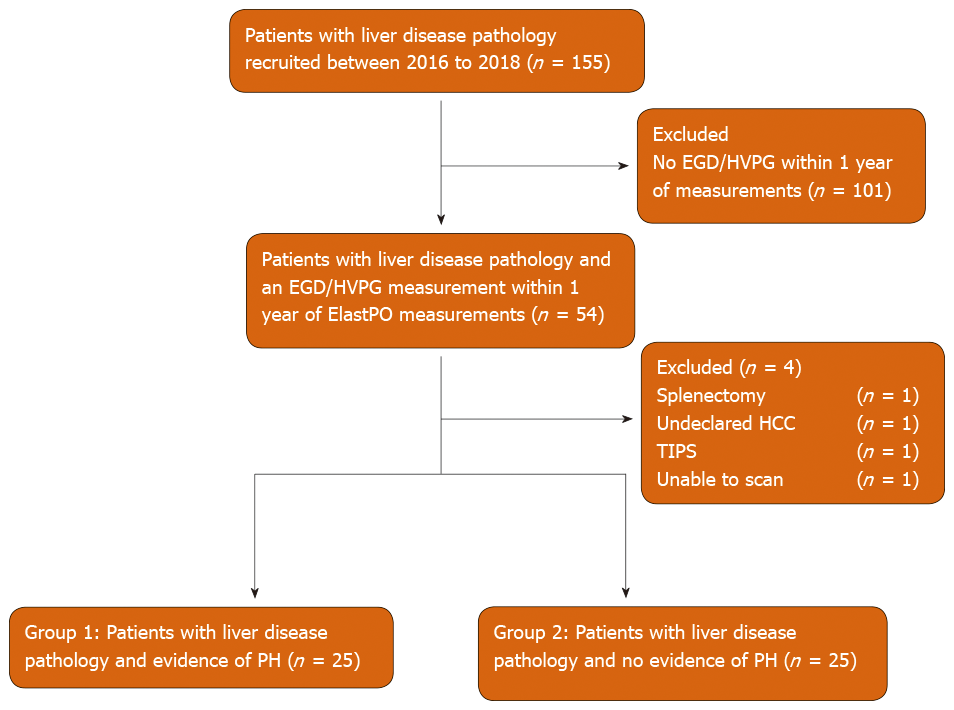
Figure 2 Flow chart displaying the selection of patients included in the final statistical analysis.
EGD: Esophago-gastroduodenoscopy; HVPG: Hepatic venous pressure gradient; ElastPQ: Elastography point quantification; HCC: Hepatocellular carcinoma; TIPS: Transjugular intrahepatic portosystemic shunt; PH: Portal hypertension.
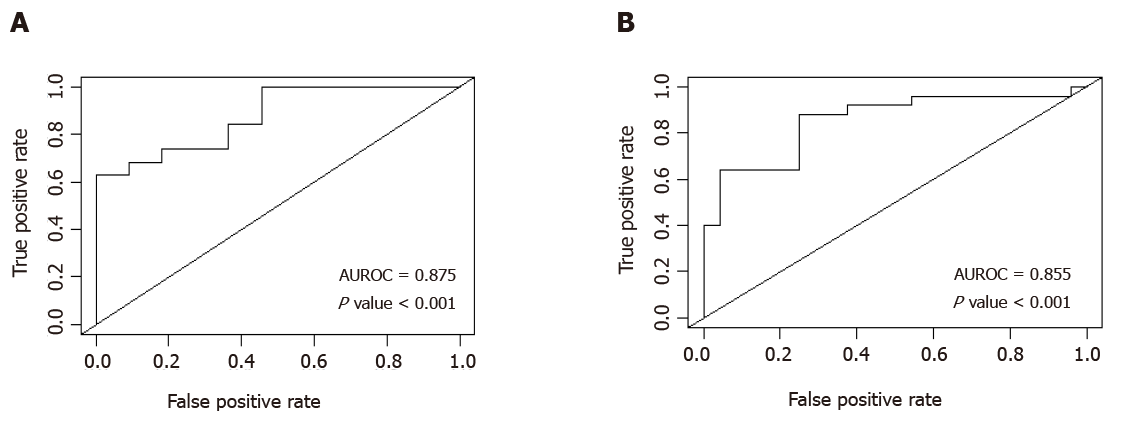
Figure 3 Comparative area under the receiver operating characteristic curve analyses of combination variables in predicting the presence or absence of clinically significant portal hypertension.
A: Spleen area (> 57.90 kPa) and platelet count (< 126.0 × 10⁹); B: Spleen stiffness (> 29.99 kPa) and platelet count (< 126.0 × 10⁹). AUROC: Area under the receiver operating characteristic.
- Citation: Ahmad AK, Atzori S, Maurice J, Taylor-Robinson SD, Lim AKP. Non-invasive splenic parameters of portal hypertension: Assessment and utility. World J Hepatol 2020; 12(11): 1055-1066
- URL: https://www.wjgnet.com/1948-5182/full/v12/i11/1055.htm
- DOI: https://dx.doi.org/10.4254/wjh.v12.i11.1055


