


Copyright
©The Author(s) 2020.
World J Hepatol. Jan 27, 2020; 12(1): 21-33
Published online Jan 27, 2020. doi: 10.4254/wjh.v12.i1.21
Published online Jan 27, 2020. doi: 10.4254/wjh.v12.i1.21

Figure 1 Hepatic angiography - arterial phase - and levels of superselection for administration of the chemoembolic agent.
Superelelectivity levels for administration of the chemoembolic agent. 1: Proximal embolization: right/left hepatic artery trunk; 2: Segmental: right/left hepatic artery segmental branch; 3: Subsegmental branch of the right/left hepatic artery.

Figure 2 Representation of feeding vessels and hypervascularization of hepatocellular carcinoma in hepatic angiography.
A: Hepatic angiography - arterial phase - showing, in solid line, projection two feeding vessels responsible for the formation of hepatocellular carcinoma who received chemoembolic agent dose; B: Hepatic angiography - arterial phase - showing the presence of a circular area in the projection of hepatocellular carcinoma with contrast medium concentration in relation to the adjacent area, being characterized as a hypervascular hepatocellular carcinoma.

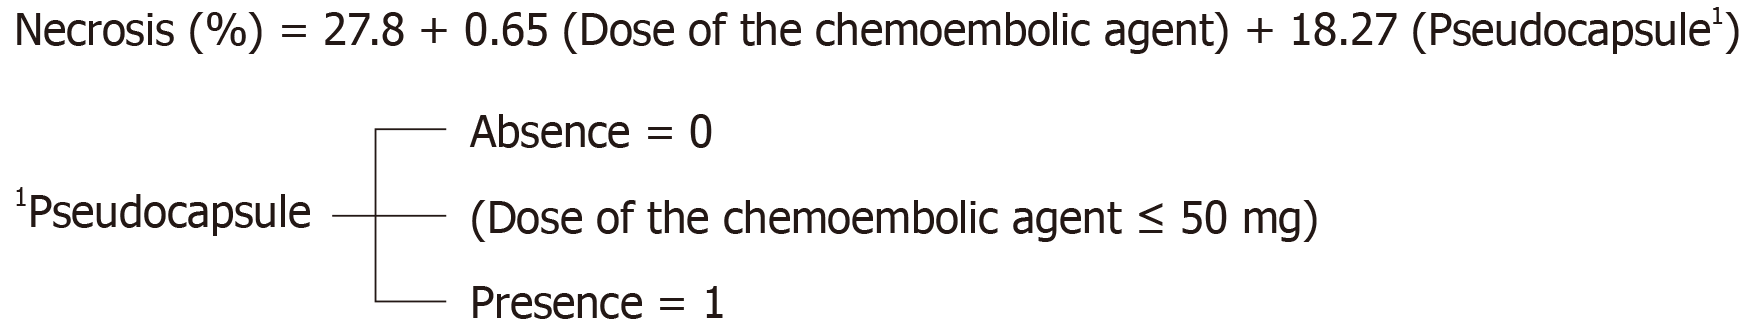
Figure 3 Calculation method for individualization of the dose of the chemoembolic agent received by treated hepatocellular carcinoma in situations of impossibility of the superselective catheterism.
A: Magnetic resonance imaging pre-chemoembolization abdomen - post-contrast T1 weighted phase - showing three confluent hypervascular lesions; B: Selective hepatic arteriography in segment VI of the right hepatic artery showing hypervascular lesions characteristic of hepatocellular carcinoma; C: Intraoperative cone beam tomography with selective arterial contrast in segment VI - venous phase - showing three confluent lesions with contrast medium lavage; D: Diameter of hepatocellular carcinomas located in segment VI to be treated; E: Exemplification of the calculation of dose individualization of the chemoembolic agent administered; F: Equation of individualized chemoembolic dose. MRI: Magnetic resonance imaging.

Figure 4 Flowchart of the patients included in the study.
HCC: Hepatocellular carcinoma; CT: Computed tomography; MRI: Magnetic resonance imaging; DEB-TACE: Drug-eluting bead transarterial chemoembolization.

Figure 5 Receiver operating characteristics curve of prediction of hepatocellular carcinoma objective response.
- Citation: Galastri FL, Nasser F, Affonso BB, Valle LGM, Odísio BC, Motta-Leal Filho JM, Salvalaggio PR, Garcia RG, de Almeida MD, Baroni RH, Wolosker N. Imaging response predictors following drug eluting beads chemoembolization in the neoadjuvant liver transplant treatment of hepatocellular carcinoma. World J Hepatol 2020; 12(1): 21-33
- URL: https://www.wjgnet.com/1948-5182/full/v12/i1/21.htm
- DOI: https://dx.doi.org/10.4254/wjh.v12.i1.21