Copyright
©The Author(s) 2019.
World J Hepatol. Mar 27, 2019; 11(3): 273-286
Published online Mar 27, 2019. doi: 10.4254/wjh.v11.i3.273
Published online Mar 27, 2019. doi: 10.4254/wjh.v11.i3.273
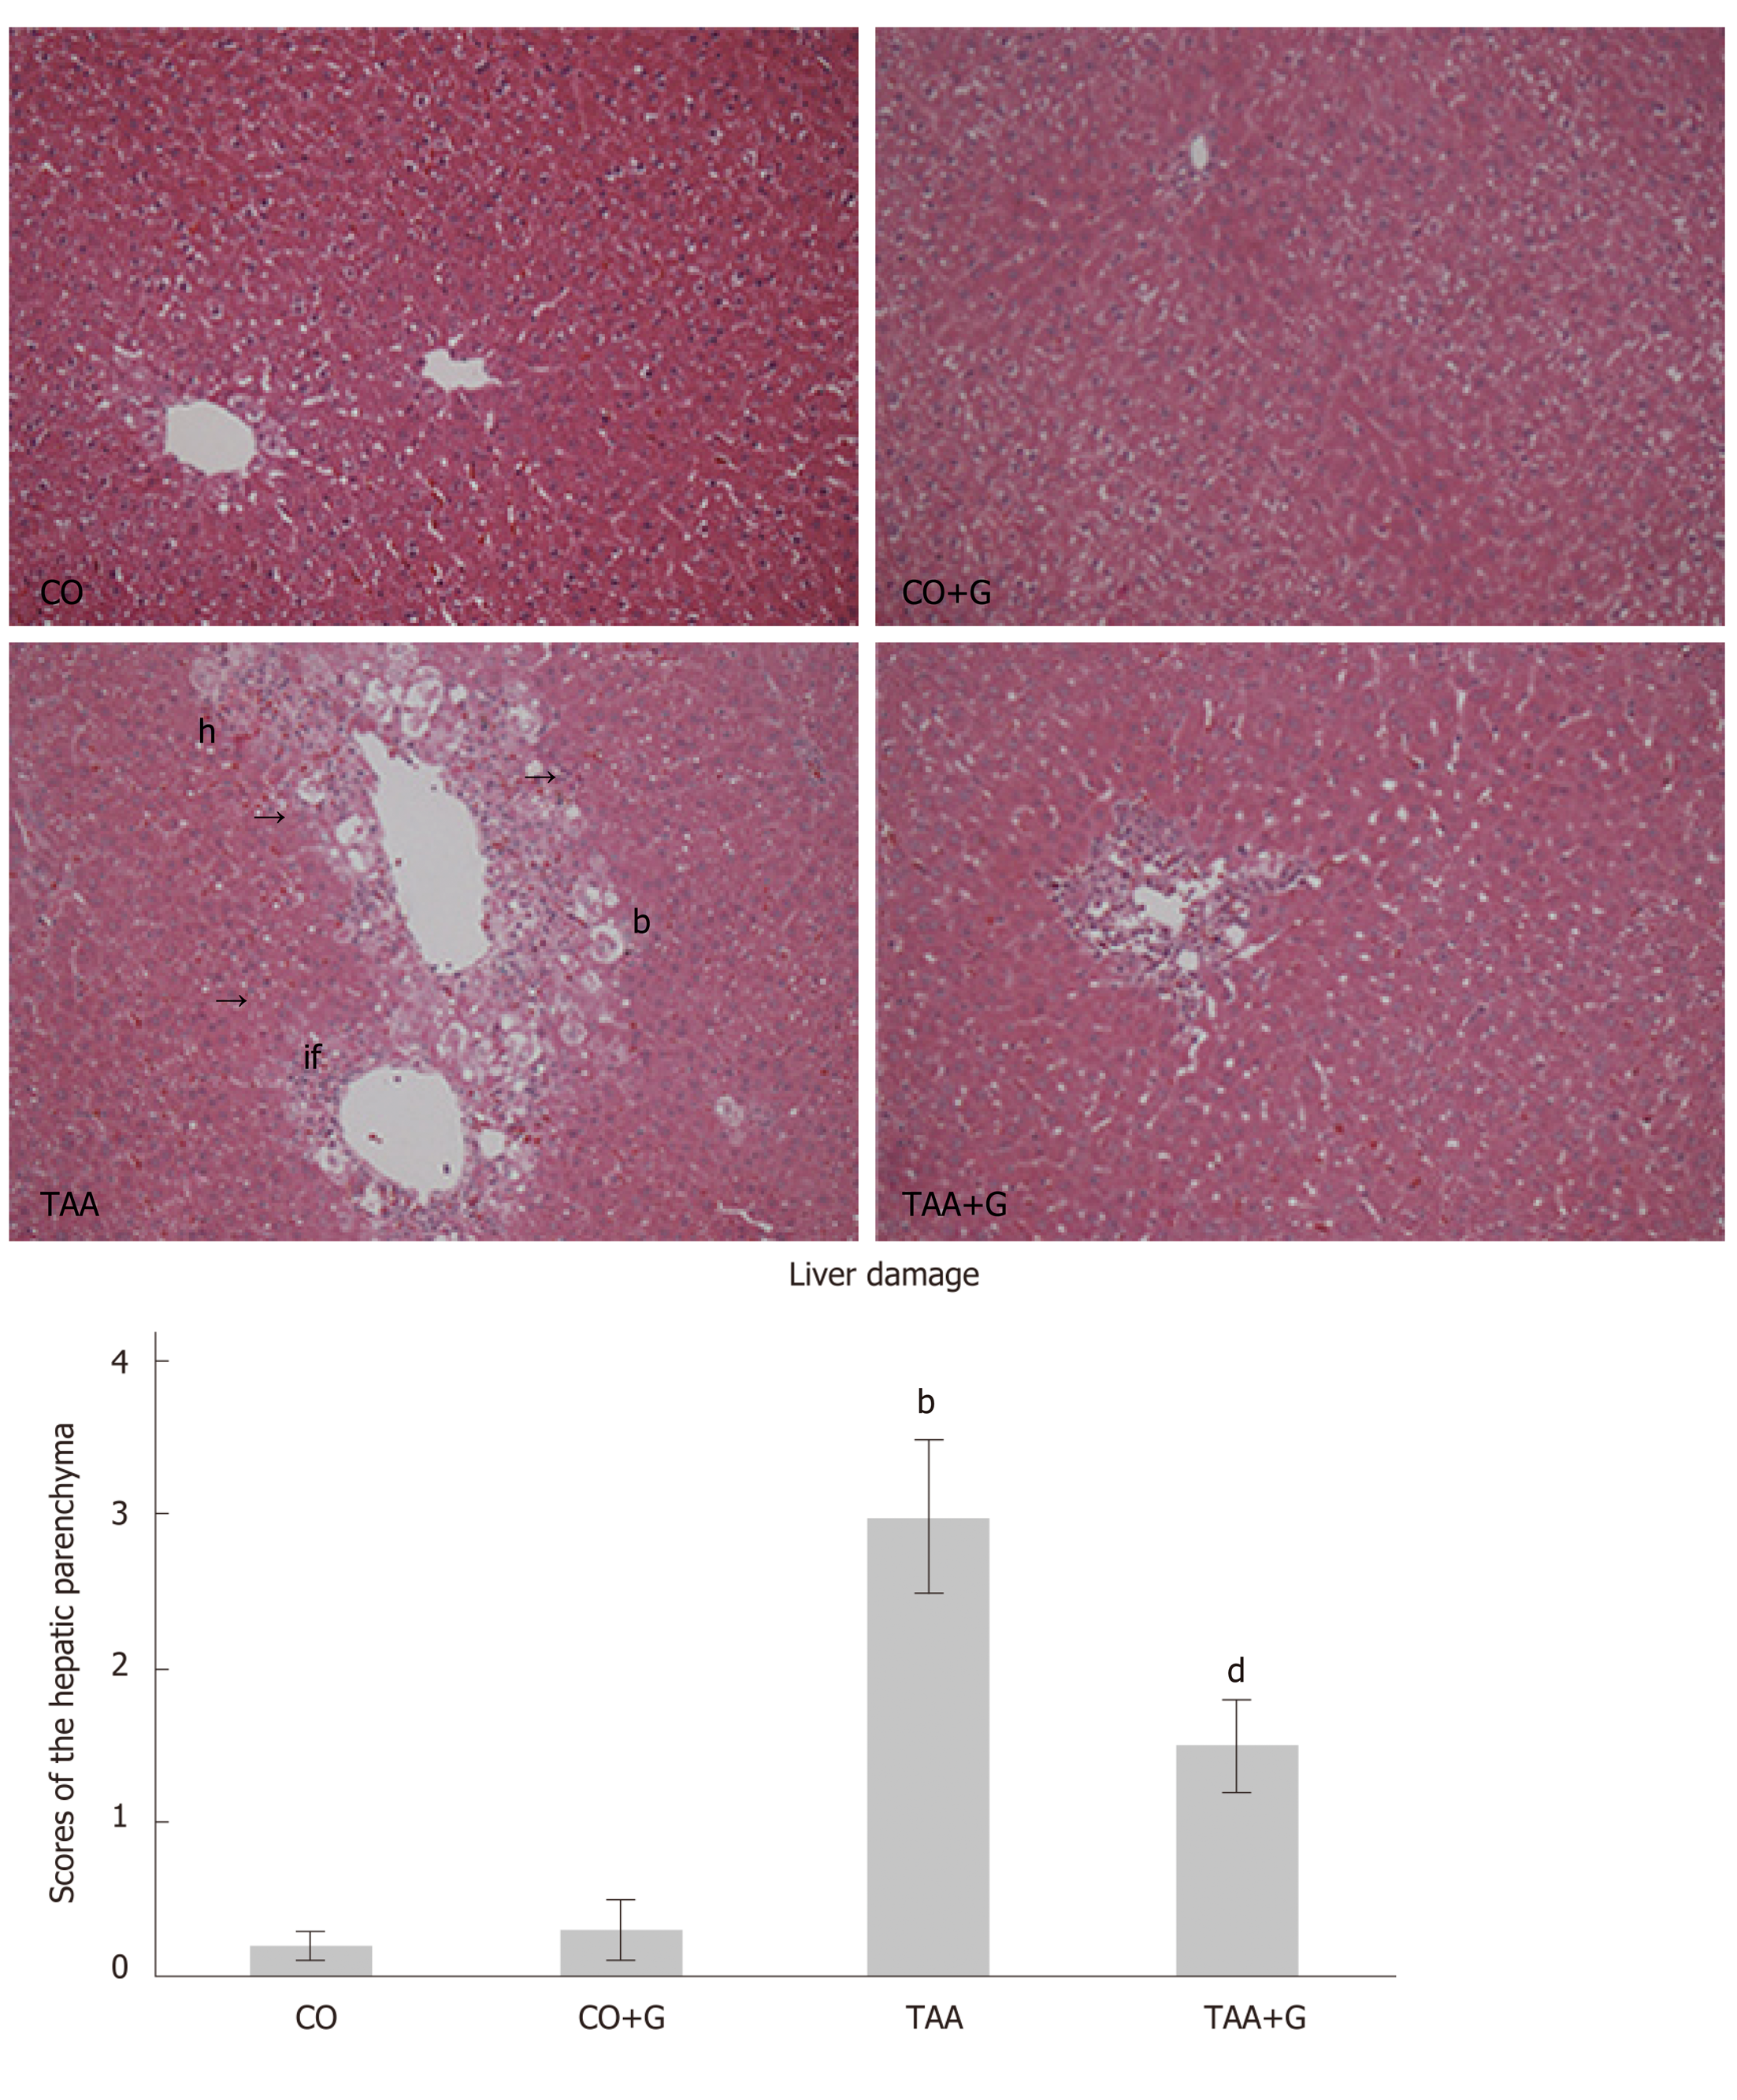
Figure 1 Effect of glutamine on liver injury in animals exposed to an experimental model of severe acute liver failure.
Representative photomicrographs; original magnification, 200 ×. Hematoxylin and eosin (HE) stain. In the Thioacetamide (TAA) group, there is visible disruption of the hepatic parenchymal architecture, with inflammatory infiltration, hemorrhage, ballooning, and massive necrosis. The glutamine-treated group (TAA + G) exhibits a reduction of these parameters and restructuring of the hepatic parenchyma. There were no visible tissue changes in the CO and CO + G groups. CO: Control; G: Glutamine; TAA: Thioacetamide. If: Inflammatory infiltrate; h: Hemorrhage; b: Ballooning; n: Necrosis. Values expressed as mean ± SE. bP < 0.001, TAA group vs groups CO and CO + G; dP < 0.01, TAA + G group vs the TAA group.
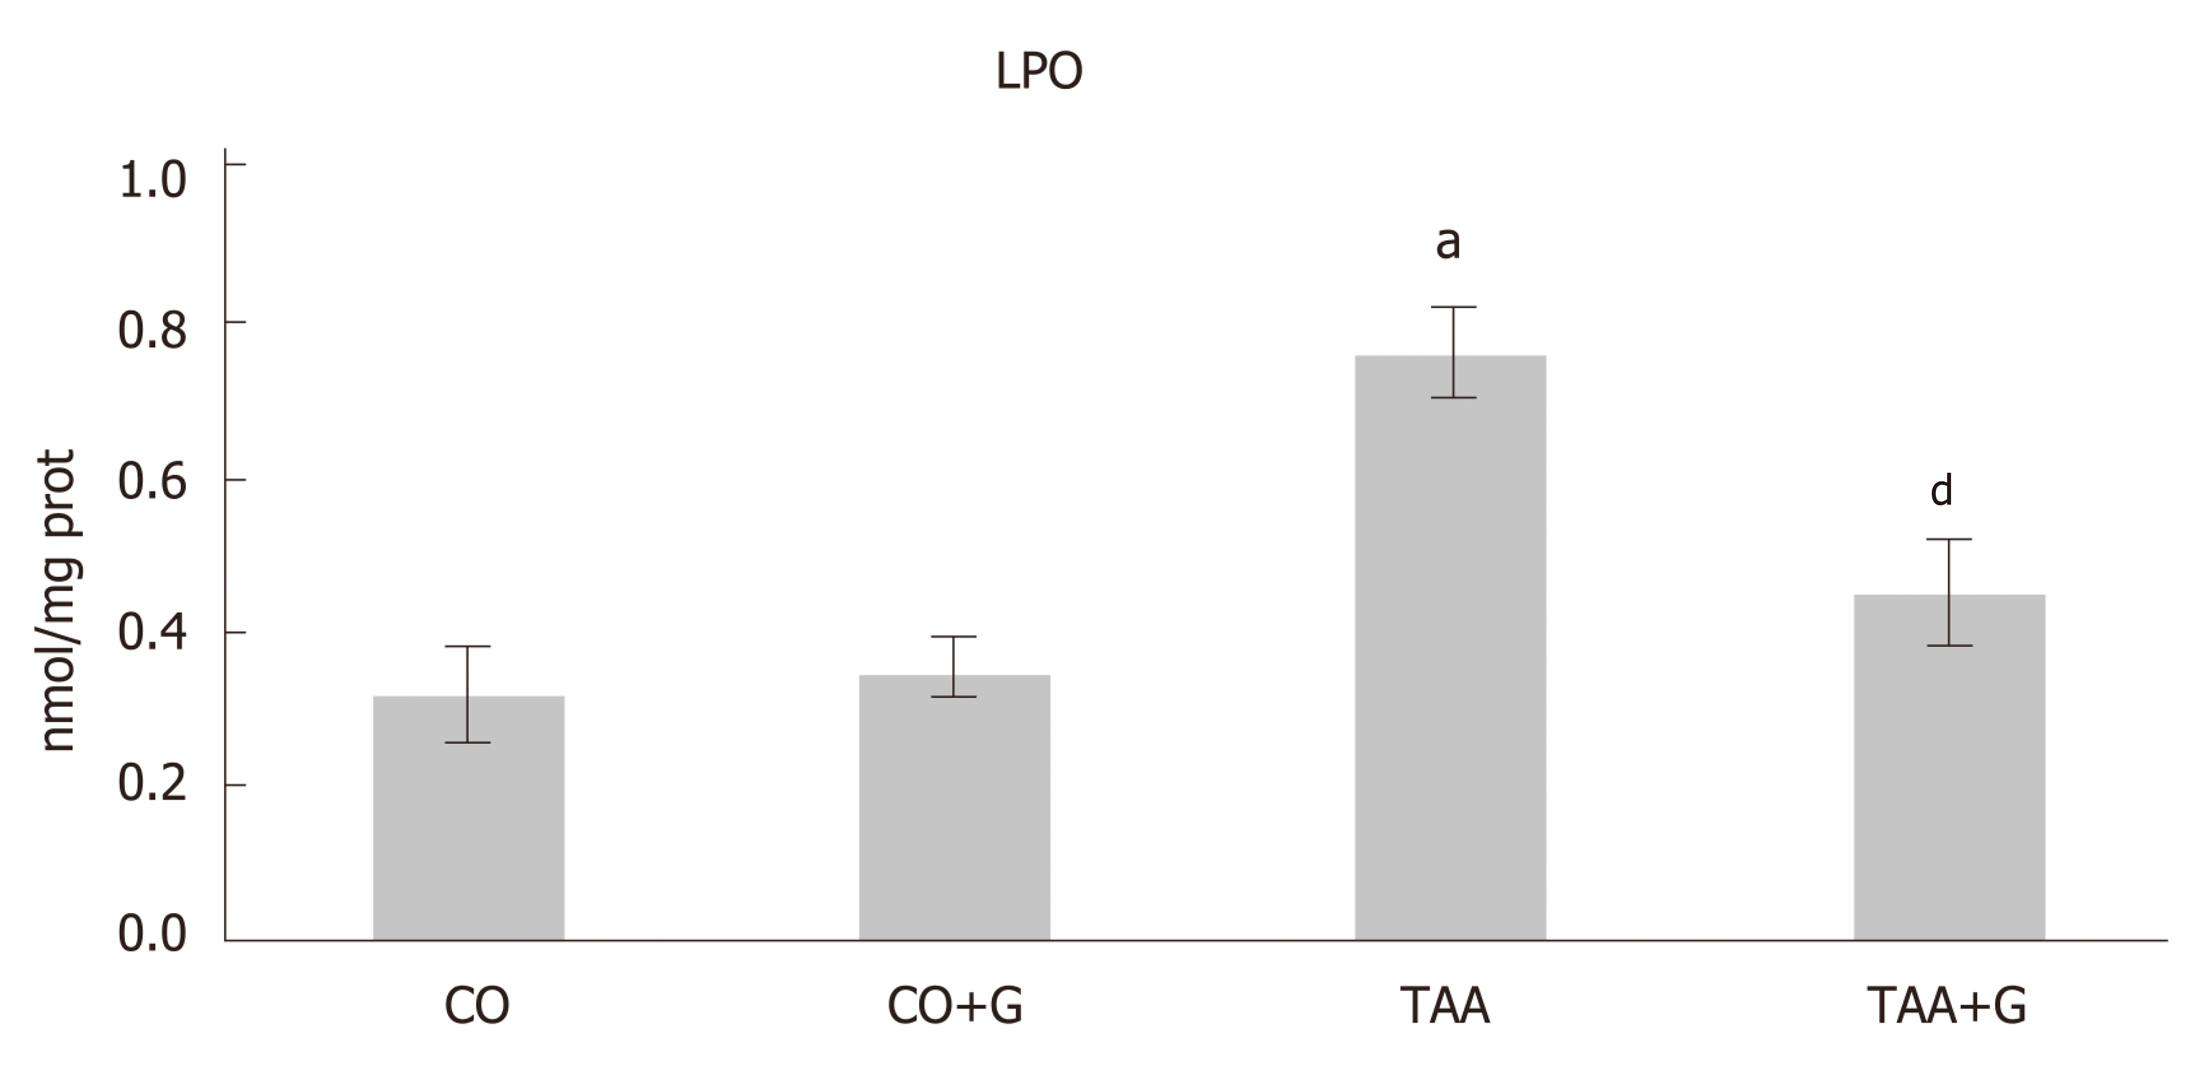
Figure 2 Assessment of lipid peroxidation in the liver of rats with severe acute liver failure.
Values expressed as mean ± standard error. aP < 0.05 TAA group vs groups CO and CO + G; dP < 0.01 TAA + G group vs the TAA group. CO: Control; G: Glutamine; TAA: Thioacetamide.
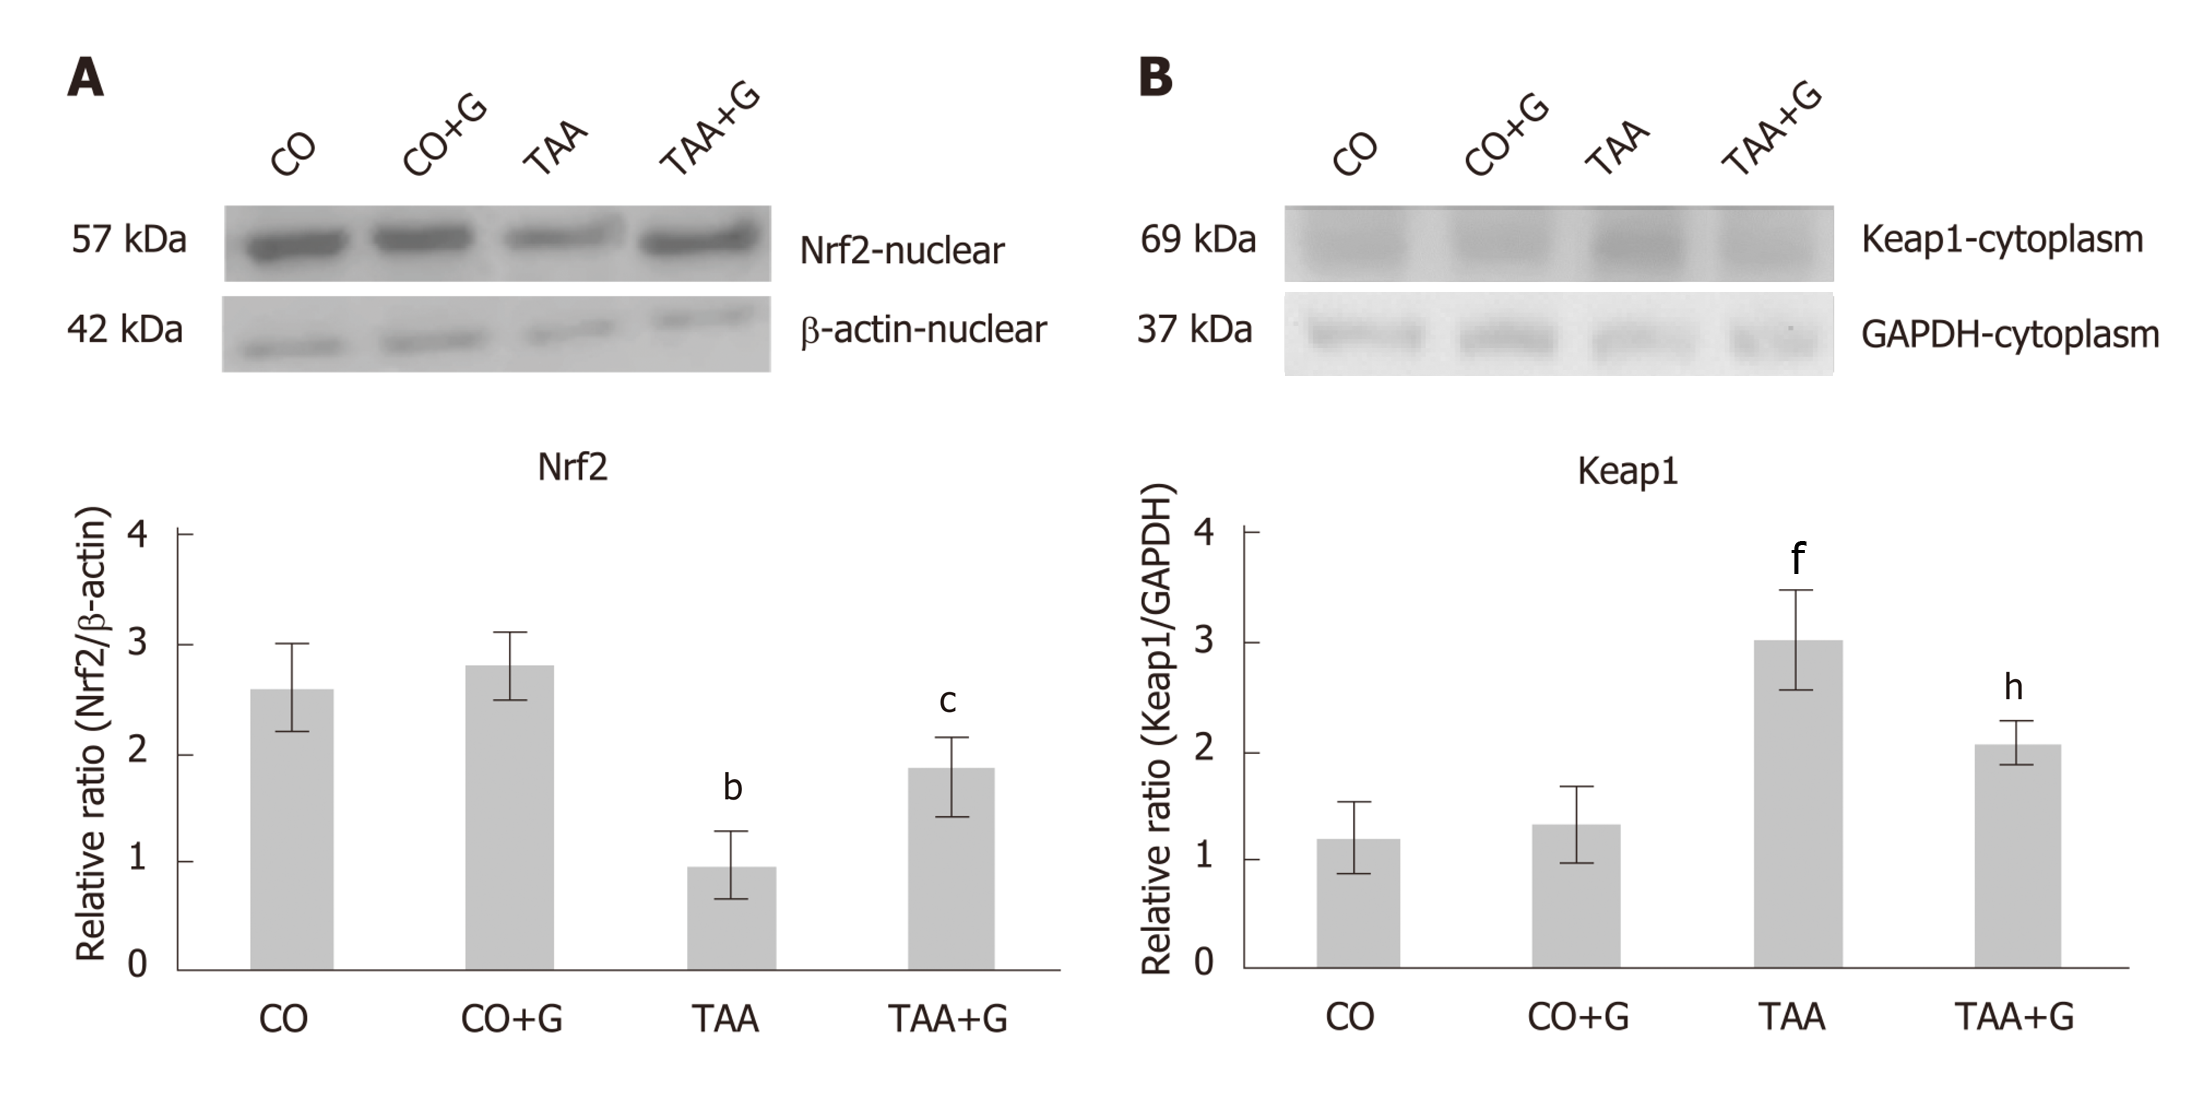
Figure 3 Effect of glutamine in experimental severe acute liver failure.
Western blot analysis of protein expression of (A) Nrf2 and (B) Keap1. Values expressed as mean ± standard error. bP < 0.01 TAA group vs groups CO and CO + G; cP < 0.05 TAA + G group vs the TAA group; fP < 0.001 TAA group vs groups CO and CO + G. hP< 0.01 TAA + G group vs the TAA group. CO: Control; G: Glutamine; TAA: Thioacetamide.
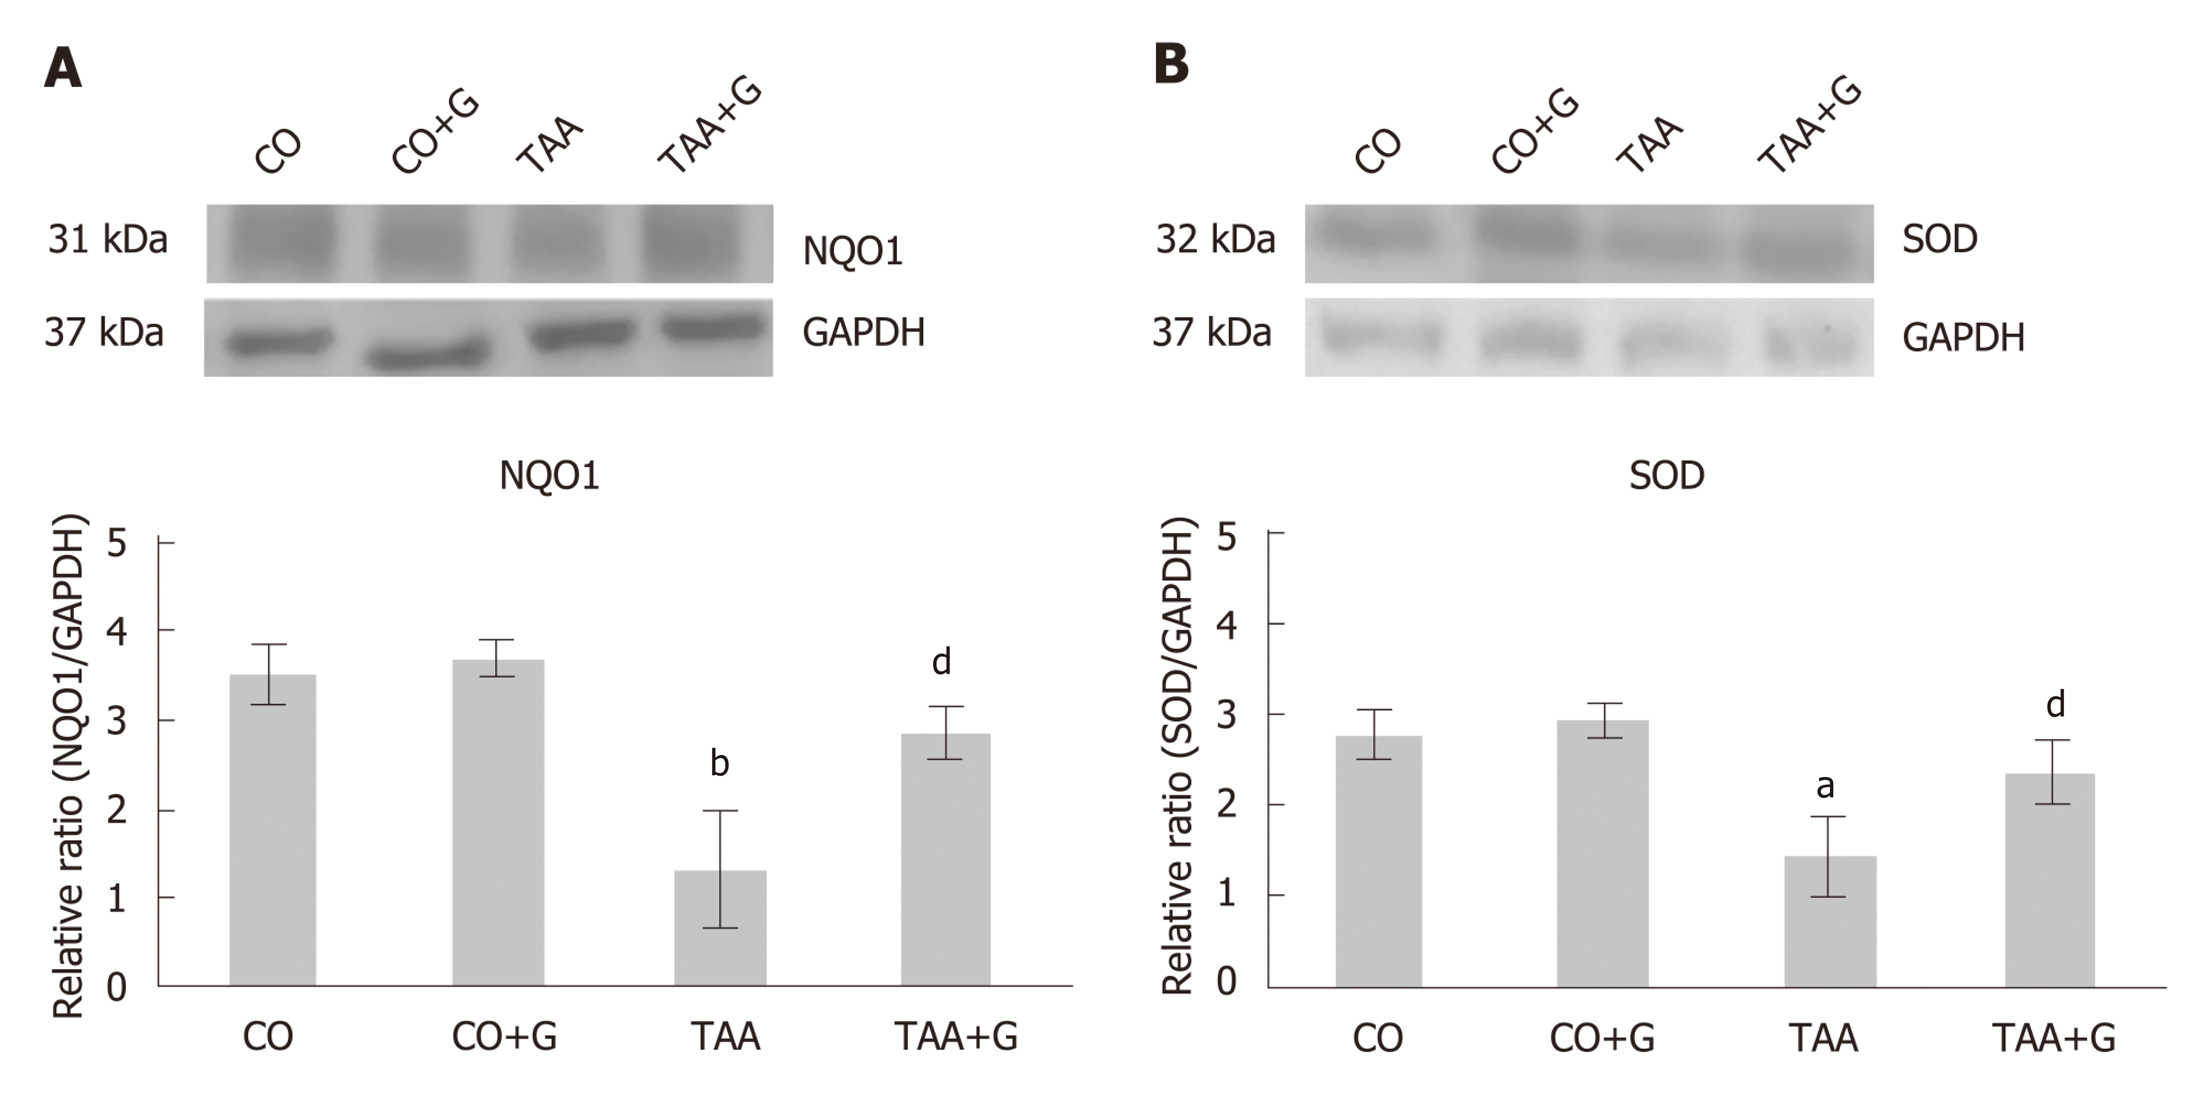
Figure 4 Effect of glutamine in experimental severe acute liver failure.
Western blot analysis of protein expression of (A) NQO1 and (B) SOD. Values expressed as mean ± SE. aP < 0.05 TAA group vs groups CO and CO + G. bP < 0.01 TAA group vs groups CO and CO + G; dP < 0.01 TAA + G group vs the TAA group. CO: Control; G: Glutamine; TAA: Thioacetamide.
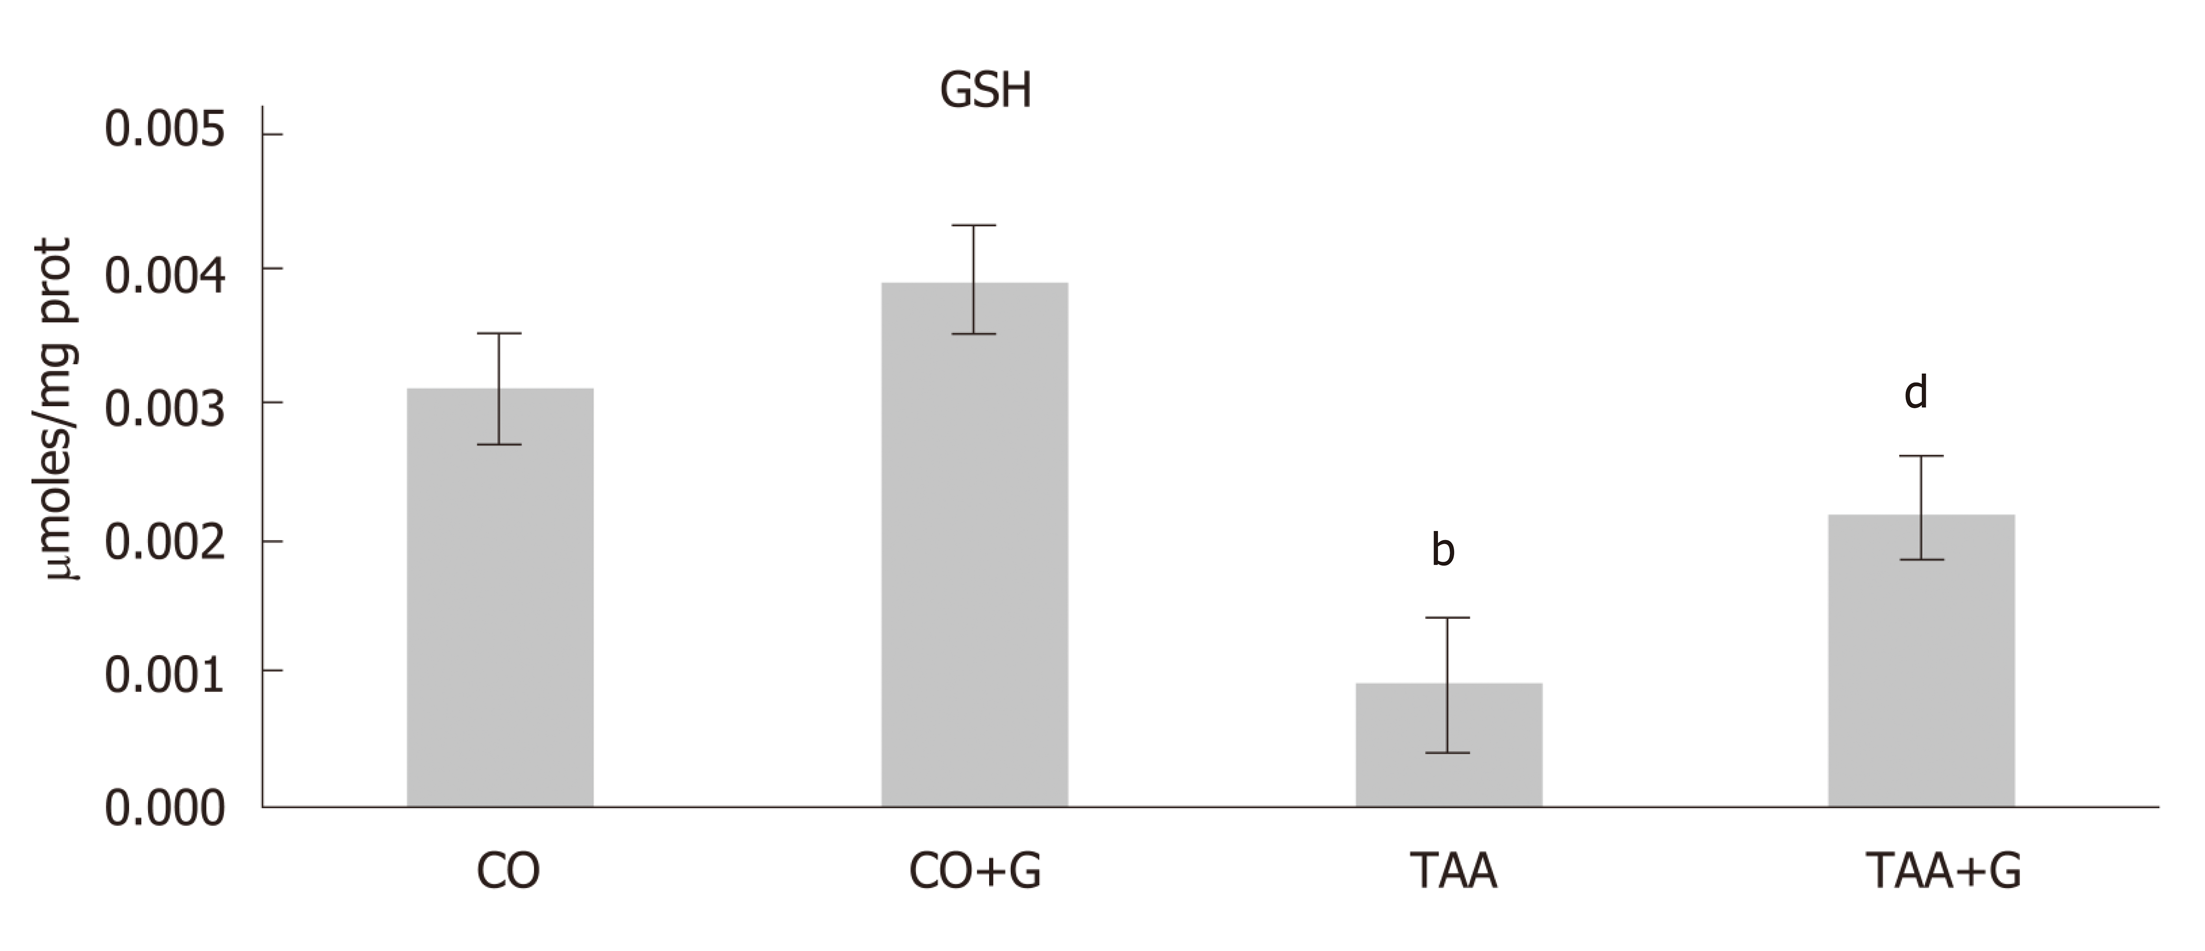
Figure 5 Assessment of glutathione (GSH) levels in the liver of rats treated with glutamine after induction of severe acute liver failure.
Values expressed as mean ± standard error. bP < 0.001 TAA group vs groups CO and CO + G; dP < 0.01 TAA + G group vs the TAA group. CO: Control; G: Glutamine; TAA: Thioacetamide.
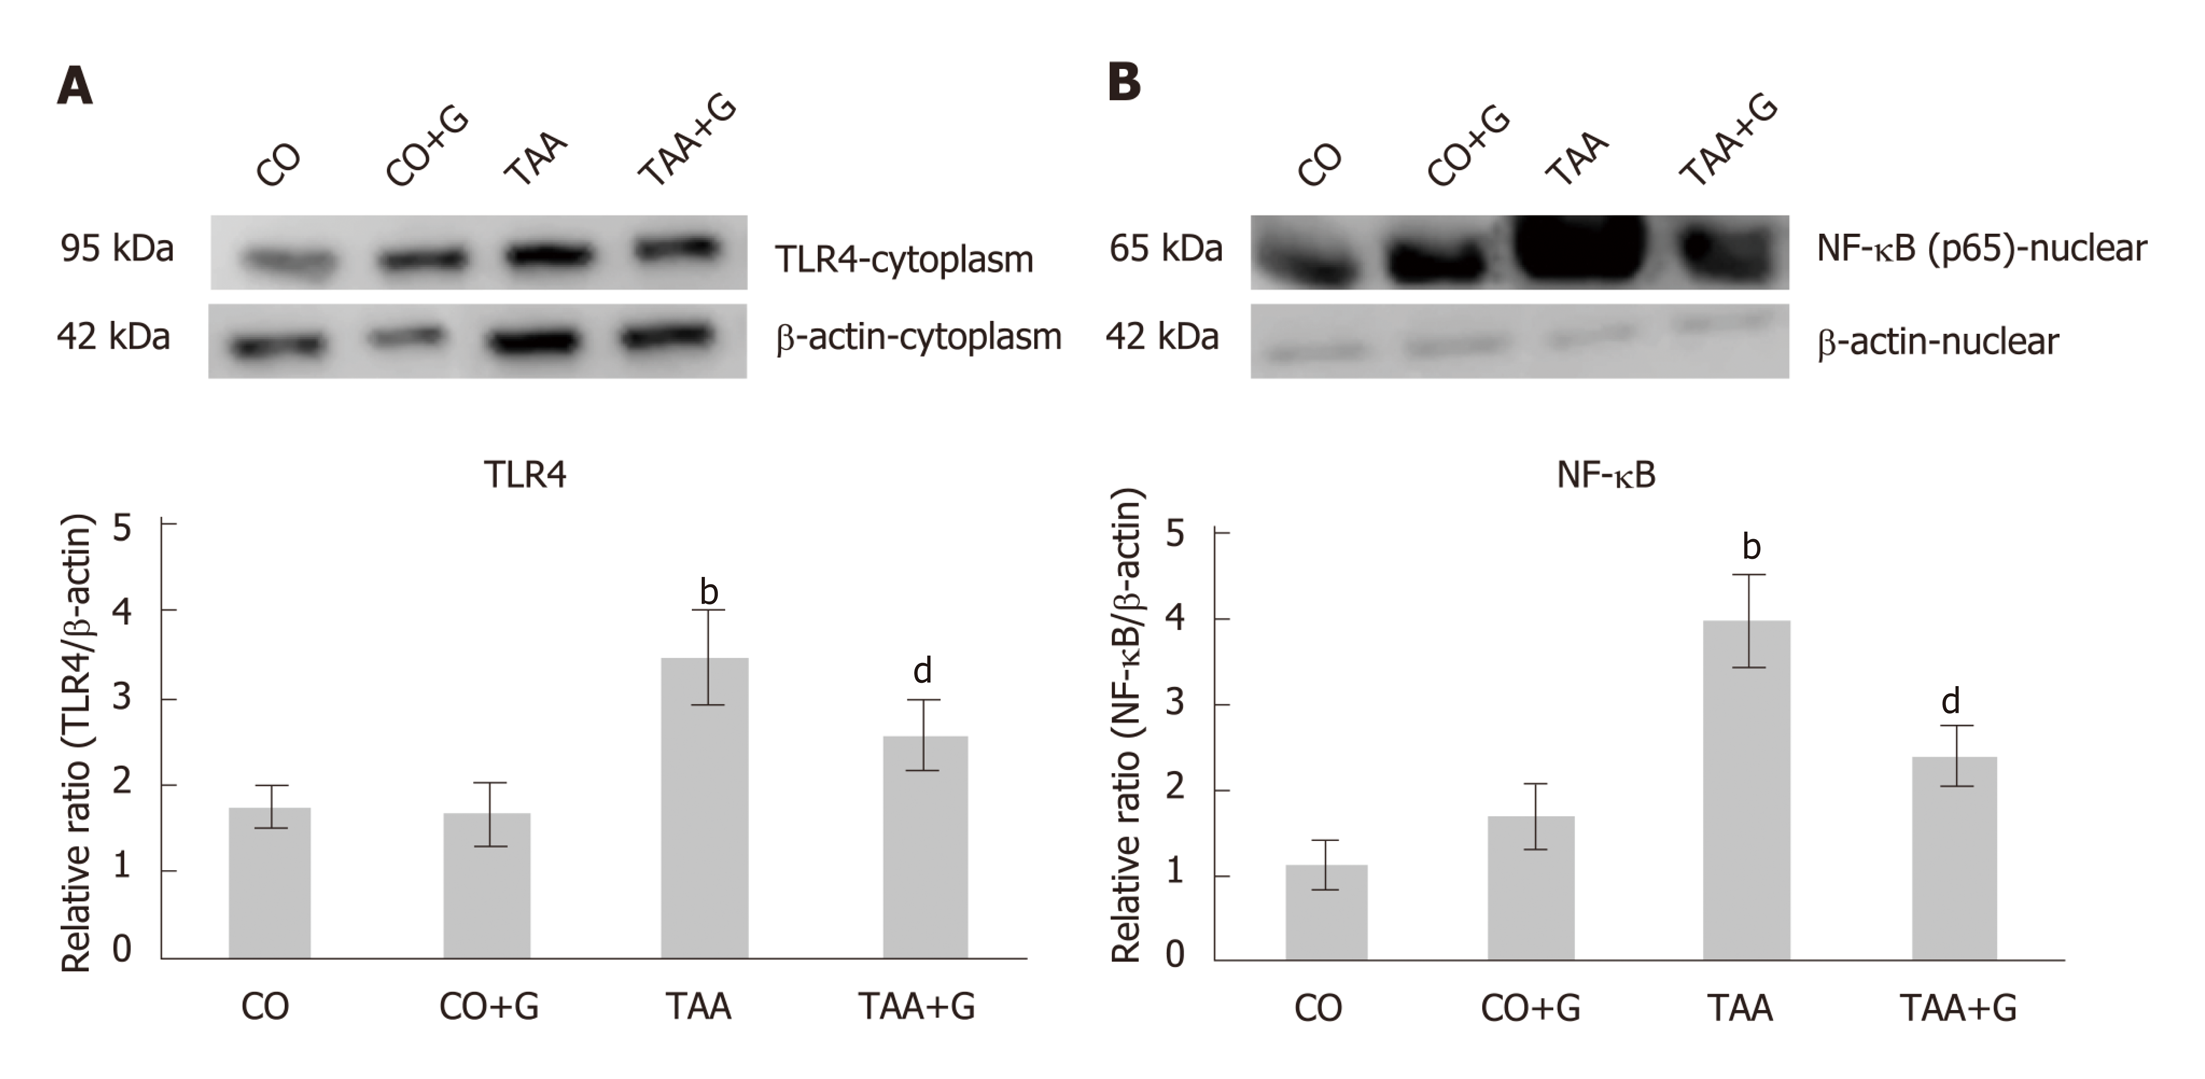
Figure 6 Effect of glutamine in experimental severe acute liver failure.
Western blot analysis of protein expression of (A) TLR4 and (B) NFκB. Values expressed as mean ± SE. bP < 0.001 TAA group vs groups CO and CO + G; dP < 0.001 TAA + G group vs the TAA group. CO: Control; G: Glutamine; TAA: Thioacetamide.
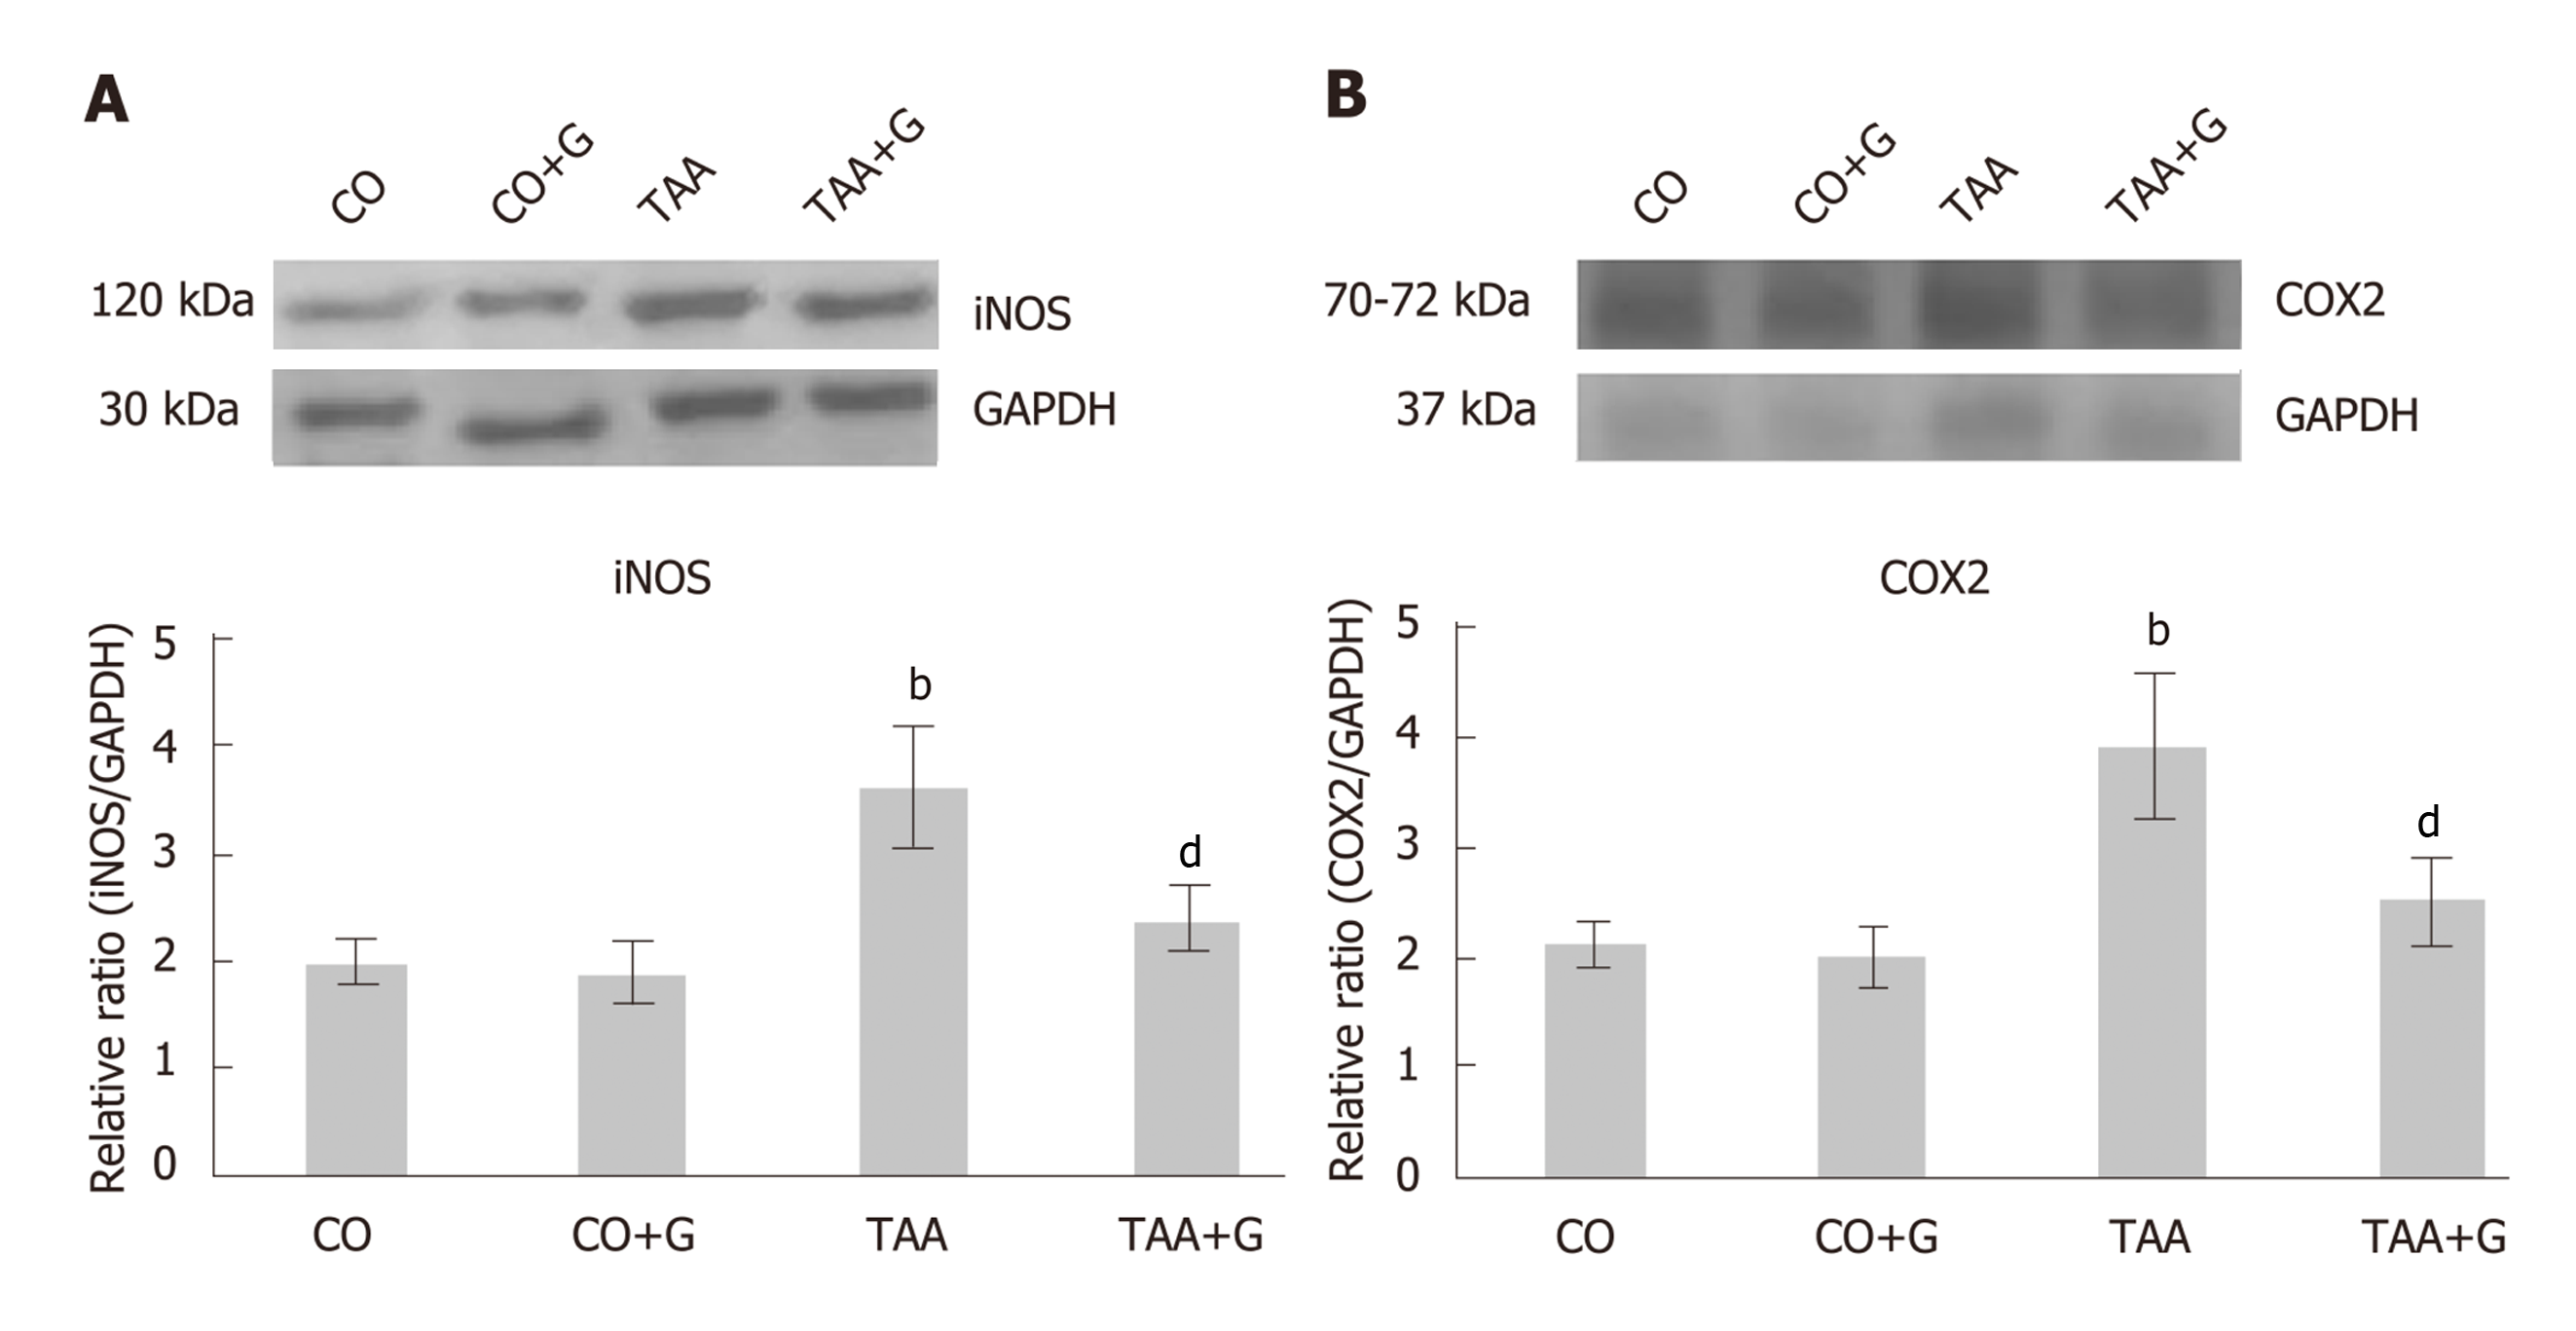
Figure 7 Effect of glutamine in experimental severe acute liver failure.
Western blot analysis of protein expression of A: iNOS and B: COX-2. Values expressed as mean ± SE. bP < 0.001 TAA group vs groups CO and CO + G; dP < 0.01 TAA + G group vs the TAA group. CO: Control; G: Glutamine; TAA: Thioacetamide.
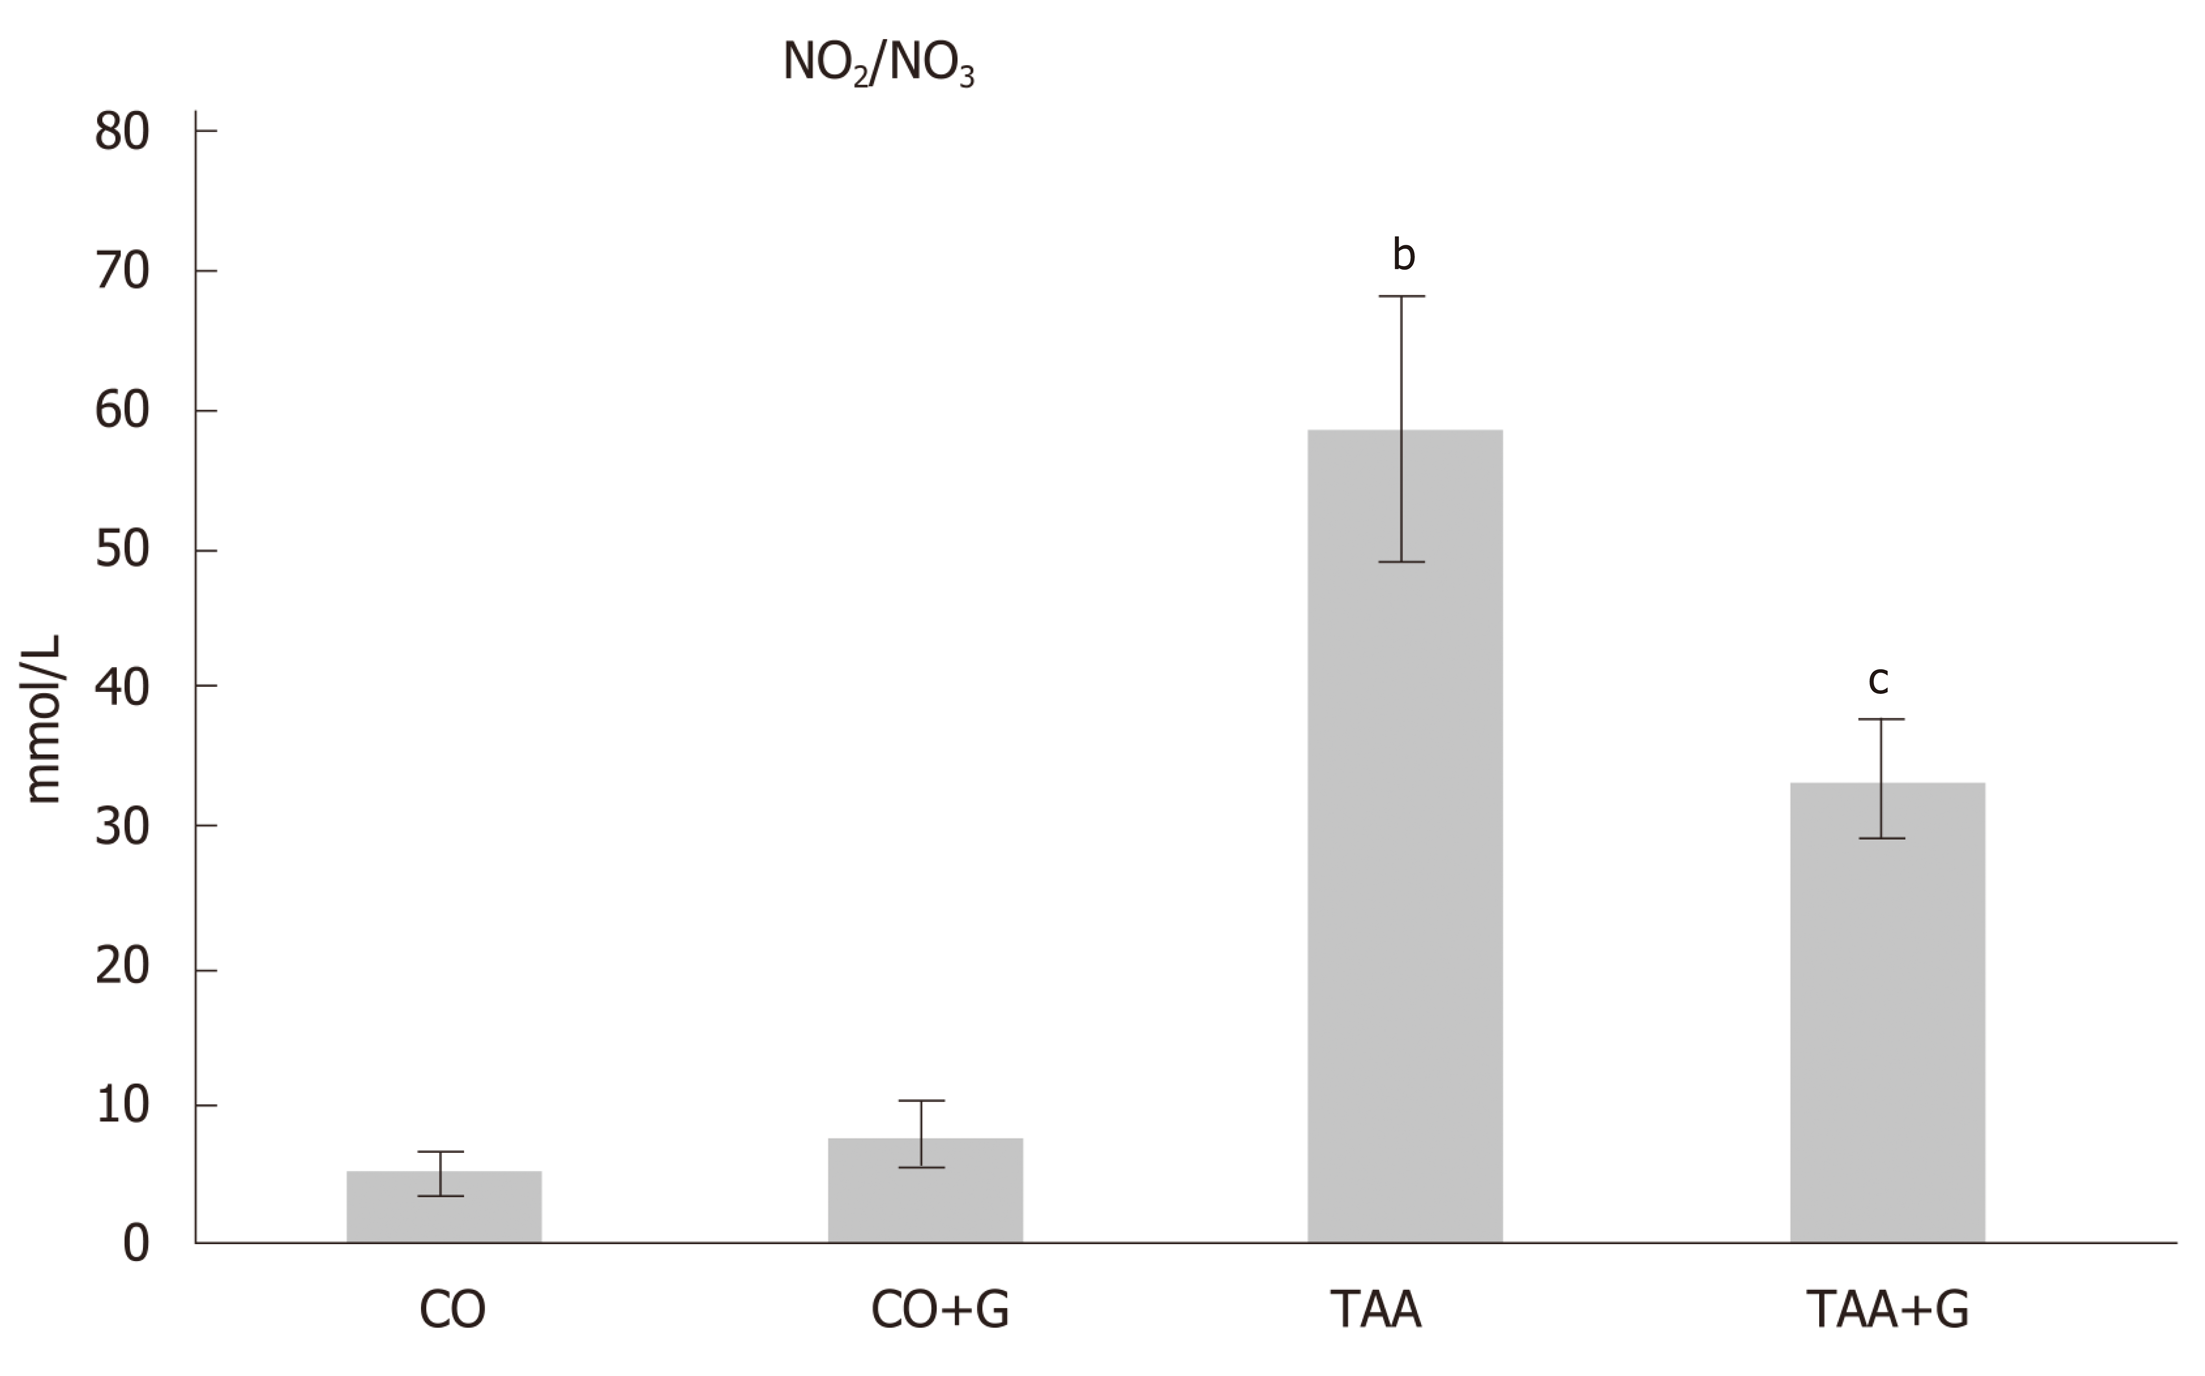
Figure 8 Effect of glutamine on levels of nitric oxide metabolites (nitrites and nitrates) in the liver of rats with severe acute liver failure.
Values expressed as mean ± SE. bP < 0.001, TAA group vs groups CO and CO + G; cP < 0.05, TAA + G group vs the TAA group. CO: Control; G: Glutamine; TAA: Thioacetamide.
- Citation: Schemitt EG, Hartmann RM, Colares JR, Licks F, Salvi JO, Marroni CA, Marroni NP. Protective action of glutamine in rats with severe acute liver failure. World J Hepatol 2019; 11(3): 273-286
- URL: https://www.wjgnet.com/1948-5182/full/v11/i3/273.htm
- DOI: https://dx.doi.org/10.4254/wjh.v11.i3.273


