Copyright
©The Author(s) 2019.
World J Hepatol. Jan 27, 2019; 11(1): 119-126
Published online Jan 27, 2019. doi: 10.4254/wjh.v11.i1.119
Published online Jan 27, 2019. doi: 10.4254/wjh.v11.i1.119
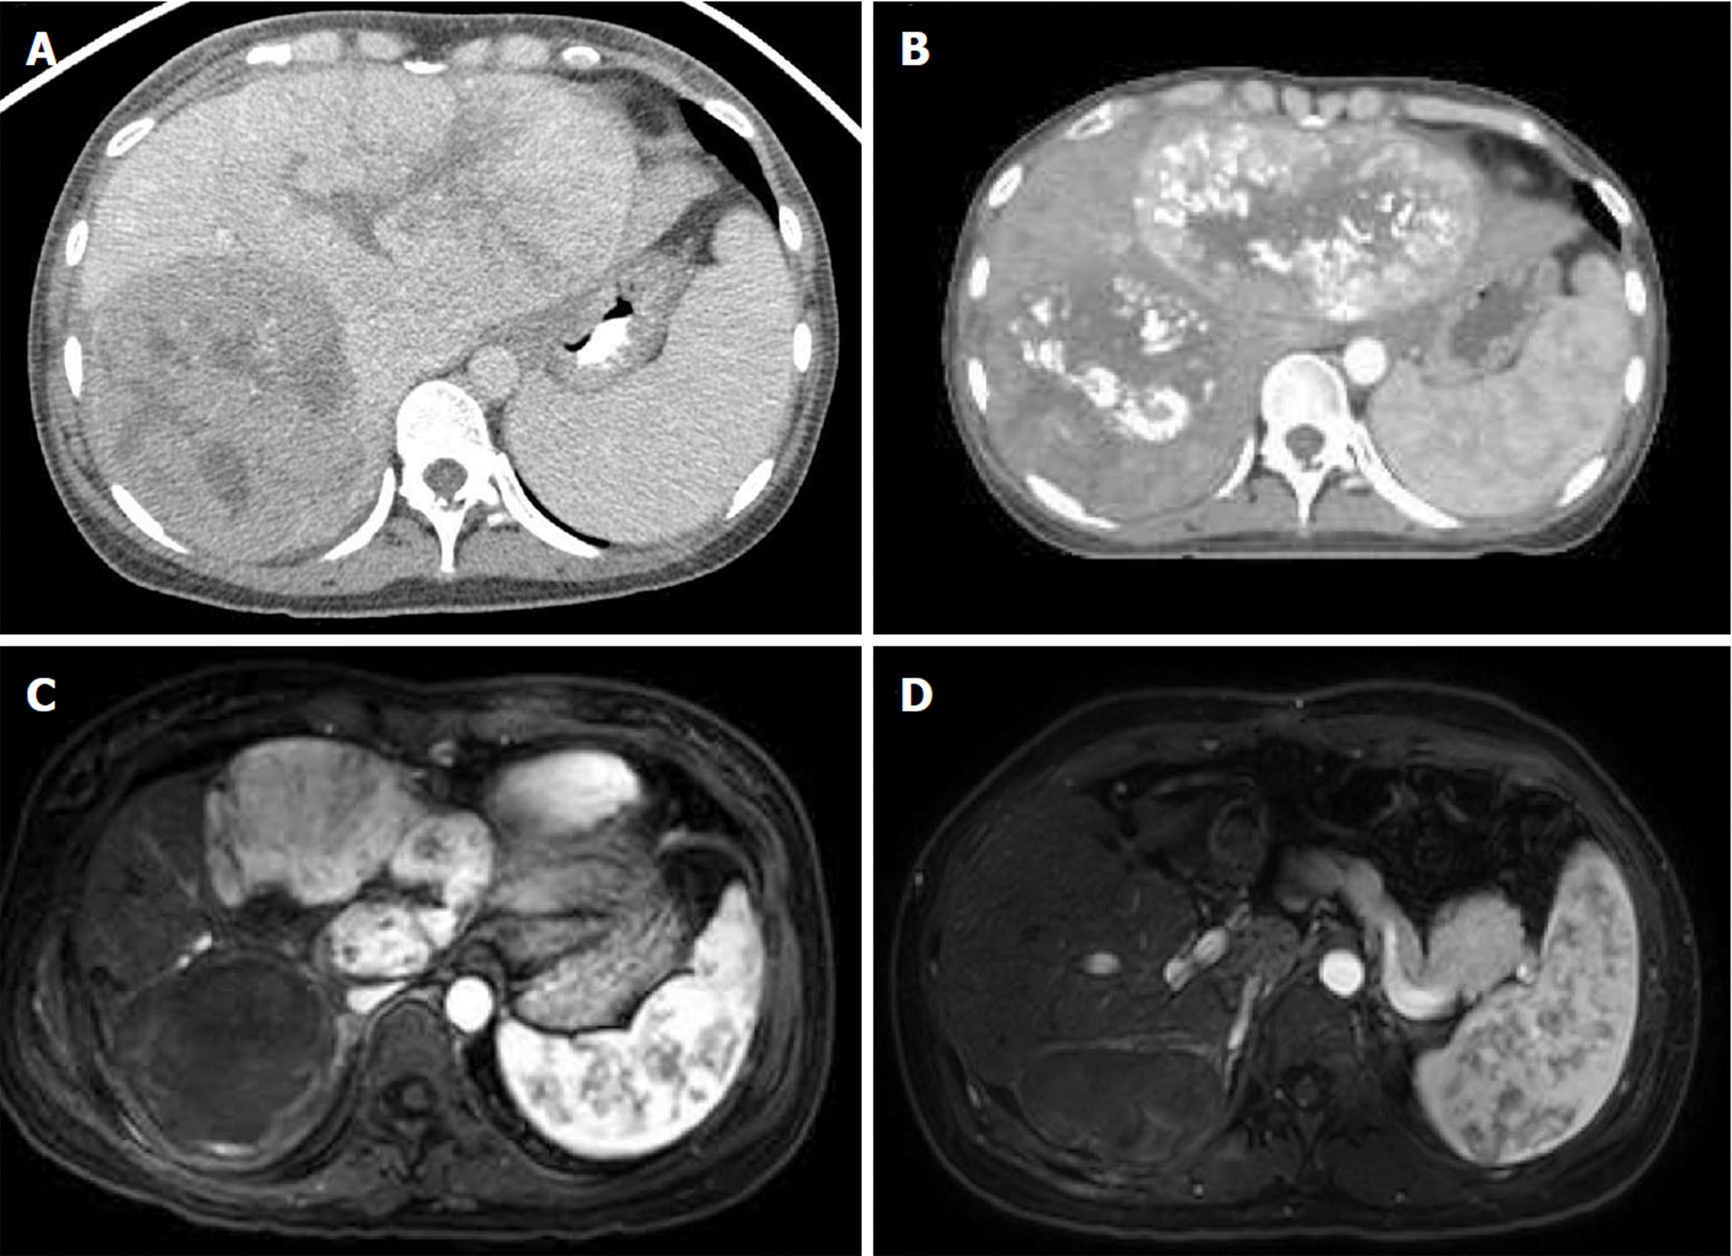
Figure 1 Initial portal venous phase contrast-enhanced computerized tomography showing bilobar lesions consistent with hepatocellular carcinoma.
A: Arterial phase contrast-enhanced low-dose radiation therapy planning computerized tomography showing post-transarterial chemoembolization treatment changes to bilateral lobes 3 mo after diagnosis; B: Arterial phase T1-weighted fat-saturated post-contrast magnetic resonance imaging showing complete right lobar mass response following proton radiation therapy 6 mo after diagnosis; C: Axial arterial phase T1-weighted fat-saturated post-contrast magnetic resonance imaging showing no evidence of disease following left hepatectomy; D: Axial arterial phase T1-weighted fat-saturated post-contrast magnetic resonance imaging showing no evidence of disease 14 mo after diagnosis.
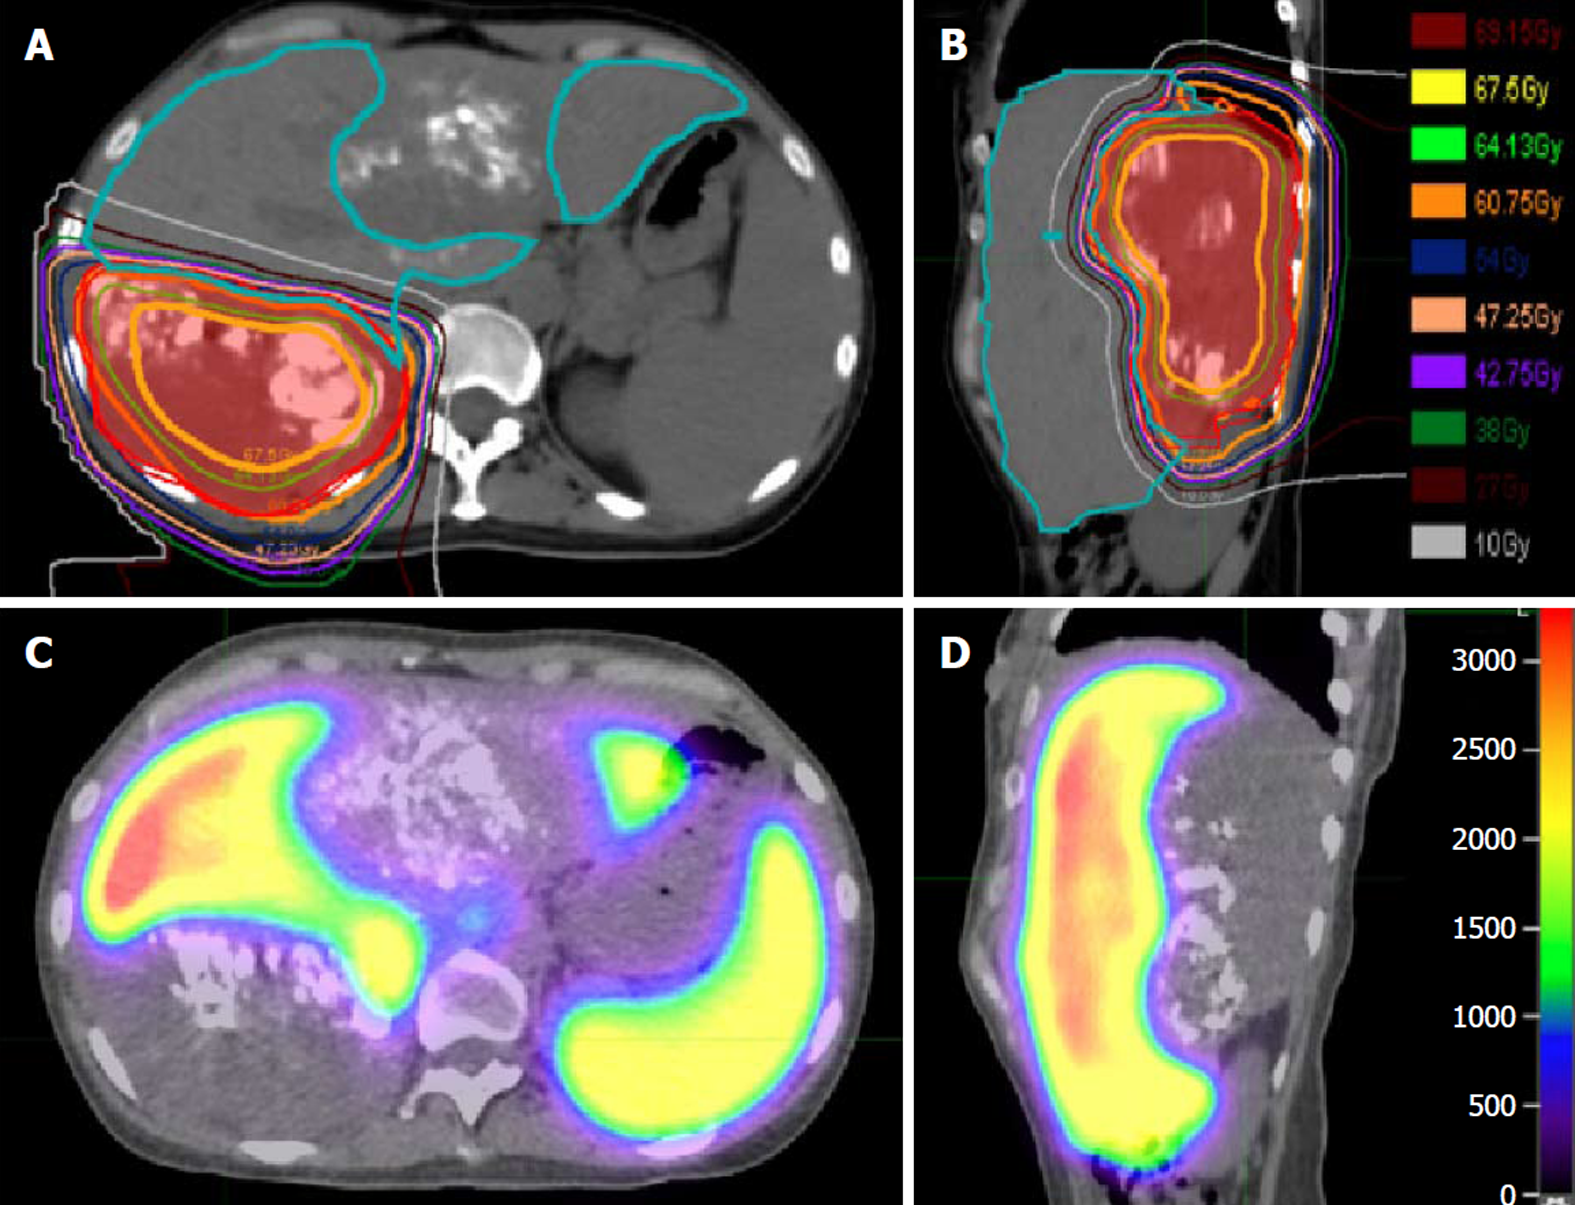
Figure 2 Radiation therapy approach.
A, B: Proton radiation therapy treatment using a 2-beam approach for the treatment of the right-sided hepatocellular carcinoma highlighting low dose to the contralateral lobe of the liver; C, D: Demonstrated functional liver imaging using technetium-99m sulfur colloid single-photon emission computerized tomography scan co-registered to the radiation therapy planning computed tomography to aid in target delineation of the gross tumor volume and sparing of the highly functional liver (max sulfur colloid single-photon emission counts shown in red). Key: Liver minus gross tumor volume is demonstrated by the teal line (panels A, B), internal target volume (gross tumor volume + tumor motion on 4D-computed tomography scan) is shaded in red (panels A, B).
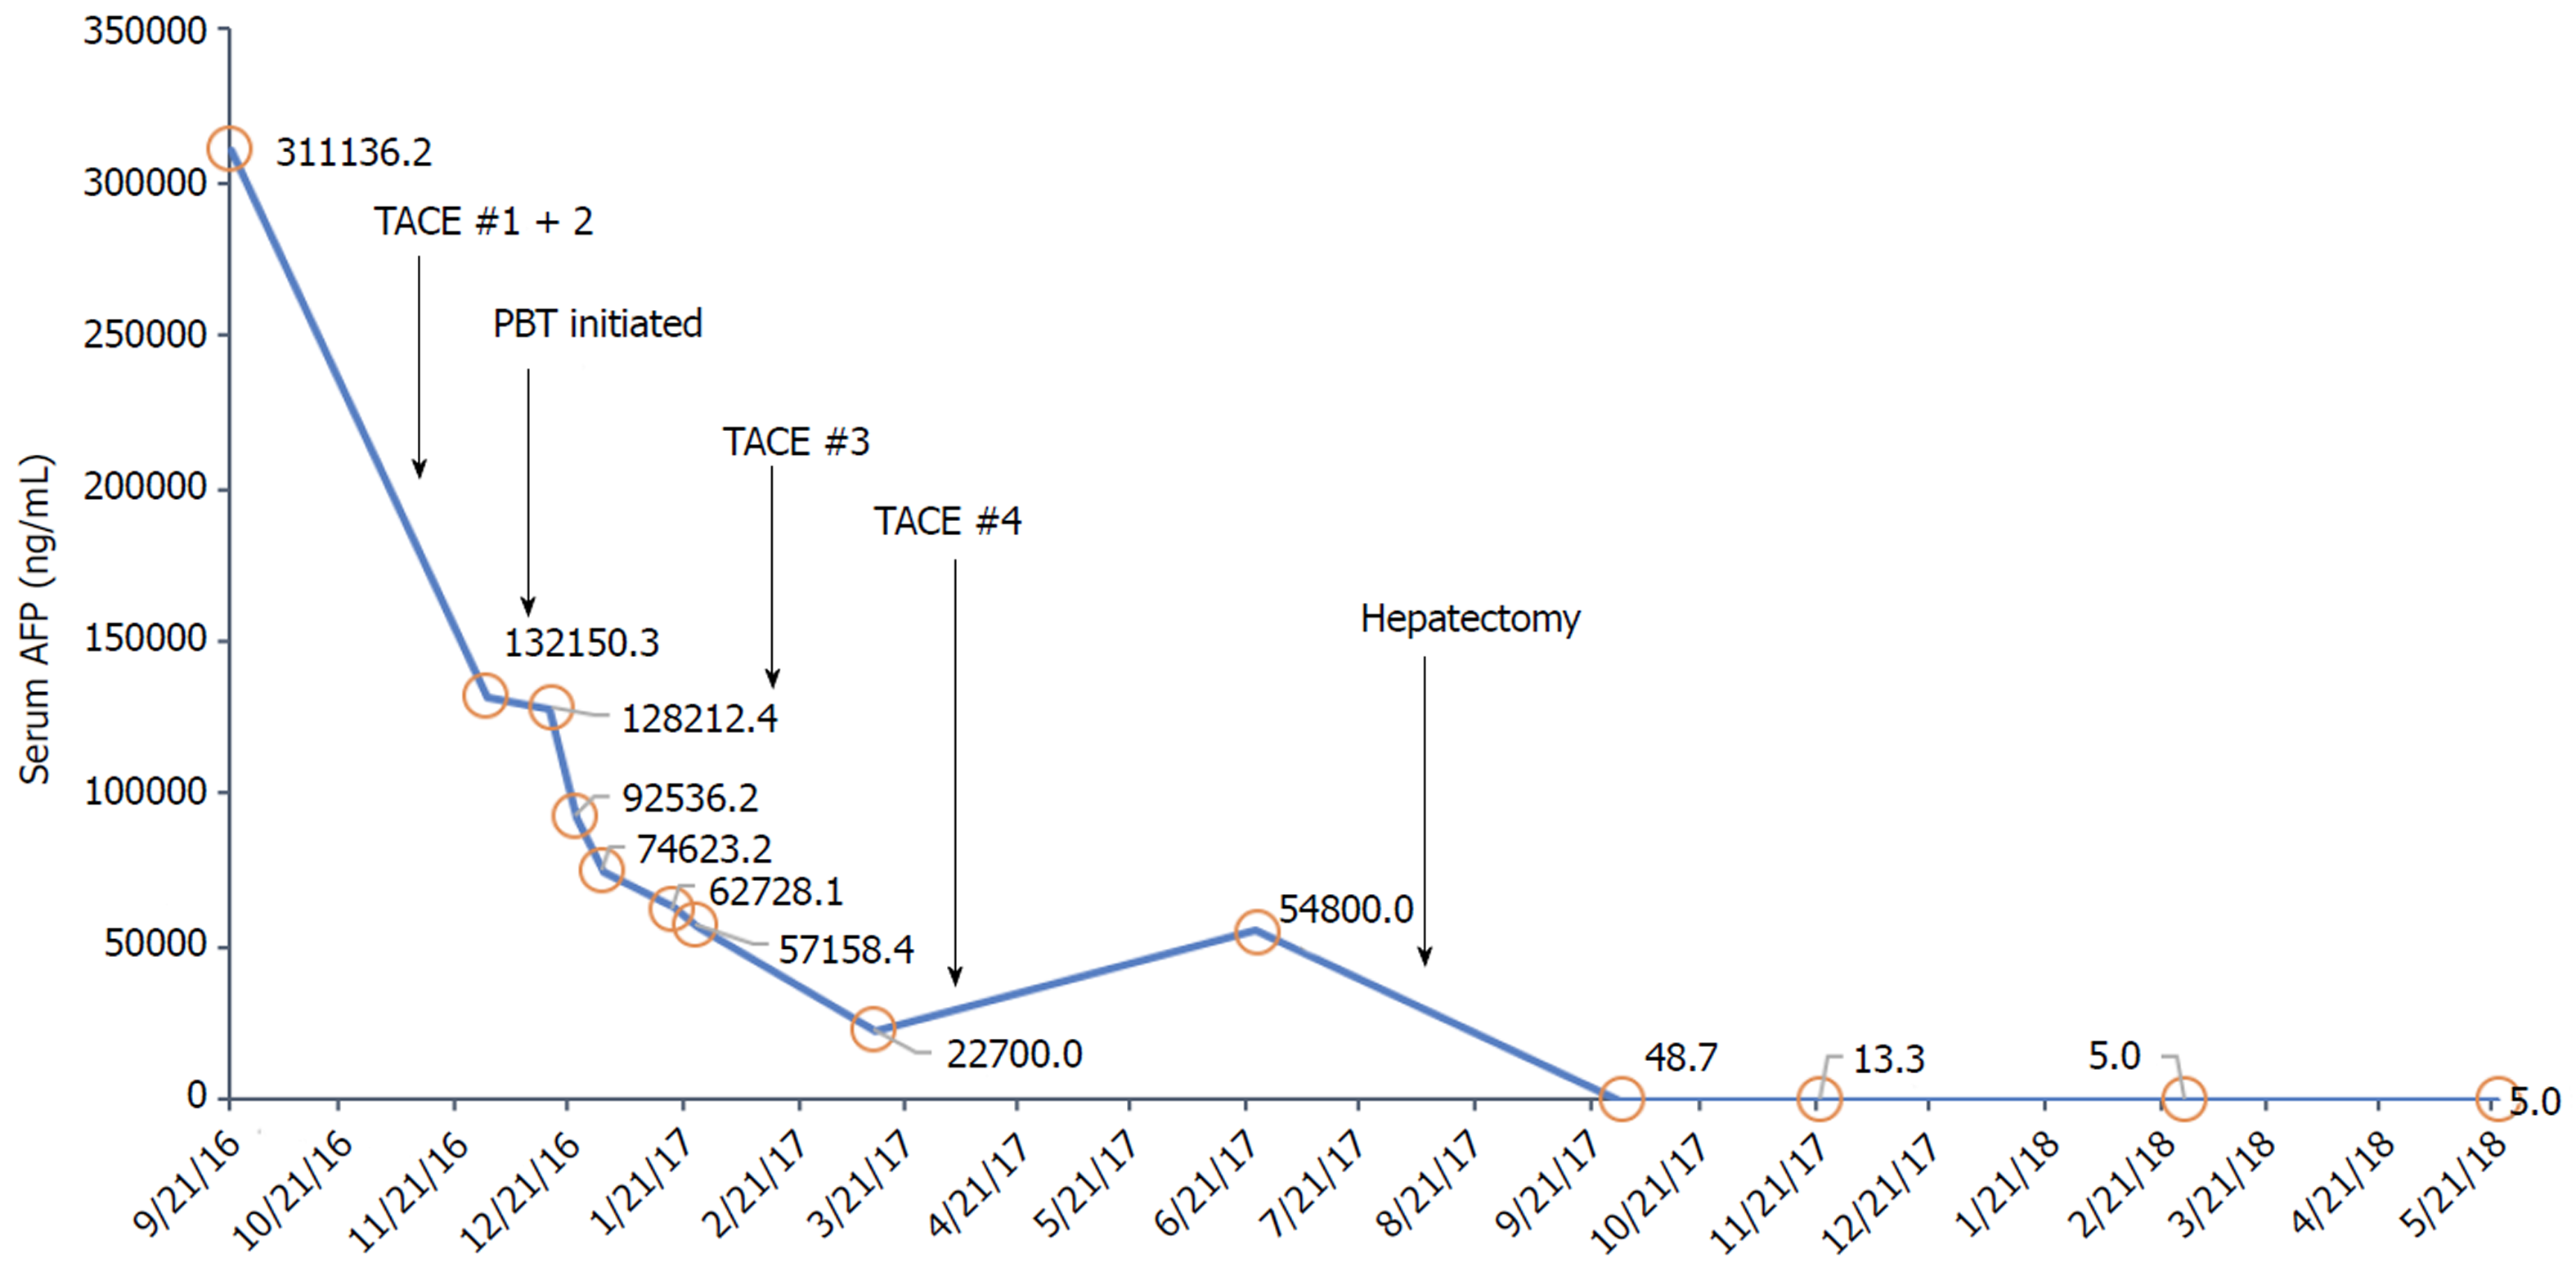
Figure 3 Serum alpha-fetoprotein level (ng/mL) during treatment course.
- Citation: Labadie KP, Schaub SK, Khorsand D, Johnson G, Apisarnthanarax S, Park JO. Multidisciplinary approach for multifocal, bilobar hepatocellular carcinoma: A case report and literature review. World J Hepatol 2019; 11(1): 119-126
- URL: https://www.wjgnet.com/1948-5182/full/v11/i1/119.htm
- DOI: https://dx.doi.org/10.4254/wjh.v11.i1.119


