Copyright
©The Author(s) 2018.
World J Hepatol. Nov 27, 2018; 10(11): 837-848
Published online Nov 27, 2018. doi: 10.4254/wjh.v10.i11.837
Published online Nov 27, 2018. doi: 10.4254/wjh.v10.i11.837
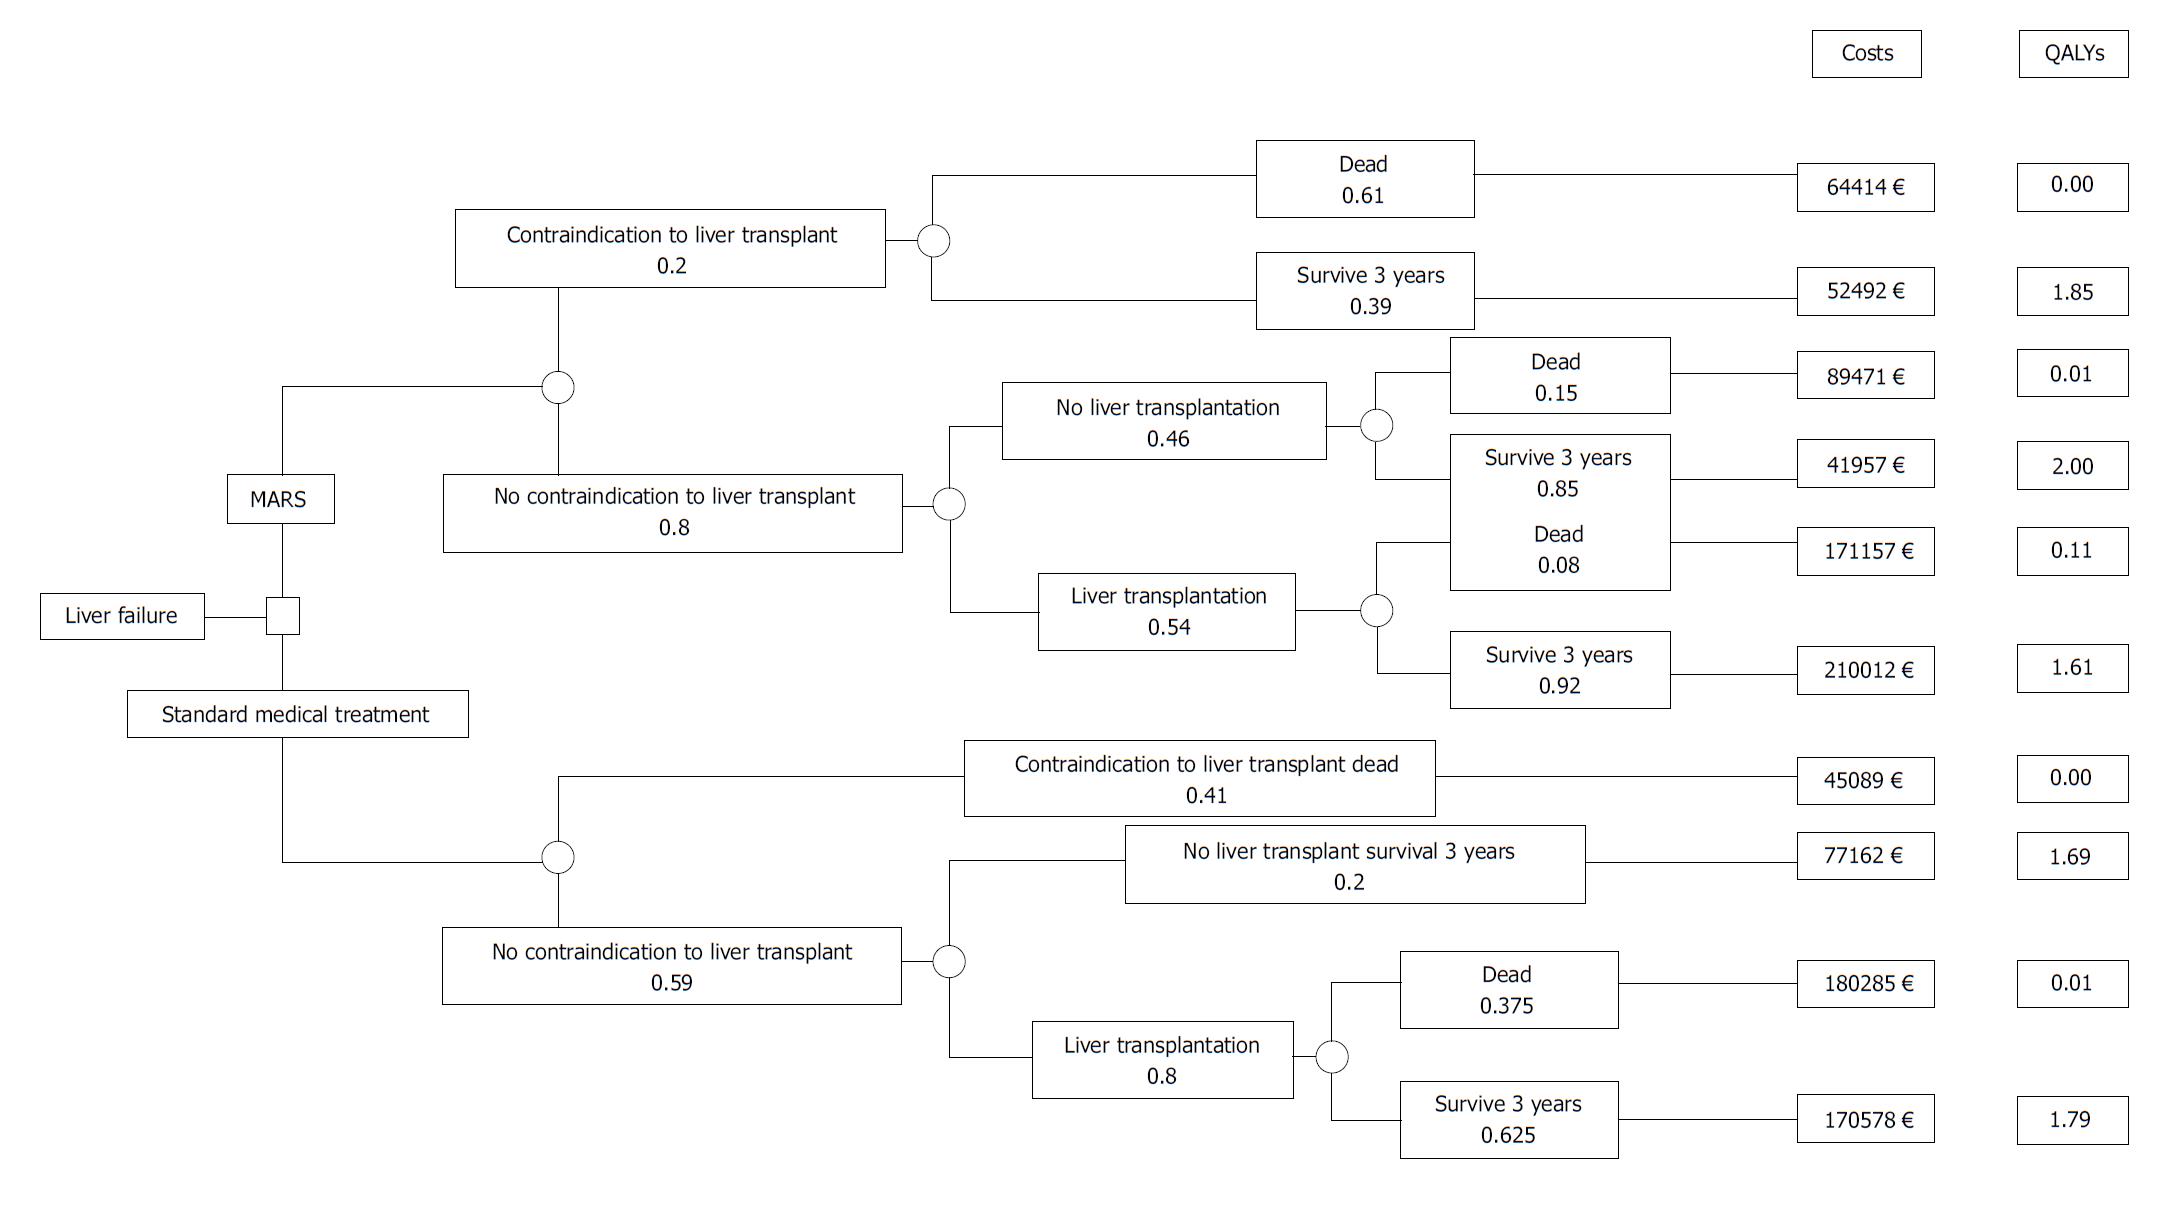
Figure 1 Decision tree for determining the short-term cost-utility of treatment in acute liver failure.
Choice between strategies (decision node) and occurrence of chance events (chance node). Kantola et al[21]. MARS: Molecular adsorbent recirculating system.
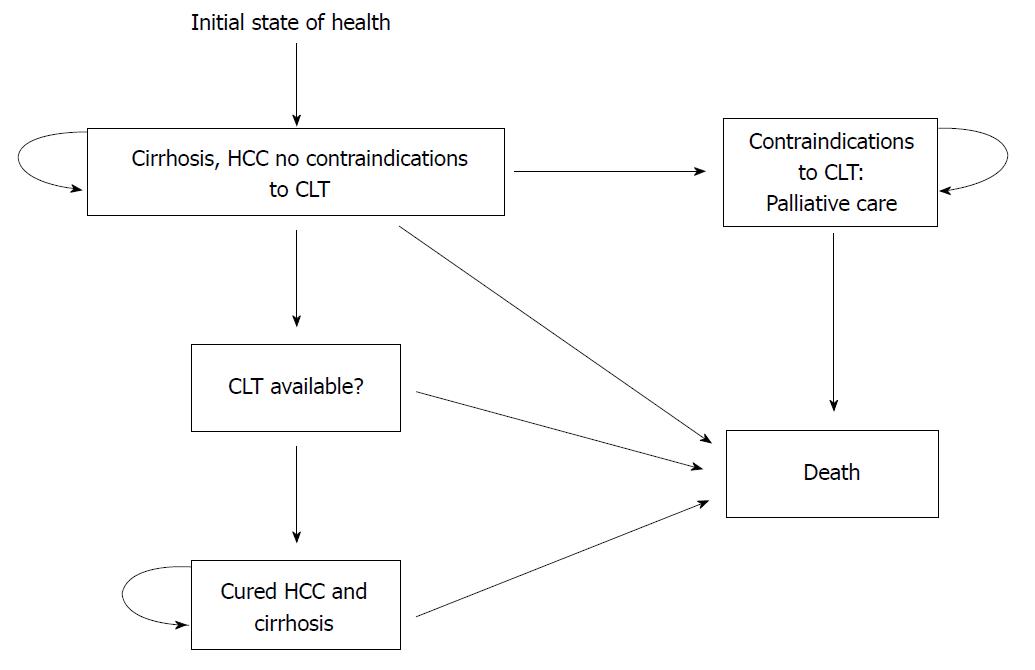
Figure 2 States of health in the decision model.
Each square represents a state of health. Straight arrows represent the changes that may occur during each month. Curved arrows mean that the patient may remain in the same state of health. Sarasin et al[23]. HCC: Hepatocellular carcinoma.
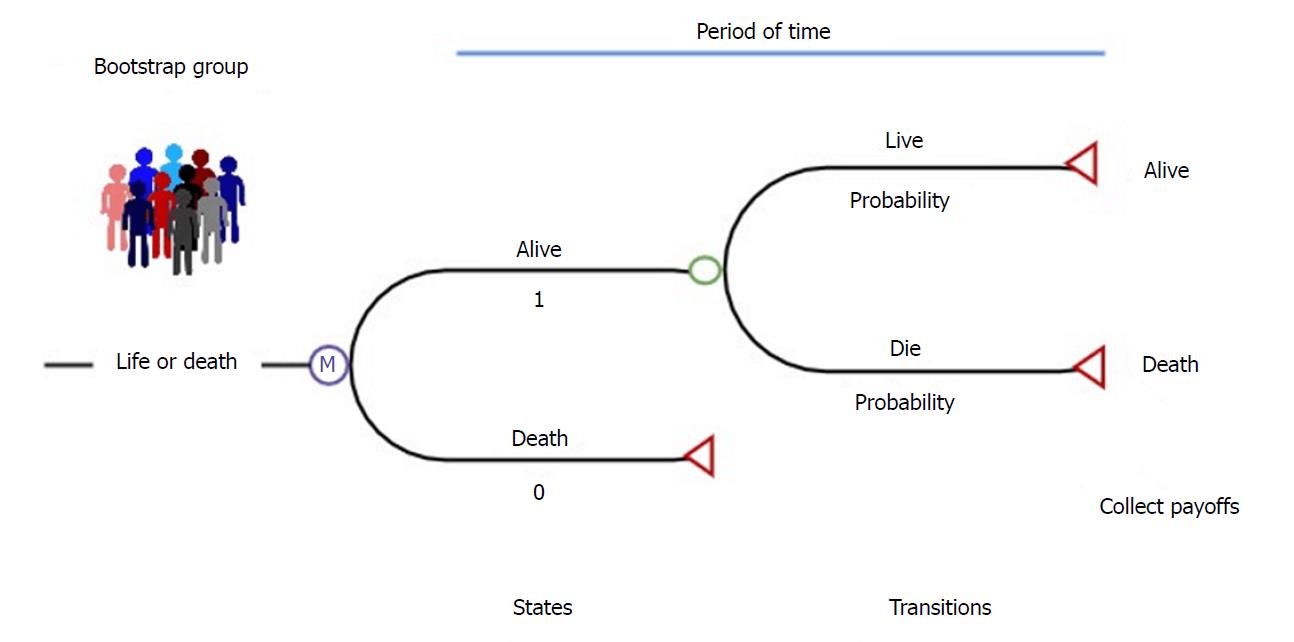
Figure 3 Simple example of a Markov microsimulation model.
Perkins et al[25].
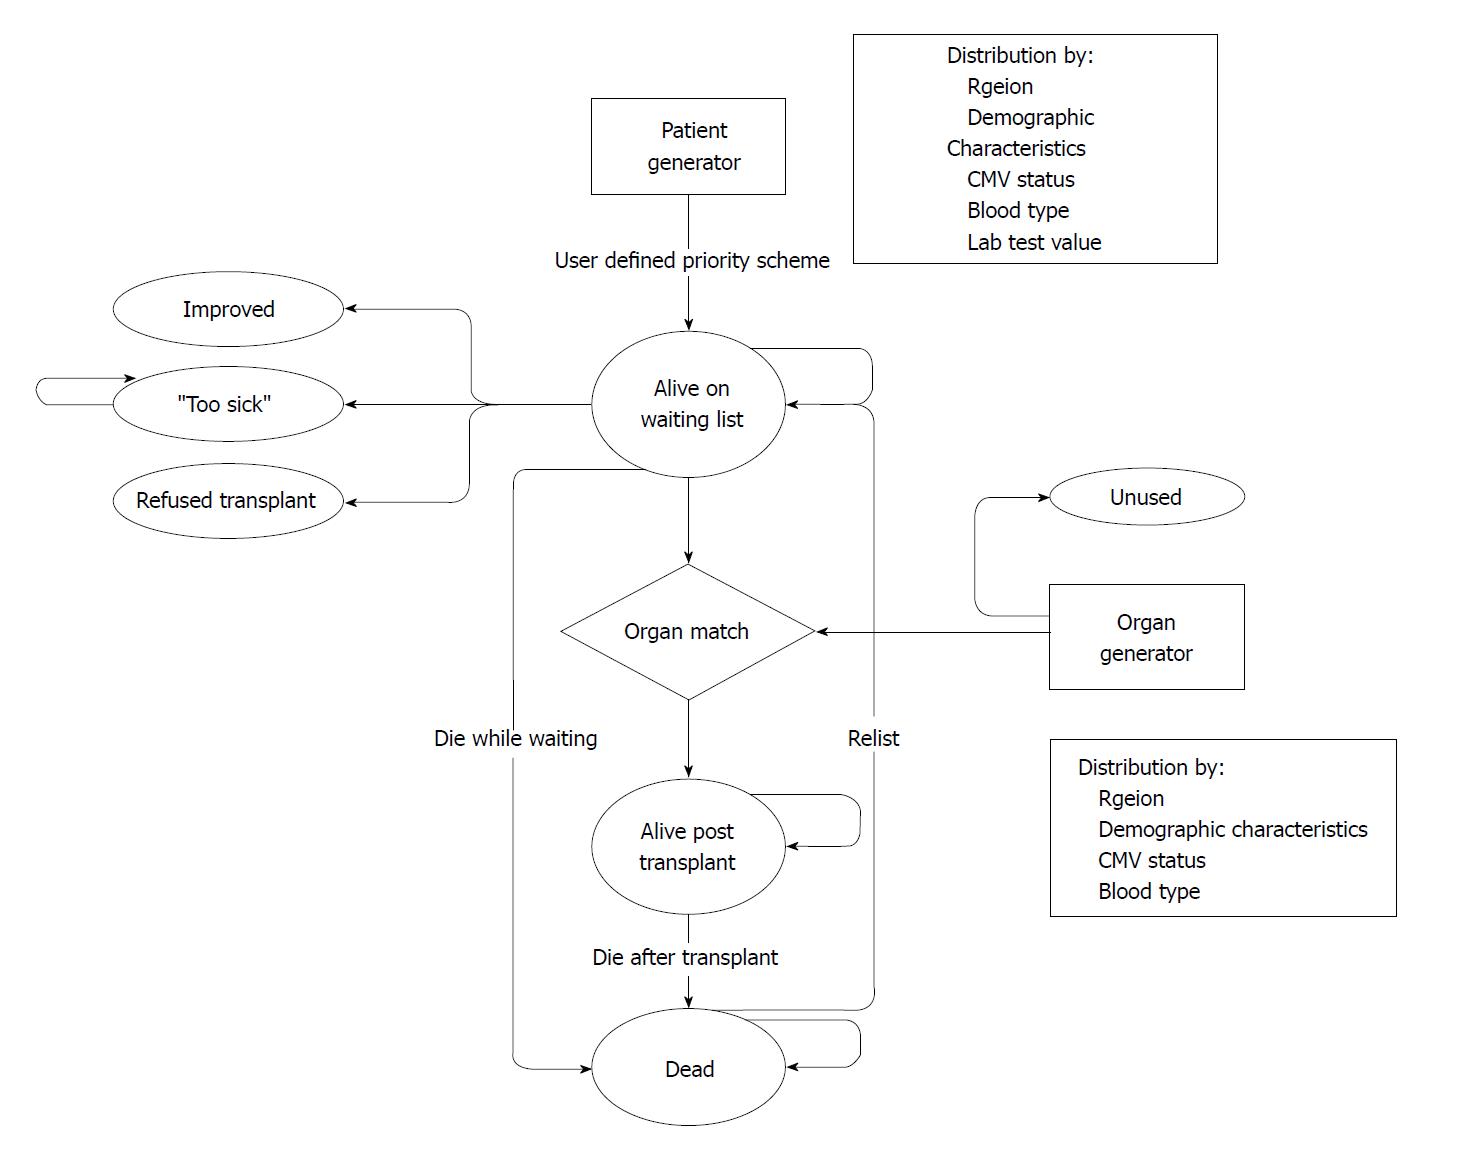
Figure 4 Model structure for patients entering the liver transplantation program.
Shechter et al[26].
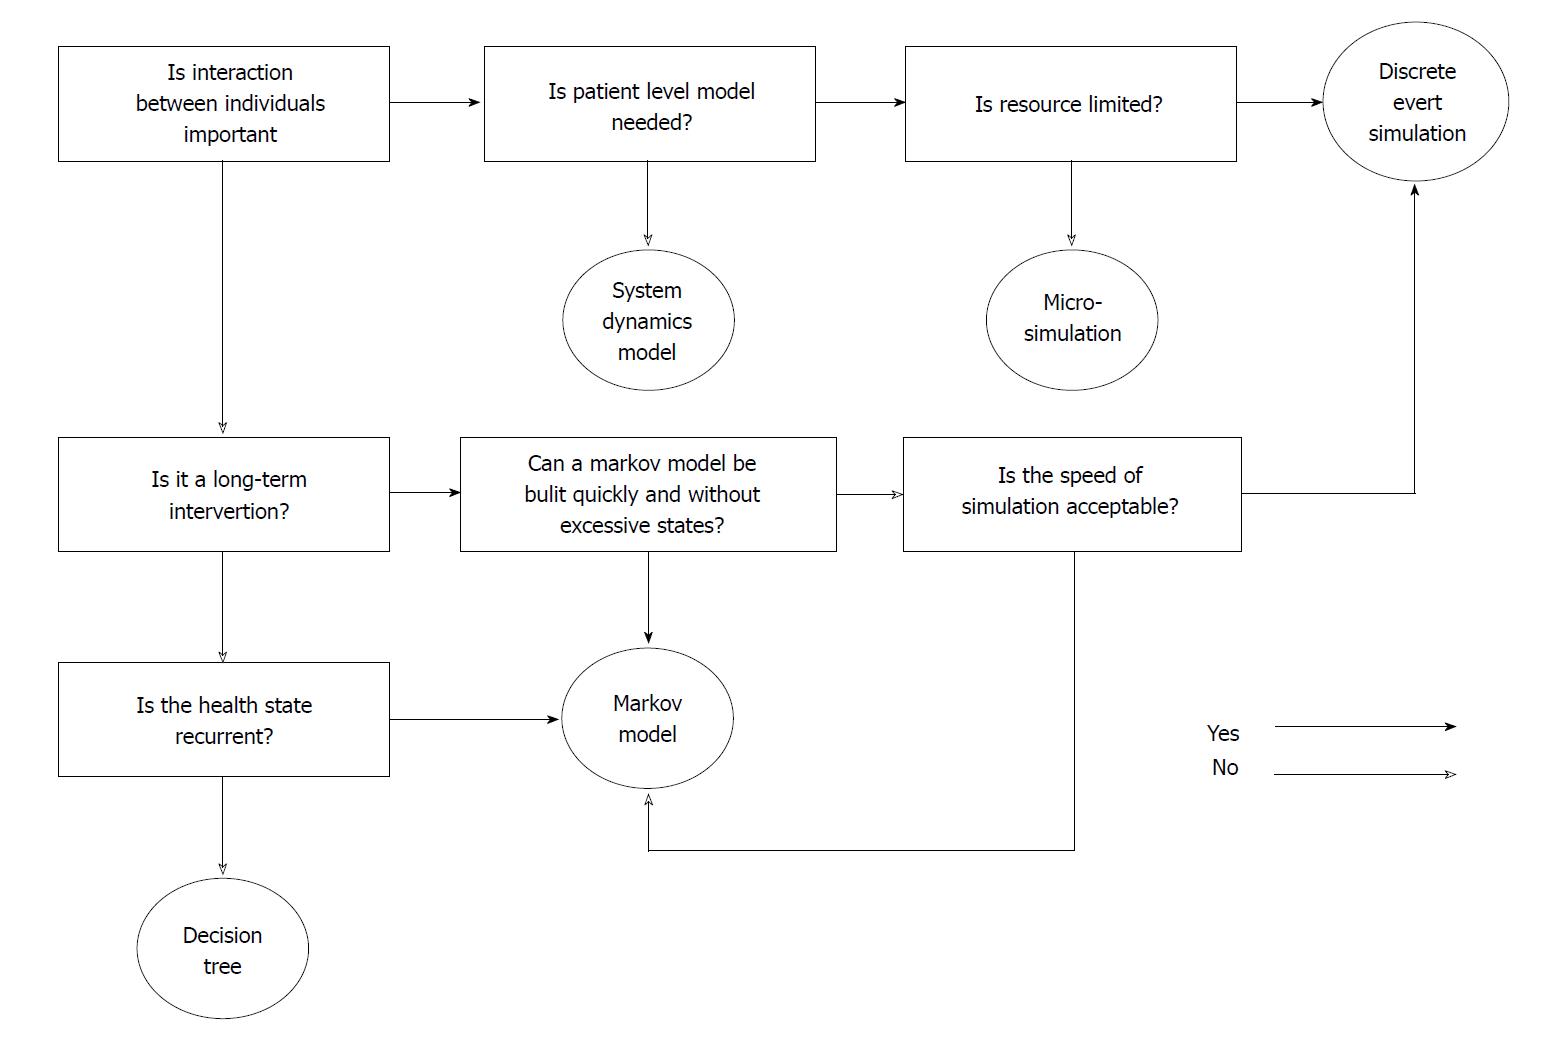
Figure 5 Scheme of selecting the appropriate model type.
- Citation: Qu Z, Krauth C, Amelung VE, Kaltenborn A, Gwiasda J, Harries L, Beneke J, Schrem H, Liersch S. Decision modelling for economic evaluation of liver transplantation. World J Hepatol 2018; 10(11): 837-848
- URL: https://www.wjgnet.com/1948-5182/full/v10/i11/837.htm
- DOI: https://dx.doi.org/10.4254/wjh.v10.i11.837


