Copyright
©The Author(s) 2023.
World J Stem Cells. Sep 26, 2023; 15(9): 908-930
Published online Sep 26, 2023. doi: 10.4252/wjsc.v15.i9.908
Published online Sep 26, 2023. doi: 10.4252/wjsc.v15.i9.908
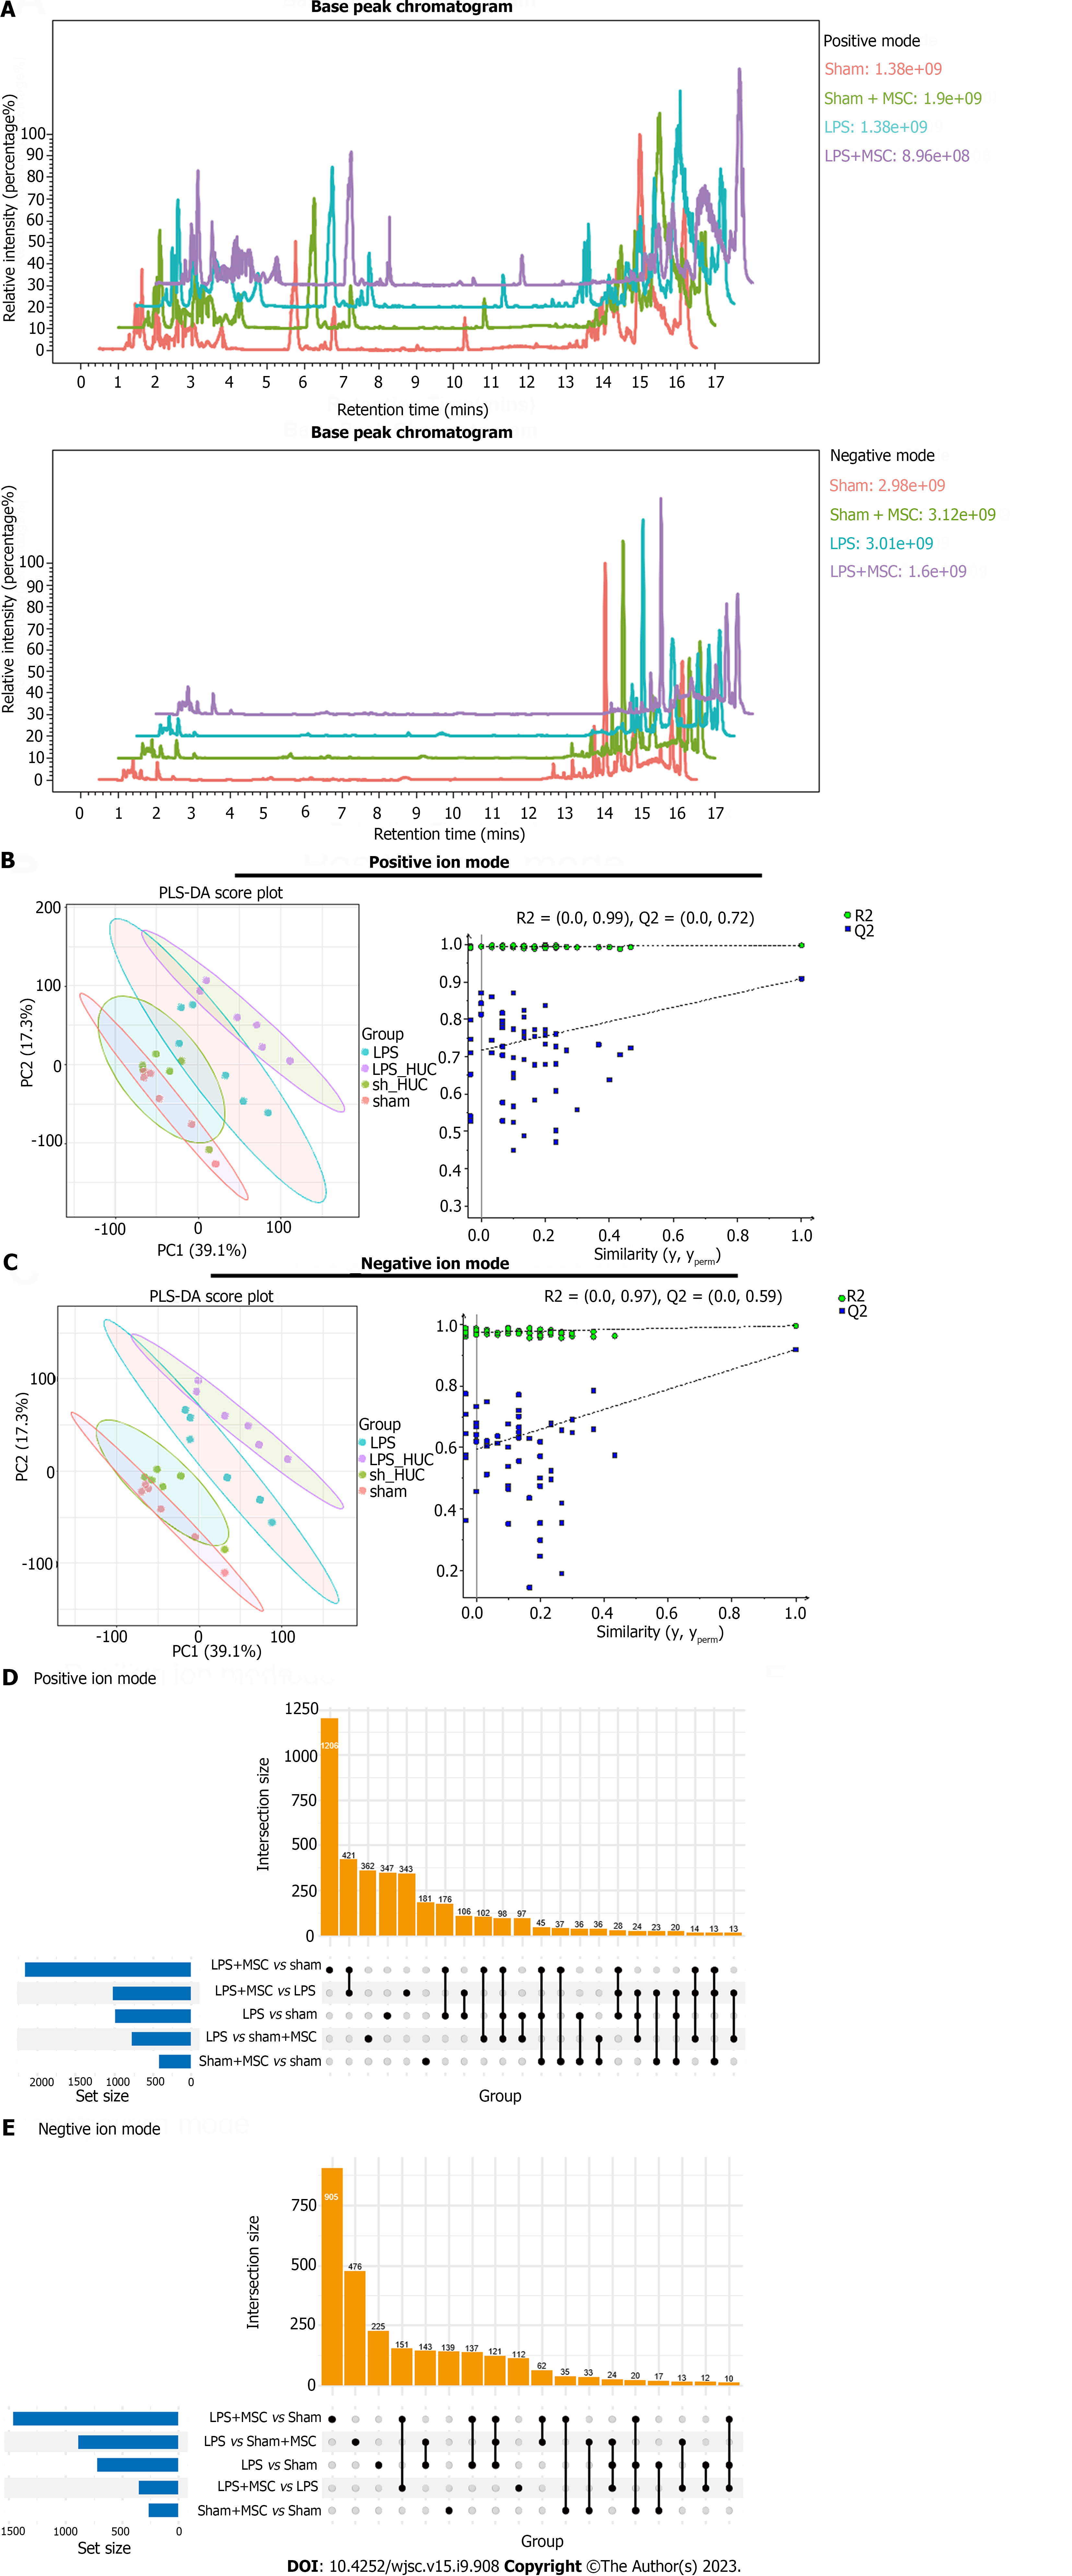
Figure 7 Metabolomics for the lung (n = 6).
A: Base peak chromatogram in positive/negative mode; B and C: The Partial Least Squares-Discriminant Analysis was used to distinguish metabolite differences between groups in positive/negative mode; D and E: Upset Venn diagrams were used to count the number of common and unique differential metabolites in different groups. The bar chart at the bottom left represents the total number of differential metabolites between two groups. The bar chart above shows common metabolites. The results are based on mass spectrum analysis data. LPS: Lipopolysaccharide; MSC: Mesenchymal stem cell.
- Citation: Lv L, Cui EH, Wang B, Li LQ, Hua F, Lu HD, Chen N, Chen WY. Multiomics reveal human umbilical cord mesenchymal stem cells improving acute lung injury via the lung-gut axis. World J Stem Cells 2023; 15(9): 908-930
- URL: https://www.wjgnet.com/1948-0210/full/v15/i9/908.htm
- DOI: https://dx.doi.org/10.4252/wjsc.v15.i9.908


