Copyright
©The Author(s) 2023.
World J Stem Cells. Sep 26, 2023; 15(9): 908-930
Published online Sep 26, 2023. doi: 10.4252/wjsc.v15.i9.908
Published online Sep 26, 2023. doi: 10.4252/wjsc.v15.i9.908
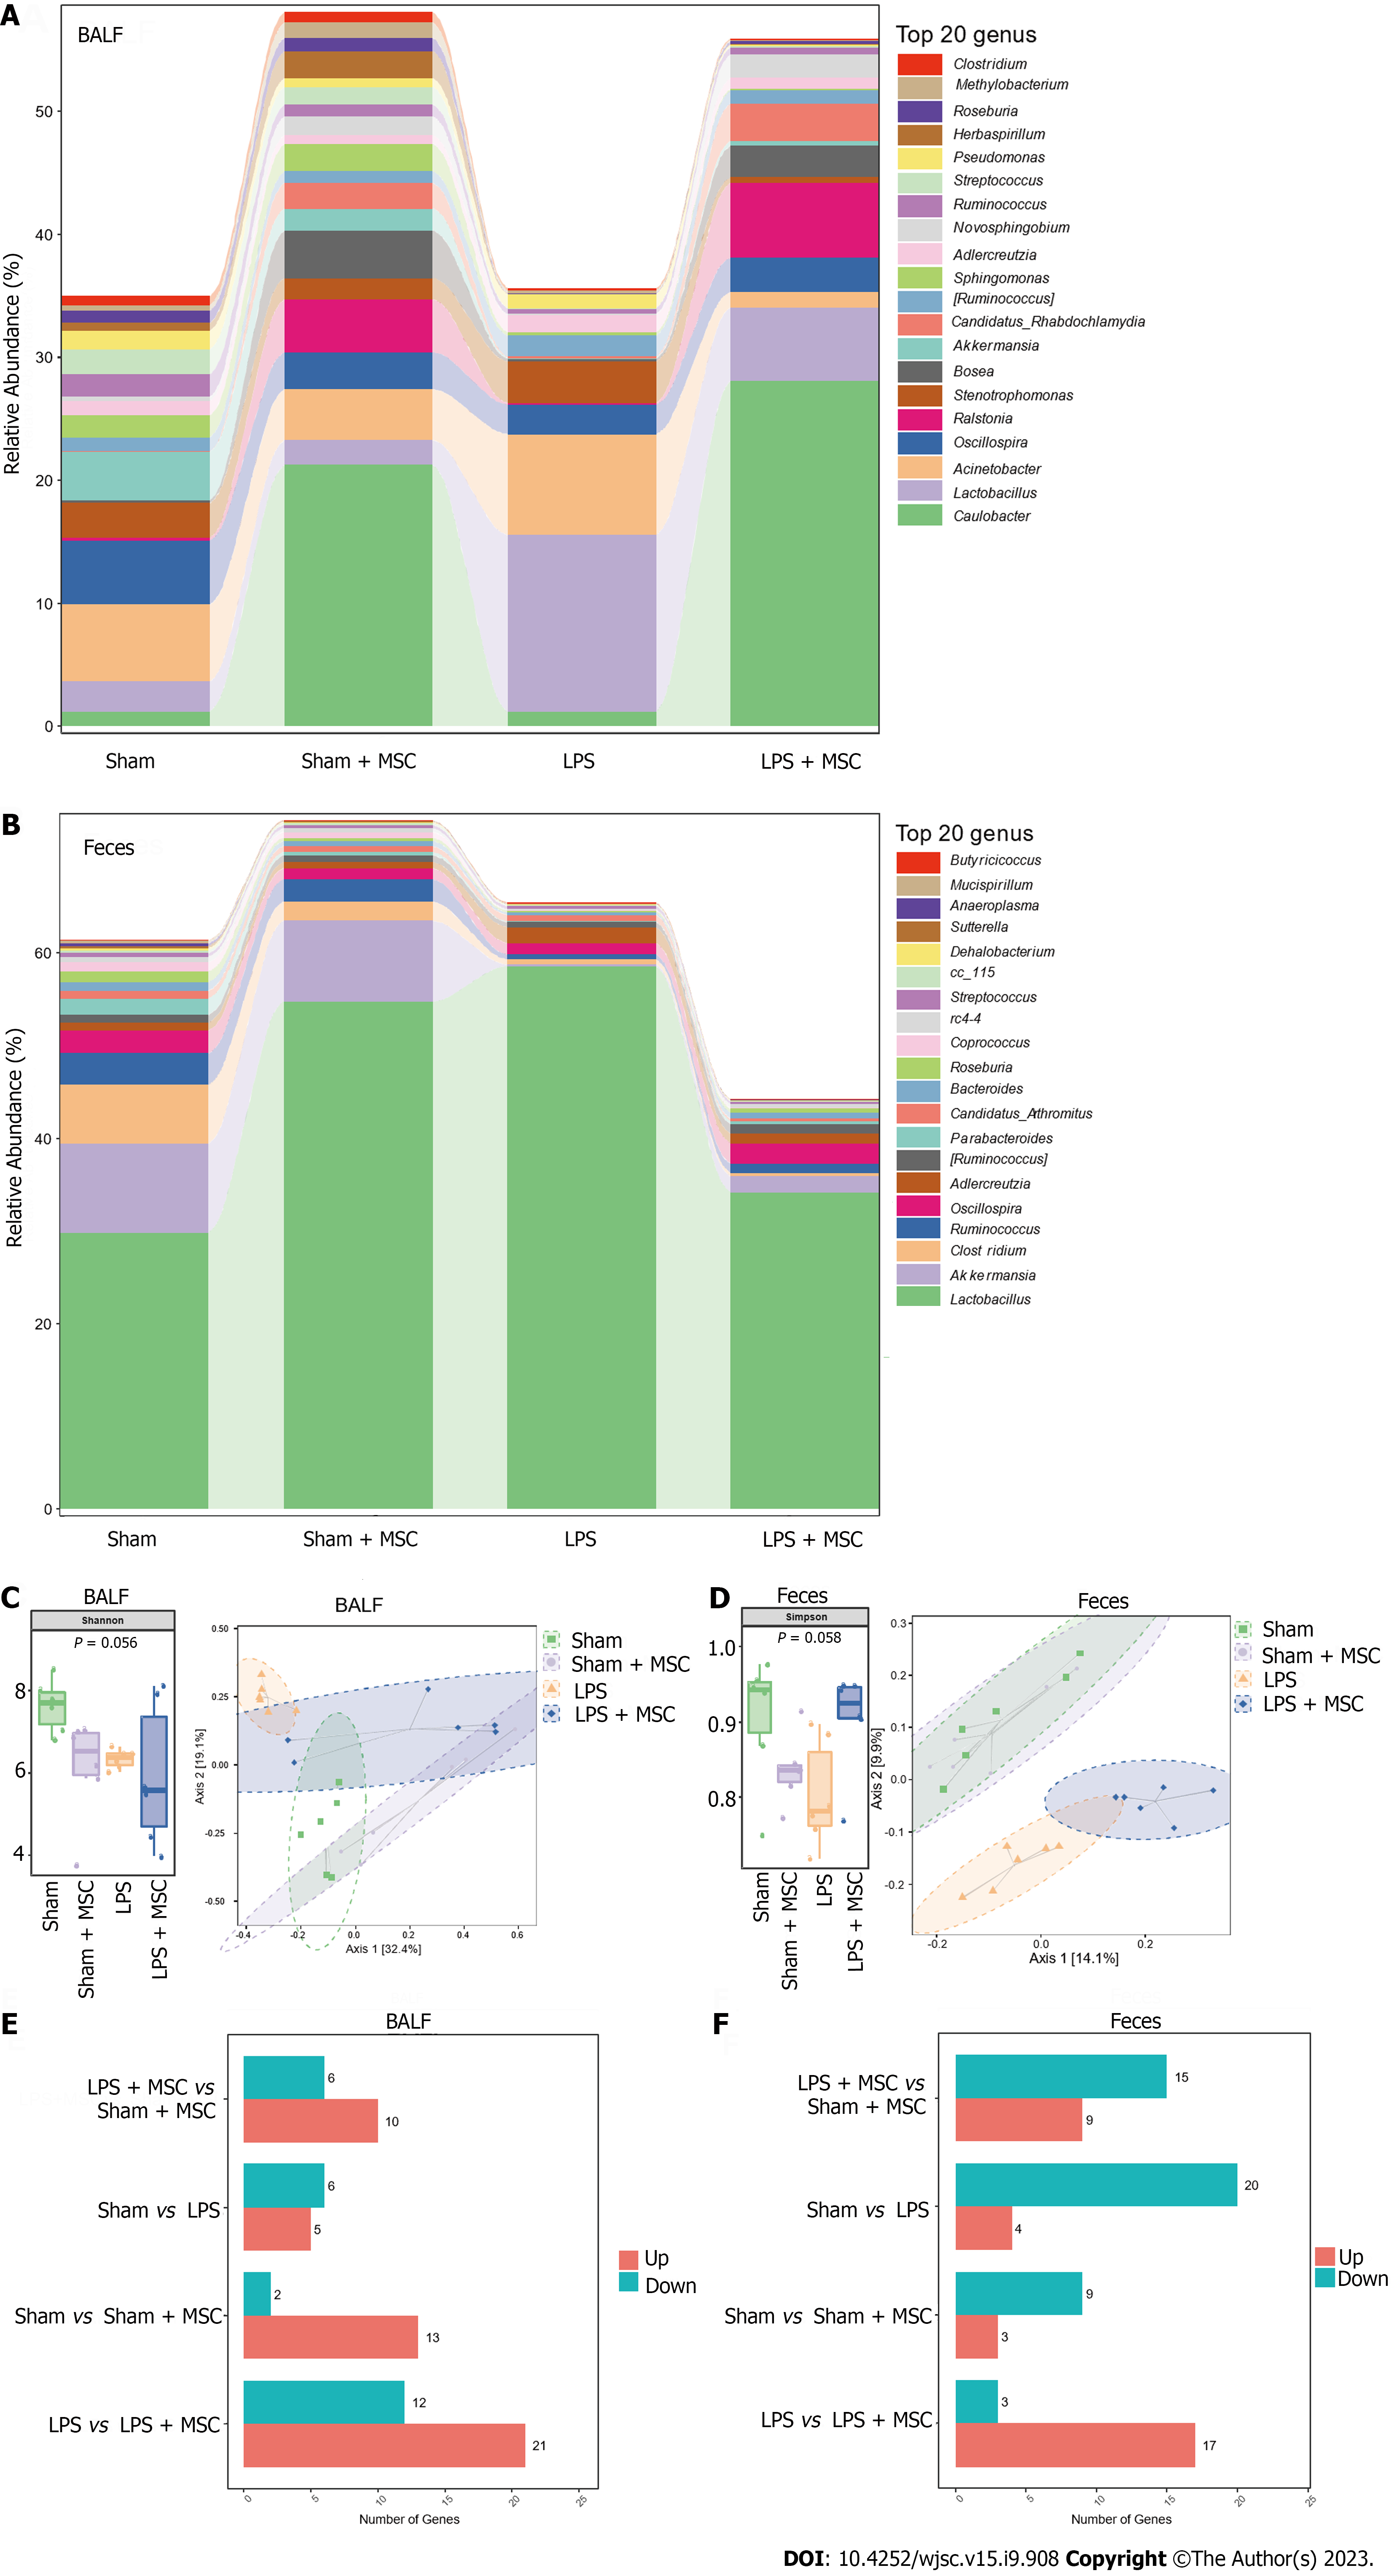
Figure 4 Microflora homeostasis in bronchoalveolar lavage fluid and feces of acute lung injury mice (n = 6).
A and B: Relative abundance of top 20 genera of microflora in bronchoalveolar lavage fluid (BALF) and feces; C and D: The within-sample richness and evenness (alpha diversity) were statistically analyzed by Shannon index, Simpson index, and the bray-Curtis based principal coordinates analysis of similarity coefficients in the BALF and feces of different groups (beta diversity); E and F: The Wilcoxon rank sum test was used to explore microflorae with a significant difference in abundance on OmicShare Tools. The number of differential microflorae in lipopolysaccharide (LPS) + mesenchymal stem cells (MSCs) group vs sham + MSC group, sham group vs LPS group, sham group vs sham + MSC group, and LPS group vs LPS + MSCs group is presented. The length of the red bar indicates the number of up-regulated microflorae and the length of the blue-green bar indicates the number of down-regulated microflorae. LPS: Lipopolysaccharide; MSC: Mesenchymal stem cell; BALF: Bronchoalveolar lavage fluid.
- Citation: Lv L, Cui EH, Wang B, Li LQ, Hua F, Lu HD, Chen N, Chen WY. Multiomics reveal human umbilical cord mesenchymal stem cells improving acute lung injury via the lung-gut axis. World J Stem Cells 2023; 15(9): 908-930
- URL: https://www.wjgnet.com/1948-0210/full/v15/i9/908.htm
- DOI: https://dx.doi.org/10.4252/wjsc.v15.i9.908


