Copyright
©The Author(s) 2015.
World J Stem Cells. Jun 26, 2015; 7(5): 883-893
Published online Jun 26, 2015. doi: 10.4252/wjsc.v7.i5.883
Published online Jun 26, 2015. doi: 10.4252/wjsc.v7.i5.883
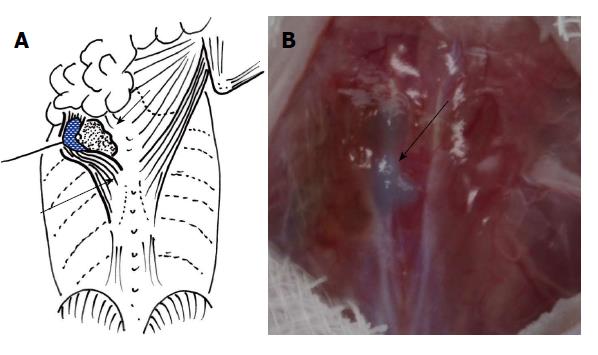
Figure 1 Method for cardiomyocyte transplantation.
A: The cardiomyocyte sheet (short arrow) is inserted under the latissimus dorsi muscle (long arrow); B: The sheet stained with Nile blue (arrow) can be seen through the muscle.
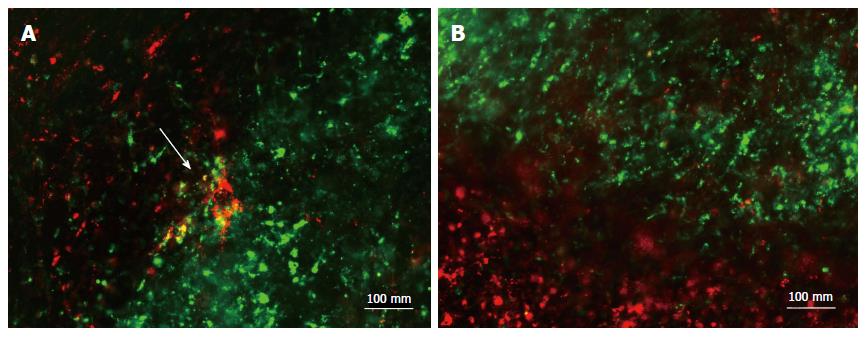
Figure 2 Cell fusion in vitro.
DiO-stained cardiomyocytes (green) and DiI-stained muscle fibers (red) were examined. A: In G1 HVJ-E(+), the red and green staining shows partial merging (arrow); B: In G3 HVJ-E(-), the red and green staining is separated and no merging is observed. HVJ-E: Hemagglutinating virus of Japan envelope.
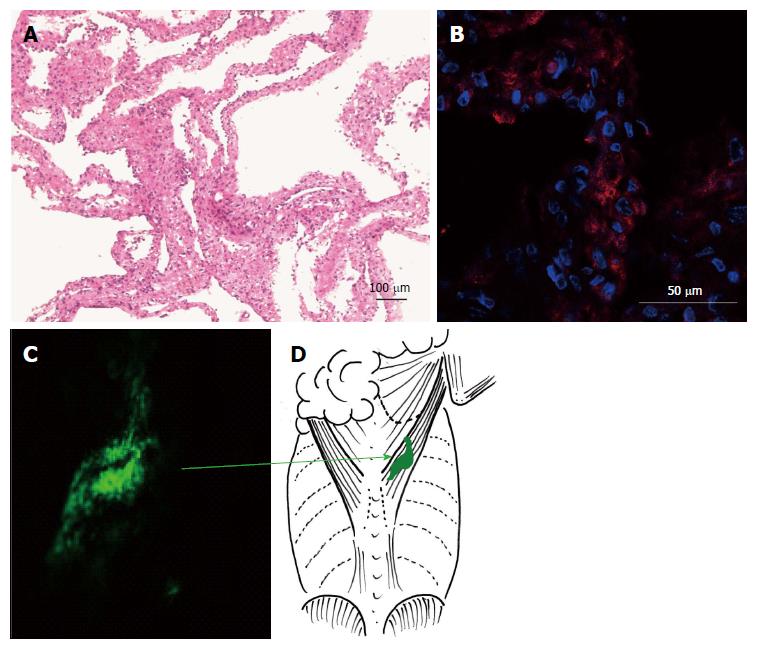
Figure 3 Representative cardiomyocyte sheets.
A: HE staining of a cardiomyocyte sheet separated from the dish; B: The sheets contain cardiac troponin-positive cells (red); C: At 2 wk after transplantation, the DiO-stained sheet (green) occupies the same position as the primary transplanted site (green arrow); D: Schematic diagram showing the transplanted area under the latissimus dorsi muscle.
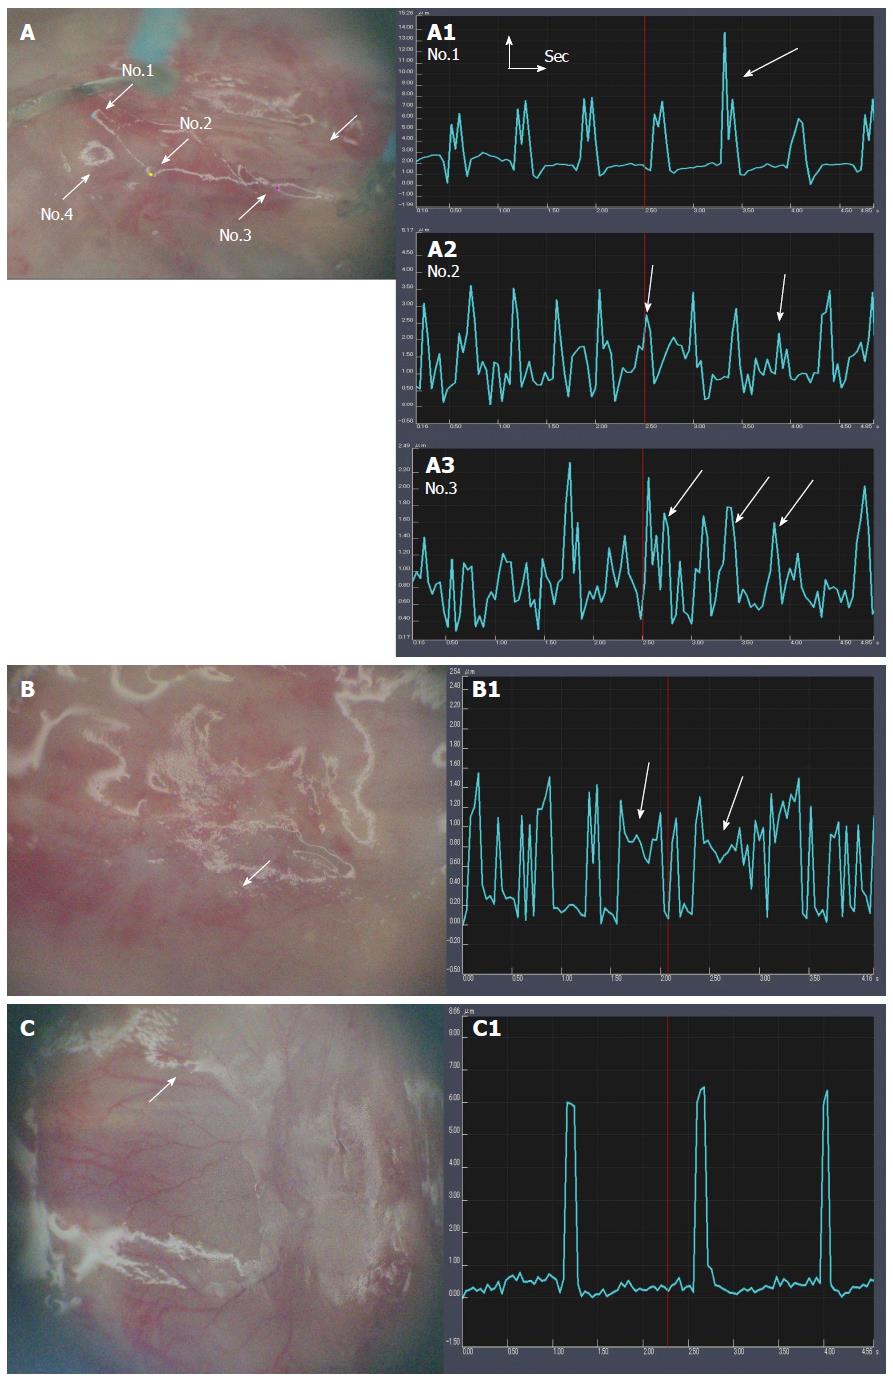
Figure 4 Motion image analysis of transplanted domains.
A: Rich motion areas (arrows) in G1 NaOH(+), HVJ-E(+), Cardiomyocytes(+). Length: μm; width: time (s); A1: The amplitudes are ordered. Large amplitudes rarely appear (arrow); A2: The amplitudes are more frequent, and their width is mostly ordered, but their amplitudes are both high and low. Low amplitudes (arrows) are fewer than high amplitudes; A3: The amplitude width is disordered. The amplitudes consist of three kinds: high, middle (arrows), and low. The frequency of each size is as follows: low > middle > high; B: Poor beating areas in G3 NaOH(-), HVJ-E(+), Cardiomyocytes(+); B1: The width between the amplitudes is irregular. High and low amplitudes are mixed. In particular, some amplitudes do not return to the baseline, and stop on the way for a short time (arrows); C: Poor motion areas in G2 NaOH(+), HVJ-E(-), Cardiomyocytes(+); C1: The amplitude width is long. The amplitudes maintain the same height. HVJ-E: Hemagglutinating virus of Japan envelope.
Figure 5 Action potentials of transplanted domains.
A: Definite action potentials are scarcely detected in G3 NaOH(-), HVJ-E(+), Cardiomyocytes(+) (arrows), but the few action potentials observed are varied in waveforms and sizes; B: In G1 NaOH(+), HVJ-E(+), Cardiomyocytes(+), the waveforms are definite and mostly the same (arrows), although there are a few different waveforms. HVJ-E: Hemagglutinating virus of Japan envelope.
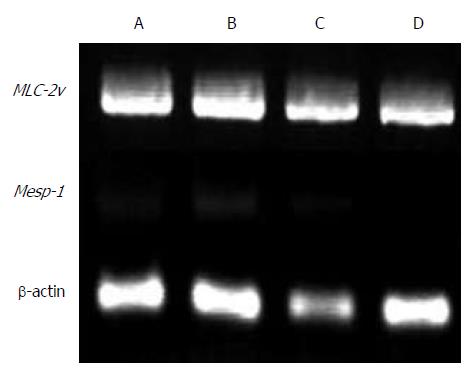
Figure 6 Gene expression in transplanted sheets.
MLC-2v expression is maintained at 2 wk after transplantation, but Mesp1 expression decreases at 2 wk compared with 1 wk after transplantation. A: G3 at 1 wk; B: G1 at 1 wk; C: G3 at 2 wk; D: G1 at 2 wk.
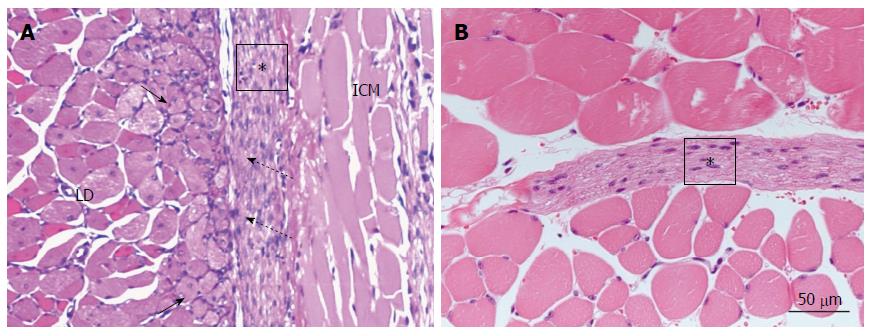
Figure 7 Histology of transplanted domains at 1 wk after transplantation.
A: In G1 NaOH(+), HJV-E(+), Cardiomyocytes(+), myoblasts (dotted long arrows) are marked in the latissimus dorsi muscle (LD). The cardiomyocyte sheet (asterisk) adheres to the myoblast layer at various points (short arrows); B: There are no myoblasts, and no adhesion of the cardiomyocyte sheet (asterisk) to the skeletal muscles in G3 NaOH(-), HJV-E(+), Cardiomyocytes(+). The interspace between the cardiomyocyte sheet and the skeletal muscle fibers is wider. ICM: Intercostal muscle.
Figure 8 HE staining and immunostaining of cellular close contacts in G1.
A: The myofibrils of cardiomyocytes (asterisk) are looser than those of skeletal muscle fibers (MF). The boundary is not differentiated between the cardiomyocytes and skeletal muscle fibers. A part of the myoblast sarcoplasma seems to project into the cardiomyocyte plasma (arrows); B: Immunostaining for cardiac troponin (red), skeletal myosin (green), and nuclei (blue). Small projections of skeletal myosin produce invaginations of cardiac troponin (short arrows). Cardiac troponin and skeletal myosin sandwich some nuclei (dotted long arrows) from each side.
- Citation: Takahashi Y, Tomotsune D, Takizawa S, Yue F, Nagai M, Yokoyama T, Hirashima K, Sasaki K. New model for cardiomyocyte sheet transplantation using a virus-cell fusion technique. World J Stem Cells 2015; 7(5): 883-893
- URL: https://www.wjgnet.com/1948-0210/full/v7/i5/883.htm
- DOI: https://dx.doi.org/10.4252/wjsc.v7.i5.883


