Copyright
©The Author(s) 2015.
World J Stem Cells. Mar 26, 2015; 7(2): 495-501
Published online Mar 26, 2015. doi: 10.4252/wjsc.v7.i2.495
Published online Mar 26, 2015. doi: 10.4252/wjsc.v7.i2.495
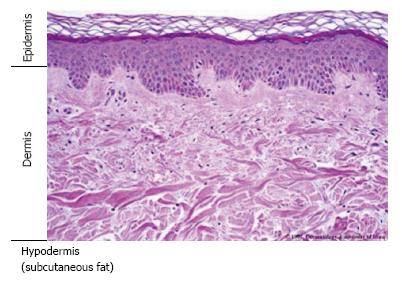
Figure 1 Skin structure involves the epidermis, dermis and hypodermis.
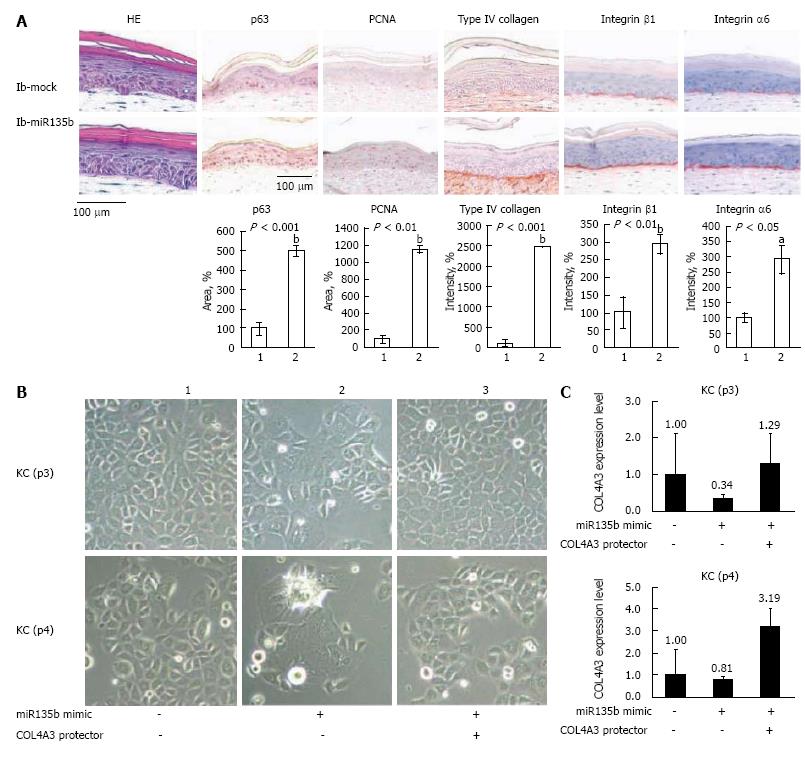
Figure 2 The inhibition of miR135b prolongs the stemness and proliferative potential of epidermal keratinocytes in skin equivalents models.
A: Histology of skin equivalent (SE) models constructed with ib-mock-transfected or ib-miR135b-transfected keratinocytes, and immunohistochemical staining of these models for p63, proliferating cell nuclear antigen, type IV collagen, and integrin β1, and integrin α6. Expression levels of p63, PCNA, type IV collagen, integrin β1, and integrin α6 were increased in SEs generated from ib-miR135b-transfected cells; 1: ib-mock; 2: ib-miR135b; B: Fast-forward co-transfection of keratinocytes with ‘‘miRNA mimic’’ and ‘‘target protector’’. 1: Negative control of miRNA mimic (10 nmol/L) and negative control of target protector (500 nmol/L); 2: miRNA mimic (10 nmol/L) and negative control of target protector (500 nmol/L); 3: MiRNA mimic and target protector (500 nmol/L). The inhibition of miR135b increases proliferation of keratinocyte via targeting type IV collagen; C: Real-time PCR analysis of gene expression in co-transfected keratinocytes. The housekeeping gene glyceraldehyde-3-phosphate dehydrogenase was used as an endogenous control. The result was same as (B). HE: Hematoxylin and eosin.
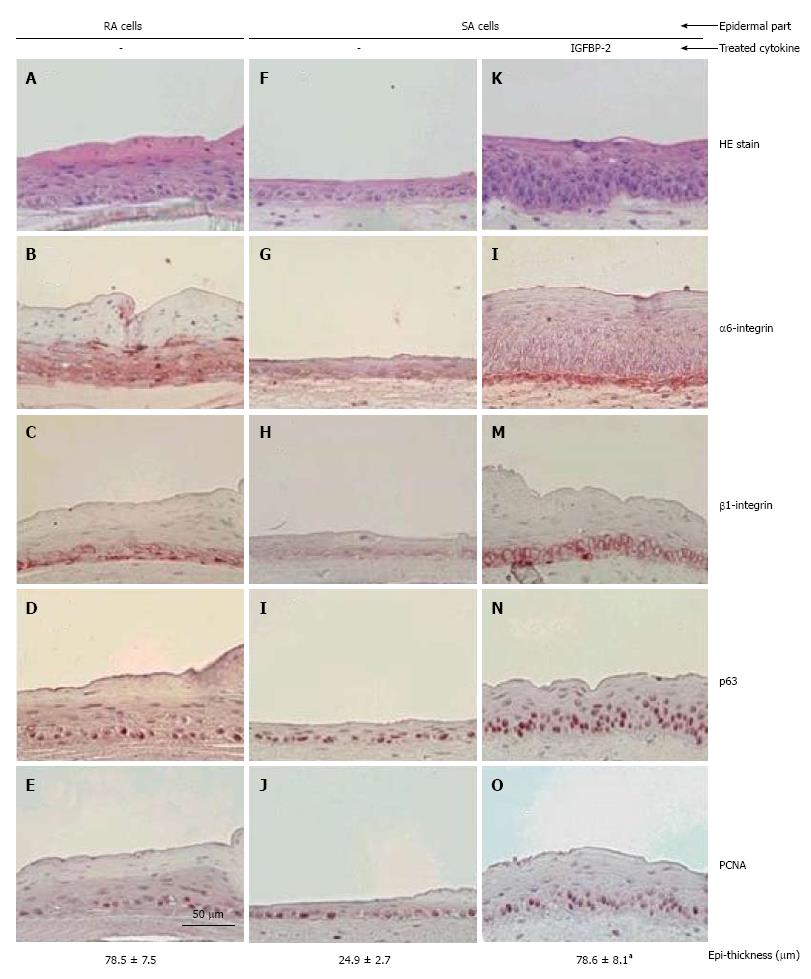
Figure 3 Effects of IGFBP-2 on skin equivalents reconstruction.
Skin equivalents (SEs) were cultured with rapidly adhering (RA) cells (A-E) or slowly adhering (SA) cells (F-O). Sections of SEs cultured under different treatments [media only (A-J) and 200 ng/mL IGFBP-2 (K-O)] and stained for hematoxylin and eosin (HE) (A, F, K), α6 integrin (B, G, L), β1 integrin (C, H, M), p63 (D, I, N), and proliferating cell nuclear antigen or proliferating cell nuclear antigen (PCNA) (E, J, O). Addition of IGFBP-2 to culture media increased the expression levels of α6 integrins, β1 integrins, p63, and PCNA in cultured keratinocytes. Original magnification 400 ×. Epidermal thickness was measured at 10 randomly selected locations using an Olysia Soft Imaging System (Olympus). Statistical analysis was performed using the Student’s t-test. aP < 0.01 vs SA + no cytokine model.
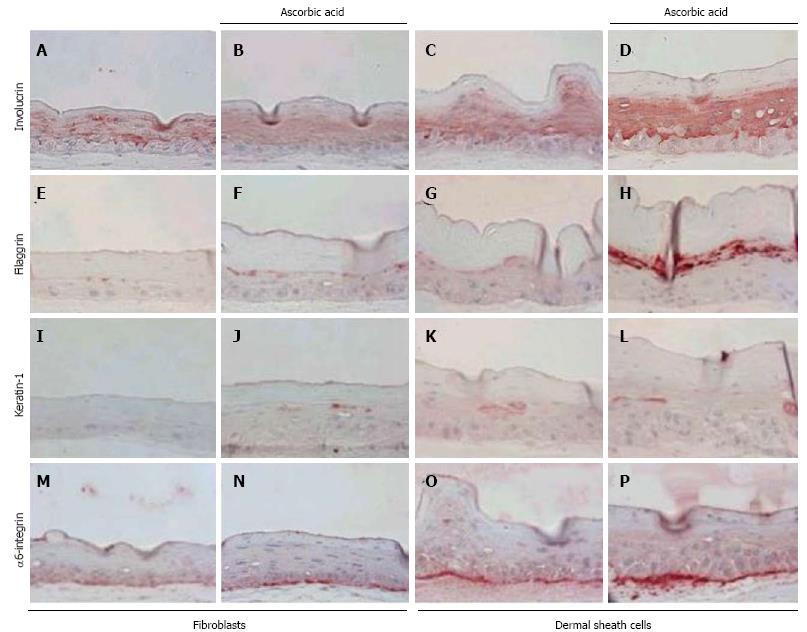
Figure 4 Immunohistochemical staining for involucrin, filaggrin, keratin 1, and α6 integrin in skin equivalents generated from fibroblasts or dermal sheath cells.
Sections of skin equivalents (SEs) produced using fibroblasts (A, B, E, F, I, J, M, and N) or dermal sheath cells (C, D, G, H, K, L, O, and P) were stained for involucrin (A-D), filaggrin (E-H), keratin 1 (I-L), and α6 integrin (M-P). SEs were cultured in complete medium in the presence (B, D, F, H, J, L, N, and P) or absence (A, C, E, G, I, K, M, and O) of ascorbic acid. Expression of involucrin, filaggrin, keratin 1, and α6 integrin was up-regulated in SEs of dermal sheath cells compared with SEs of fibroblasts. Original magnification: 400 × (A-P).
- Citation: Choi HR, Byun SY, Kwon SH, Park KC. Niche interactions in epidermal stem cells. World J Stem Cells 2015; 7(2): 495-501
- URL: https://www.wjgnet.com/1948-0210/full/v7/i2/495.htm
- DOI: https://dx.doi.org/10.4252/wjsc.v7.i2.495


