Copyright
©The Author(s) 2015.
World J Stem Cells. Jan 26, 2015; 7(1): 37-50
Published online Jan 26, 2015. doi: 10.4252/wjsc.v7.i1.37
Published online Jan 26, 2015. doi: 10.4252/wjsc.v7.i1.37
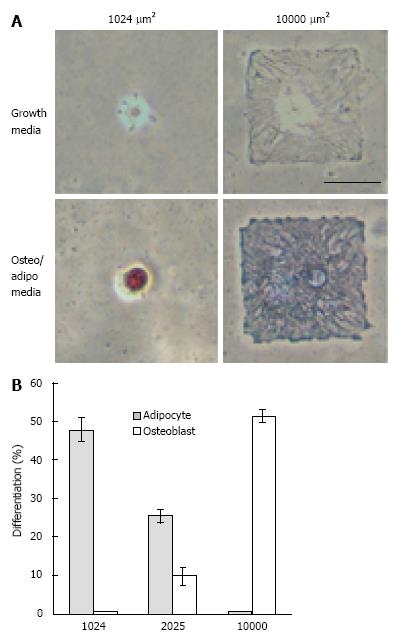
Figure 1 The effect of nanotopographies on stem cell shape and its consequential effect on the differentiation of stem cells.
A: Brightfield images of human mesenchymal stem cells (hMSCs) plated onto small (1024 μm2) or large (10000 μm2) fibronectin islands after 1 wk in growth or mixed media. Note hMSCs plated on large islands showed differentiation for osteogenic differentiation and those on small islands showed differentiation for adipogenic differentiation. Lipids stain red; alkaline phosphatase stains blue. Scale bar = 50 μm; B: Percentage differentiation of hMSCs plated onto 1024, 2025, or 10000 μm2 islands after 1 wk of culture in mixed media. Taken with permission from McBeath R, Pirone DM, Nelson CM, Bhadriraju K, Chen CS. Cell shape, cytoskeletal tension and RhoA regulate stem cell lineage commitment. Dev Cell 2004; 6: 483-495.
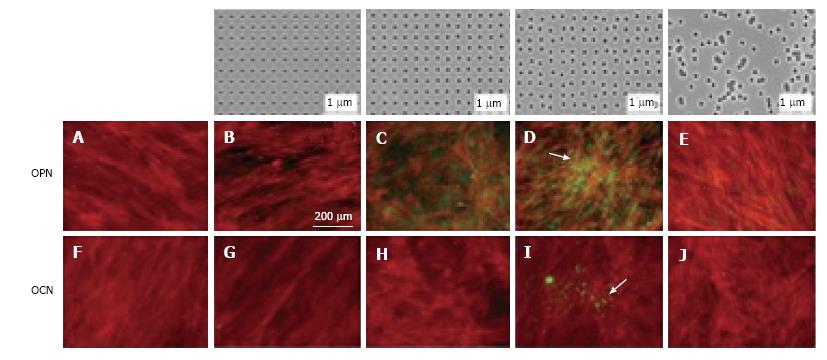
Figure 2 The effect of nanopits on the differentiation of stem cells.
The top row showed the nanotopographies produced using electron beam lithography. All have 120 nm diameter pits (100 nm deep, absolute or average 300 nm centre-centre spacing) with square (B, G), displaced square 20 (± 20 nm from true centre), (C, H), displaced square 50 (± 50 nm from true centre) (D,I) and random placements (E, J). There is lack of positive staining for osteocalcin (OCN) and osteopontin (OPN) on control nanotopographies (A, F) but good positive staining for expression for OPN and OCN for cells grown on displaced square 50 nanotopographies (D, I). Actin = red, OPN/OCN = green. Taken with permission from Dalby MJ, Gadegaard N, Tare R, Andar A, Riehle MO, Herzyk P, Wilkinson CD, Oreffo RO. The control of human mesenchymal cell differentiation using nanoscale symmetry and disorder. Nat Mater 2007; 6: 997-1003.
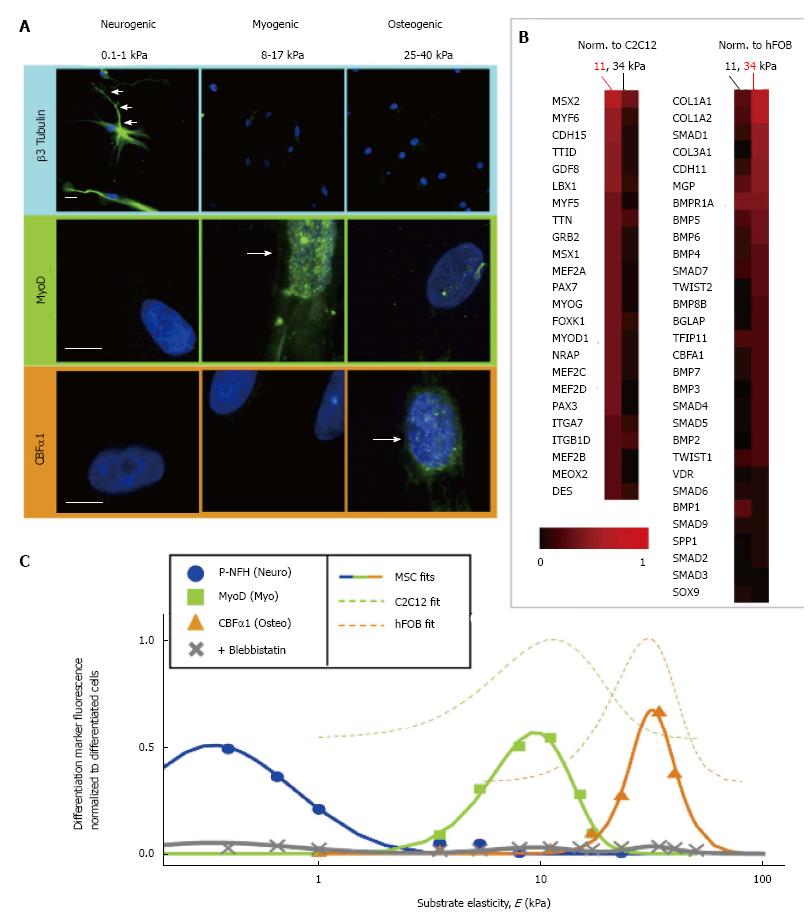
Figure 3 Effect of substrate stiffness on the differentiation of stem cells.
A: The neuronal cytoskeletal marker β3 tubulin is expressed in branches (arrows) of initially naive mesenchymal stem cells (MSCs) (> 75%) and only on the soft, neurogenic matrices. The muscle transcription factor MyoD1 is upregulated and nuclear localised (arrow) on myogenic matrices and osteoblast transcription factor CBF-α1 (arrow) is expressed only on stiff, osteogenic gels. Scale bar is 5 μm; B: The microarray profiles of MSCs cultured on 11 or 34 kPa matrices. The expression was normalised first to actin and then to expression of committed C2C12 myoblasts and hFOB osteoblasts; C: The highest fluorescent intensity of differentiation markers was observed at the substrate elasticity of the elastic modulus typical of each tissue type. Taken with permission from Engler AJ, Sen S, Sweeney HL, Discher DE. Matrix elasticity directs stem cell lineage specification. Cell 2006; 126: 677-689.
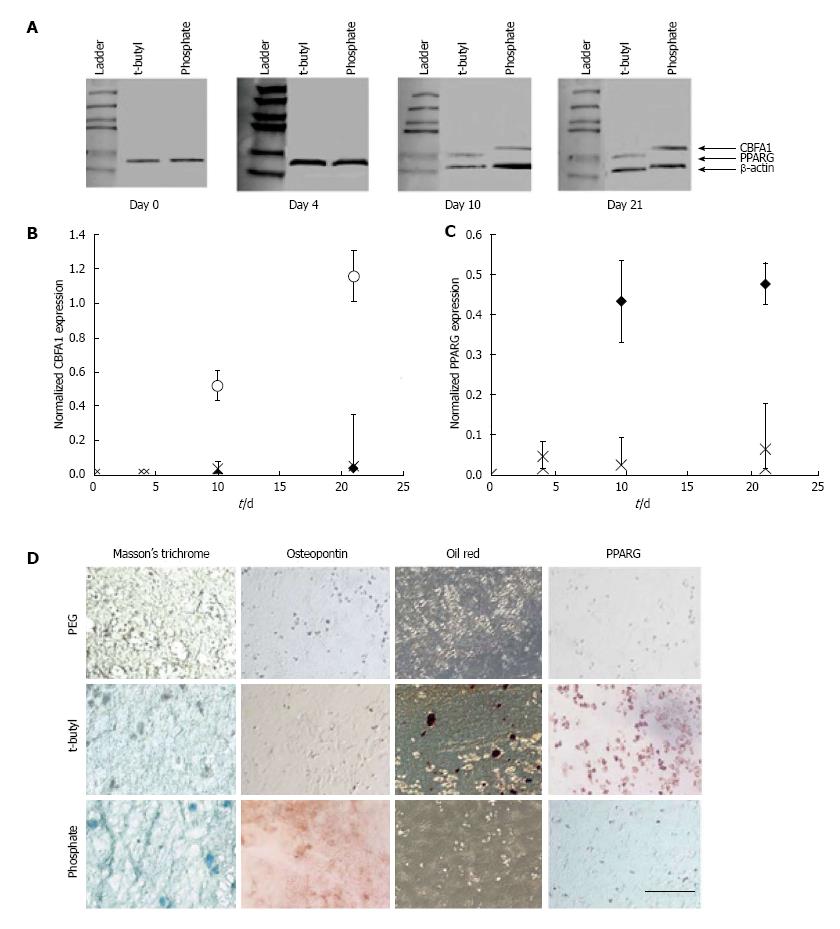
Figure 4 Effect of surface chemical functional groups on the differentiation of stem cells.
Encapsulation of human mesenchymal stem cells (hMSCs) in phosphate and t-butyl functionalised polyethylene glycol hydrogels affected the CBFA1 and PPARG expression. A: CBFA1, PPARG, and β-actin expression of hMSCs encapsulated in control, t-butyl, and phosphate-functionalised PEG hydrogels was performed. Immunoblots were quantified with ImageJ software and CBFA1 (B) and PPARG (C) expression levels over the 21-d culture period were normalised to β-actin expression; D: Differentiation was confirmed using Masson’s trichrome stains collagen blue (left column) and Oil Red stains intracellular lipid deposits red (third column). (bar = 100 μm). Taken with permission from Benoit DS, Schwartz MP, Durney AR, Anseth KS. Small functional groups for controlled differentiation of hydrogel-encapsulated human mesenchymal stem cells. Nat Mater 2008; 7: 816-823.
- Citation: Griffin MF, Butler PE, Seifalian AM, Kalaskar DM. Control of stem cell fate by engineering their micro and nanoenvironment. World J Stem Cells 2015; 7(1): 37-50
- URL: https://www.wjgnet.com/1948-0210/full/v7/i1/37.htm
- DOI: https://dx.doi.org/10.4252/wjsc.v7.i1.37


