Copyright
©2013 Baishideng Publishing Group Co.
World J Stem Cells. Apr 26, 2013; 5(2): 53-60
Published online Apr 26, 2013. doi: 10.4252/wjsc.v5.i2.53
Published online Apr 26, 2013. doi: 10.4252/wjsc.v5.i2.53
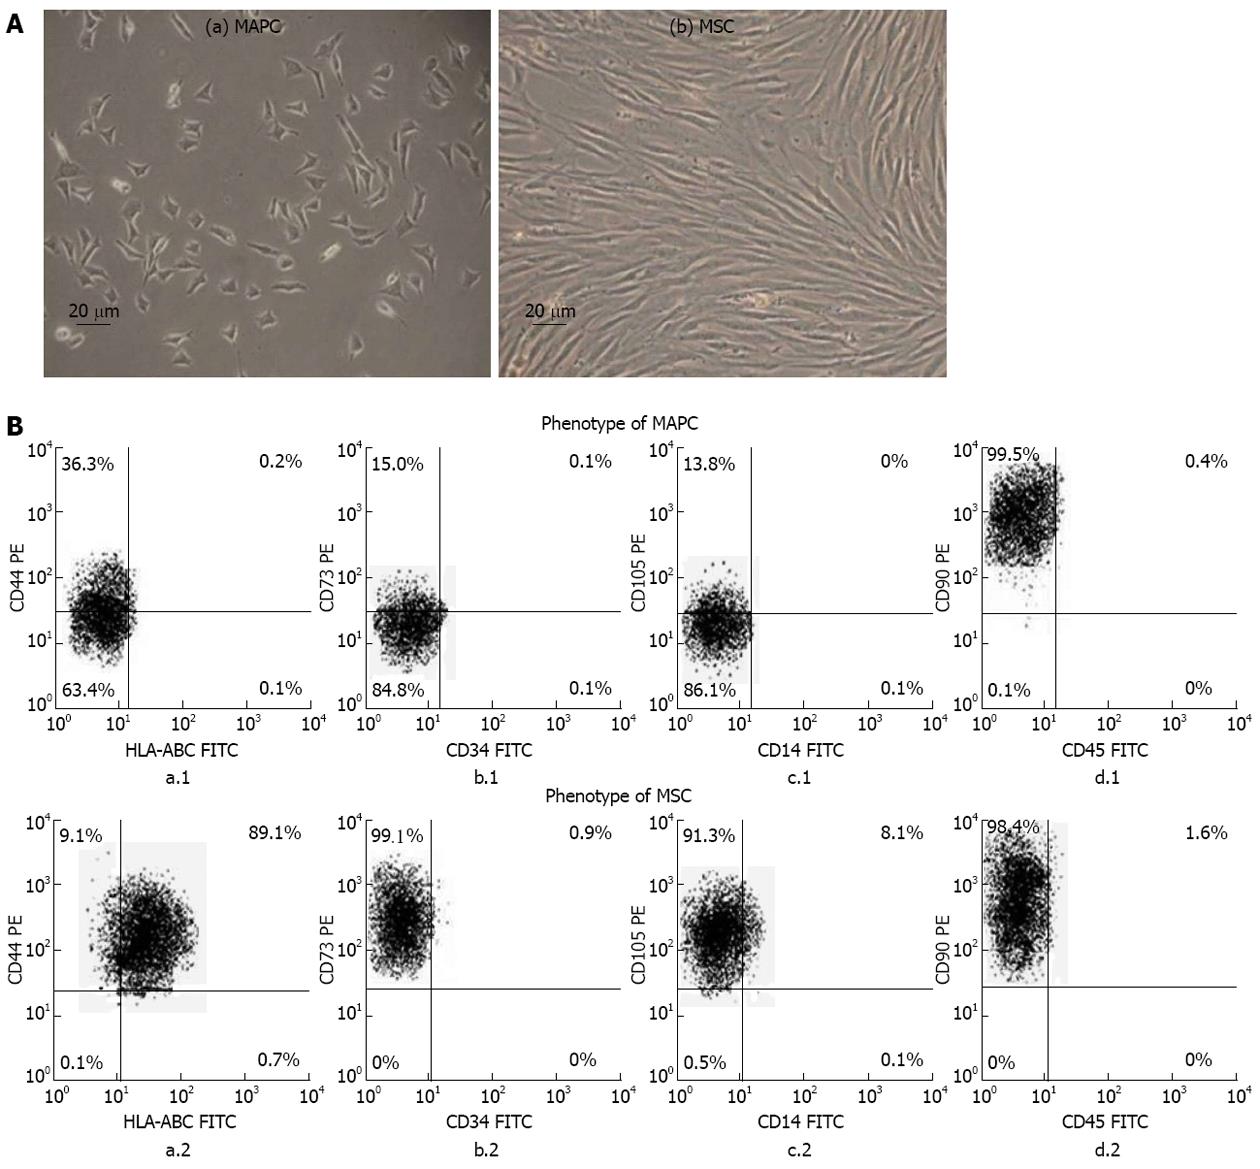
Figure 1 Morphology and phenotypic markers of multipotent adult progenitor cells and mesenchymal stem cells.
A: Representative photomicrographs (×10, 20 μm) of primary cultures showing (a) small trigonal morphology of multipotent adult progenitor cells (MAPC) and (b) large spindle shaped morphology of mesenchymal stem cells (MSC); B: Representative flow-cytometric dot-plots showing expression of (a.1 and a.2) HLA-ABC (FITC)/CD44 (PE), (b.1 and b.2) CD34 (FITC)/CD73 (PE), (c.1 and c.2) CD14 (FITC)/CD105 (PE), and (d.1 and d.2) CD45 (FITC)/CD90 (PE) on MAPC and MSC, respectively. FITC: Fluorescein isothiocyanate; PE: Phycoerythrin.
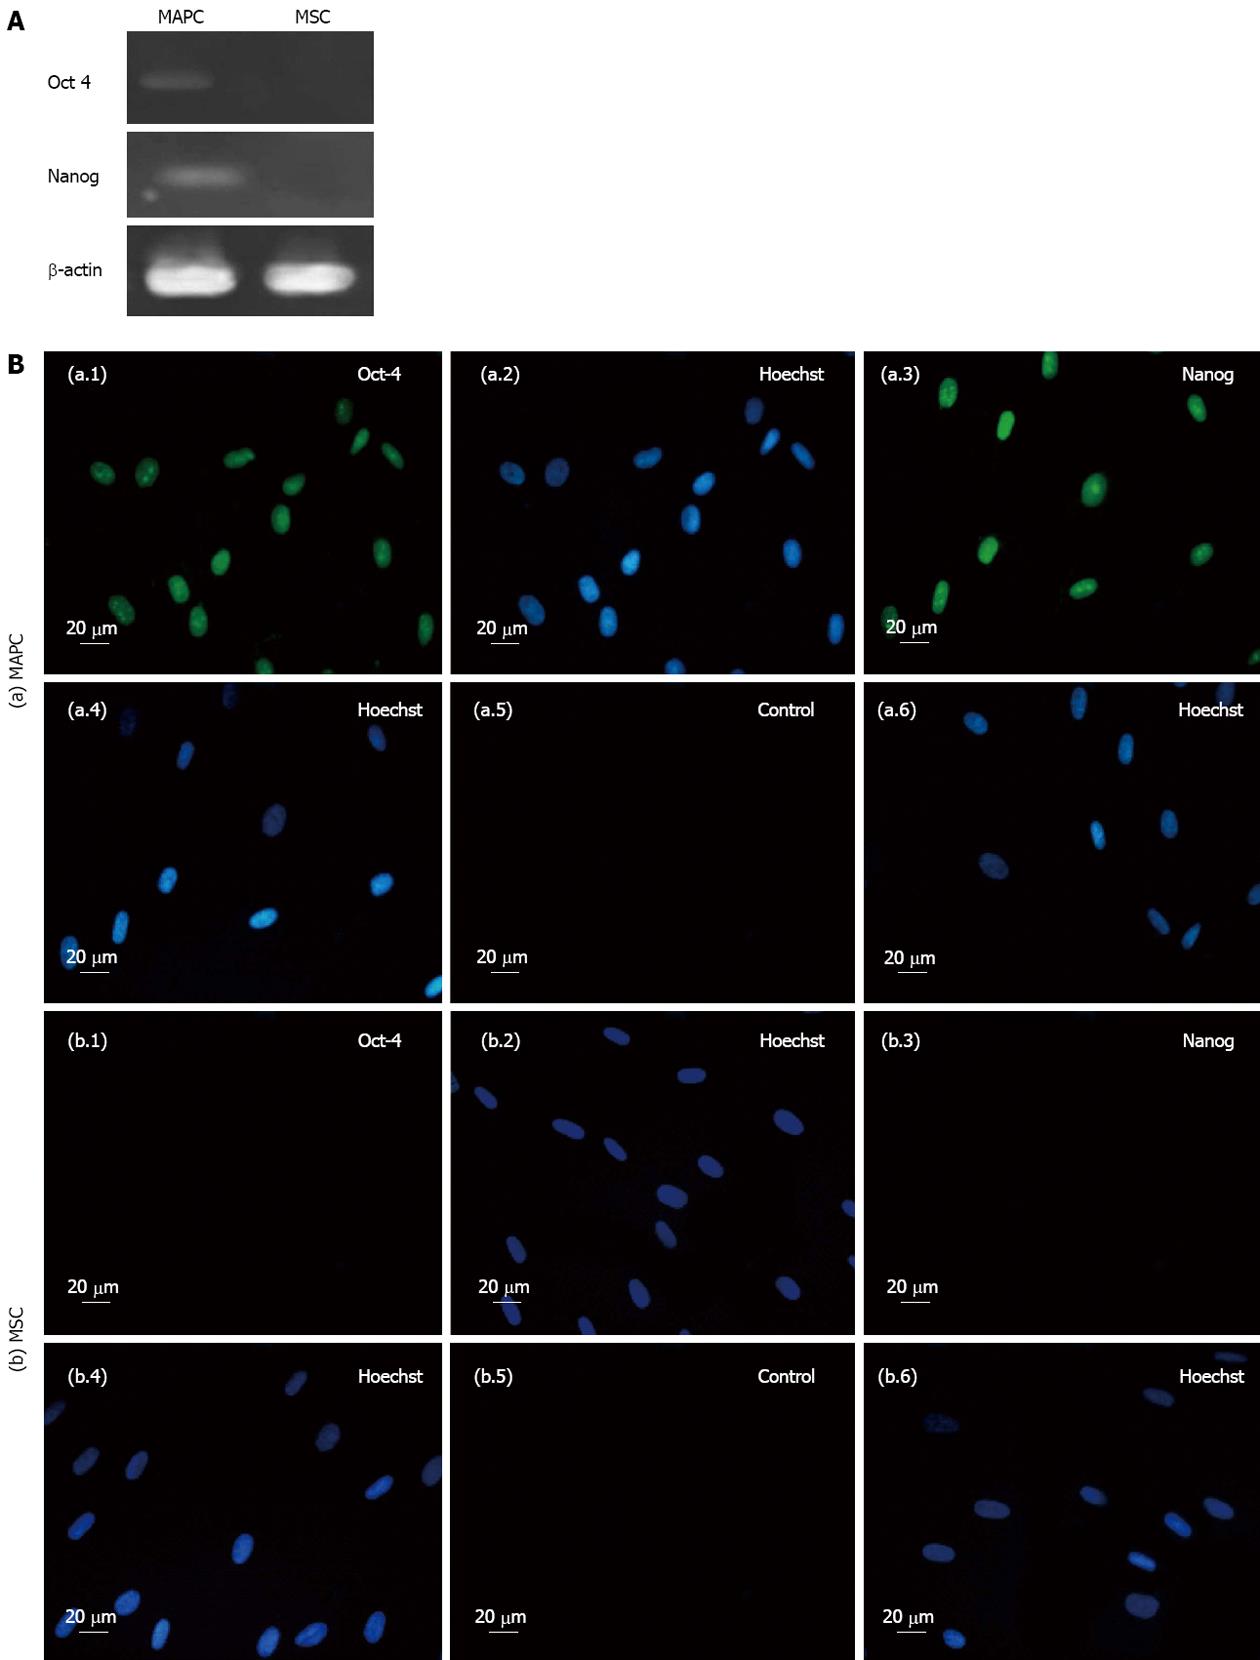
Figure 2 Expression of embryonic markers by multipotent adult progenitor cells and by mesenchymal stem cells.
A: Expression of Oct-4 and Nanog genes in multipotent adult progenitor cells (MAPC) and no expression of these genes in mesenchymal stem cells (MSC) as revealed by reverse-transcription polymerase chain reaction. β-actin represents the house keeping gene; B: Representative Immunocytochemistry photomicrographs (×40, 20 μm) of (a) MAPC showing fluorescein isothiocyanate (FITC) and Hoechst staining for Oct-4 (a.1 and a.2, respectively), Nanog (a.3 and a.4, respectively) and of controls, i.e., cells with no primary antibody (a.5 and a.6, respectively); and (b) MSC showing FITC and Hoechst staining for Oct-4 (b.1 and b.2, respectively) and Nanog (b.3 and b.4, respectively) and of controls, i.e., cells with no primary antibody (b.5 and b.6, respectively).
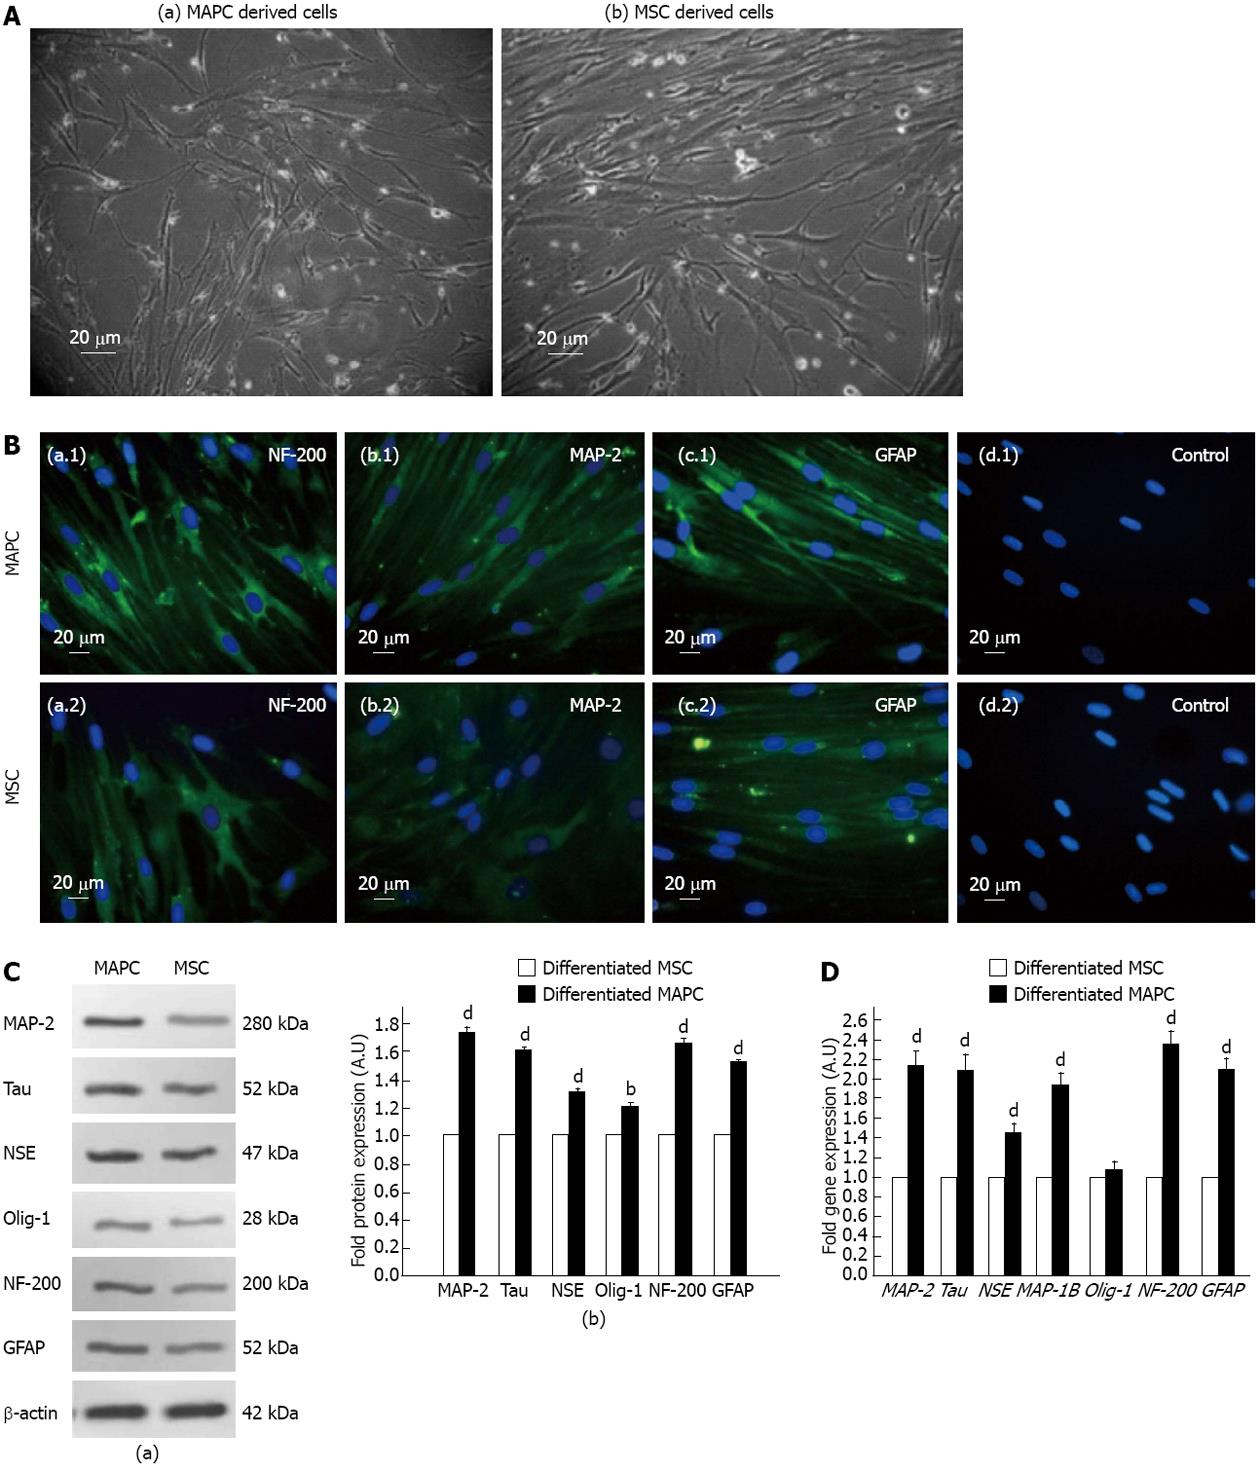
Figure 3 Neural differentiation potential of multipotent adult progenitor cells and of mesenchymal stem cell.
A: Representative photomicrographs (×10, 20 μm) of neuronal cells differentiated from (a) multipotent adult progenitor cells (MAPC), and (b) mesenchymal stem cell (MSC); B: Representative immunocytochemical photomicrographs (×40, 20 μm) showing an overlay of fluorescein isothiocyanate (FITC) and Hoechst staining for (a.1 and a.2) neuronal filament-200 (NF-200), (b.1 and b.2) microtubule-associated protein 2 (MAP-2), and (c.1 and c.2) fibrillar acidic protein (GFAP) expression in neuronal cells differentiated from MAPC and MSC, respectively. Negative control represents cells with no treatment with neurogenic medium (d.1) MAPC and (d.2) MSC; C: Immunoblots analysis of neural proteins in MAPC and MSC derived neuronal cells. (a) Representative immunoblots of MAP-2, Tau, neuron-specific enolase (NSE), oligodendrocyte-1 (Olig-1), NF-200 and GFAP proteins in MAPC and MSC derived neuronal cells; (b) Error-bar diagrams showing fold change expression of proteins in MAPC (solid bars) and MSC (open bars) derived neuronal cells as revealed by densitometric quantification of immunoblots. bP < 0.01, dP < 0.001 vs MSC group; D: Error-bar diagrams showing expression of MAP-2, Tau, NSE, MAP-1B, Olig-1, NF-200 and GFAP genes in MAPC (solid bars) and MSC (open bars) derived neuronal cells as revealed by real-time quantitative polymerase chain reaction. The values of MSC and MAPC treated with neurogenic medium and their untreated counterparts were normalized to housekeeping glyceraldehyde-3-phosphate dehydrogenase and the fold increase values of MAPC compared to MSC have been expressed as mean ± SE, bP < 0.001 vs MSC group.
- Citation: Singh SP, Tripathy NK, Nityanand S. Comparison of phenotypic markers and neural differentiation potential of multipotent adult progenitor cells and mesenchymal stem cells. World J Stem Cells 2013; 5(2): 53-60
- URL: https://www.wjgnet.com/1948-0210/full/v5/i2/53.htm
- DOI: https://dx.doi.org/10.4252/wjsc.v5.i2.53


