Copyright
©2012 Baishideng.
World J Stem Cells. Oct 26, 2012; 4(10): 101-109
Published online Oct 26, 2012. doi: 10.4252/wjsc.v4.i10.101
Published online Oct 26, 2012. doi: 10.4252/wjsc.v4.i10.101
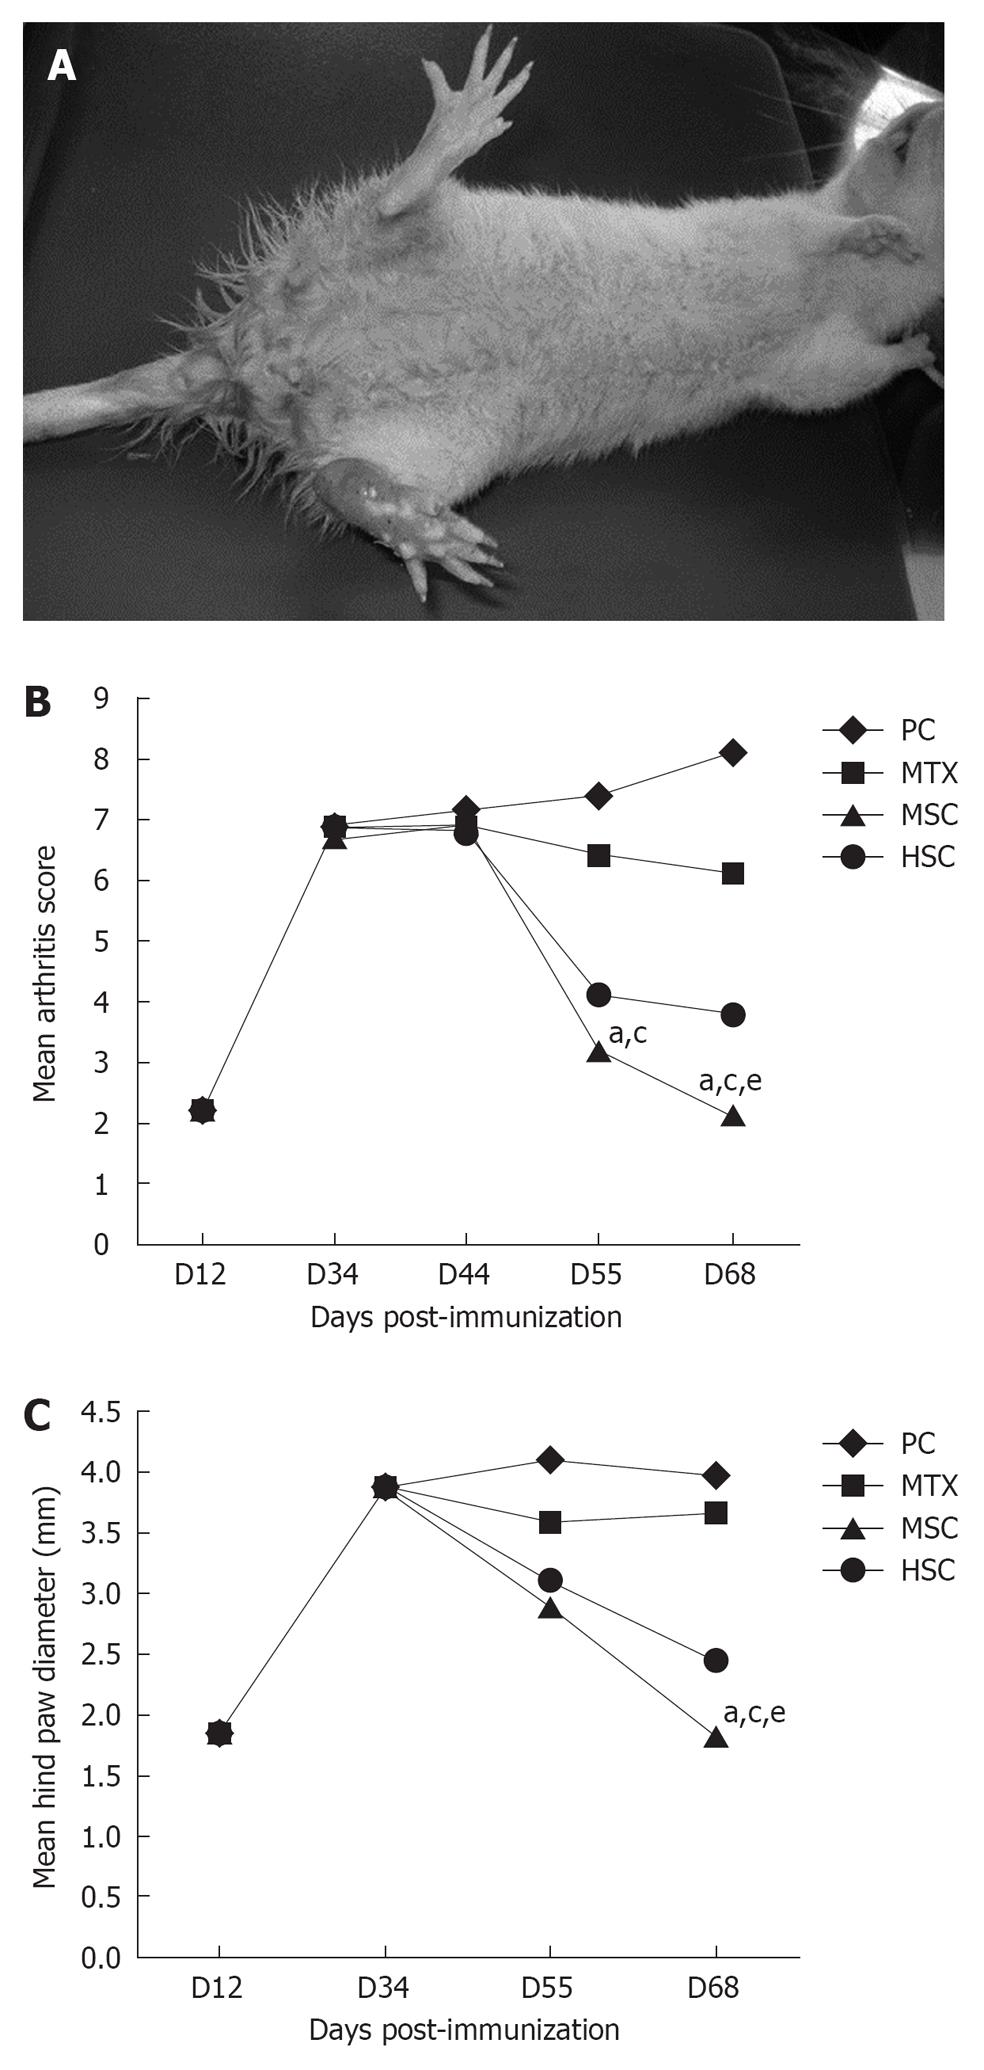
Figure 1 Decreased severity of complete freunds adjuvant induced arthritis after treatment with human umbilical cord blood-derived mesenchymal stem cells.
A: compares the gross appearance of a normal rat hindpaw and a fully ankylosed hindpaw from a complete freunds adjuvant (CFA)-immunized rat at day 34; B: Rats with established CFA injected intra-articular with 5 μL sterile saline, 0.9% PBS in positive control (PC), 1 × 10⁶ mesenchymal stem cell (MSC) in MSC group and 1 × 10⁶ hematopoietic stem cell in hematopoietic (CD34+) stem cell (HSC) group and 0.3 mg/kg twice a week for 5 wk in methotrexate (MTX) group. Arthritis severity was assessed by clinical scoring at day 12, 34, 44, 55, 68 post-immunization with CFA; C: mean hind paw diameter was determined at day 12, 34, 44, 55, 68 post immunization with CFA. aP < 0.05 MSC vs control, cP < 0.05 MSC vs MTX group; eP < 0.05 MSC vs HSC group.
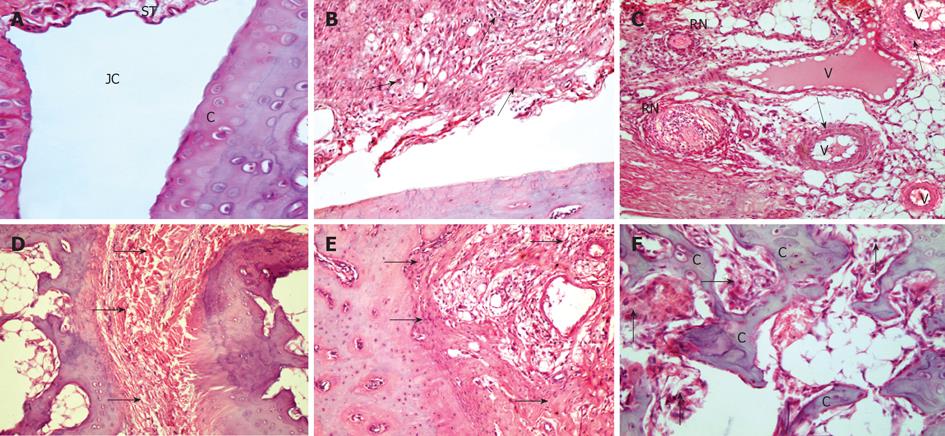
Figure 2 Photomicrograph of rat.
A: Negative control group showed intact articular cartilage (C) with normal joint cavity (JC) and synovial tissue (ST) (HE, × 400); B: Photomicrograph of a rat from positive control group showed that hypertrophy and massive mononuclear cell infiltration of the synovial tissue; C: Hypervascularity, congestion, mononuclear cells infiltration (arrows) within vessels (V) wall and rheumatoid nodules (RN); D, E: Inflammatory granulation tissue (arrows) completely obliterated the joint space and; F: Inflammatory granulation tissue (arrows) eroded the articular cartilage (C) and subchondral bone. HE, × 200.
Figure 3 Photomicrograph of rat from methotrexate group (A), CD34 group (B) and mesenchymal group (C).
A: Reduction of leucocytic infiltrate and hypertrophy of the synovial tissue (arrows) with moderate obliteration of joint cavity (JC); B: Reduction of leucocytic infiltrate and hypertrophy of the synovial tissue (arrows) with mild obliteration of JC; C: Reduction of leucocytic infiltrate and hypertrophy of the synovial tissue (arrows) with mild obliteration of JC. HE, × 200.
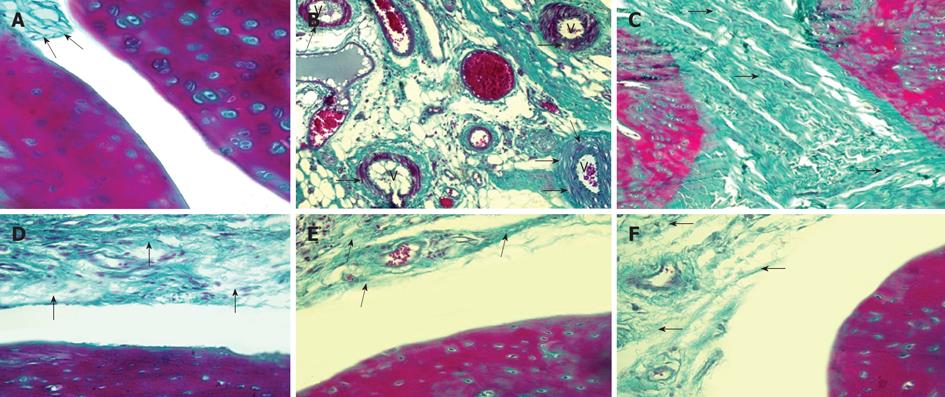
Figure 4 Photomicrograph of rat from negative control group (A), positive control group (B), positive control group (C), methotrexate group (D), CD34 group (E) and mesenchymal group (F).
A: Negative control group showed synovial tissue with delicate collagen fibers (arrows) (Masson’s trichrome, × 400); B: Positive control (PC) group showed vascular edema and vacuoles (arrows) within vessels (V) of the synovial tissue (Masson’s trichrome × 200); C: PC group showed extensive fibrosis (arrows) completely obliterating the joint cavity (Masson’s trichrome, × 200); D: Methotrexate group showed moderate increase in collagen fibers (arrows) of the synovial tissue (Masson’s trichrome, × 200); E: CD34 group showed mild increase in collagen fibers (arrows) of the synovial tissue (Masson’s trichrome, × 200); F: Mesenchymal group showed mild increase in collagen fibers (arrows) of the synovial tissue (Masson’s trichrome, × 200).
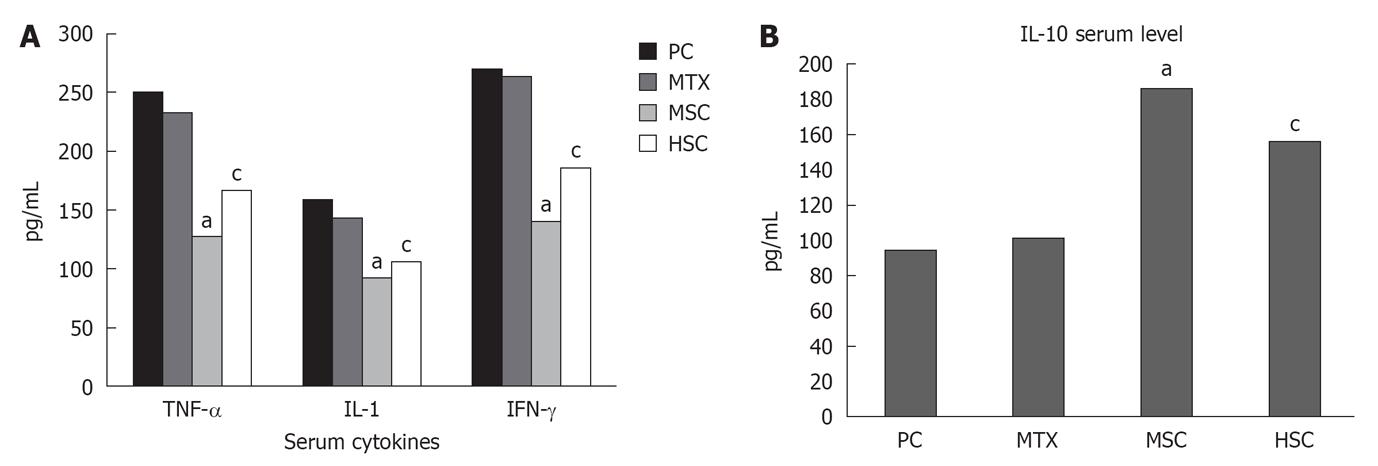
Figure 5 Inhibition of inflammatory responses in rats with complete freunds adjuvant induced arthritis after treatment with human umbilical cord blood-derived mesenchymal stem cells.
A: Levels of tumor necrosis factor (TNF)-α, interleukin (IL)-1, and interferon (IFN)-γ in the sera of rats in positive control (PC) group, methotrexate (MTX) group, mesenchymal stem cell (MSC) group and hematopoietic (CD34+) stem cell (HSC) group obtained on day 34; B: Serum level of IL-10 obtained from different groups on day 34. aP < 0.05 MSC vs control and MTX groups; cP < 0.05 HSC vs control and MTX groups.
- Citation: Greish S, Abogresha N, Abdel-Hady Z, Zakaria E, Ghaly M, Hefny M. Human umbilical cord mesenchymal stem cells as treatment of adjuvant rheumatoid arthritis in a rat model. World J Stem Cells 2012; 4(10): 101-109
- URL: https://www.wjgnet.com/1948-0210/full/v4/i10/101.htm
- DOI: https://dx.doi.org/10.4252/wjsc.v4.i10.101


