Copyright
©2011 Baishideng Publishing Group Co.
World J Stem Cells. Jul 26, 2011; 3(7): 63-69
Published online Jul 26, 2011. doi: 10.4252/wjsc.v3.i7.63
Published online Jul 26, 2011. doi: 10.4252/wjsc.v3.i7.63
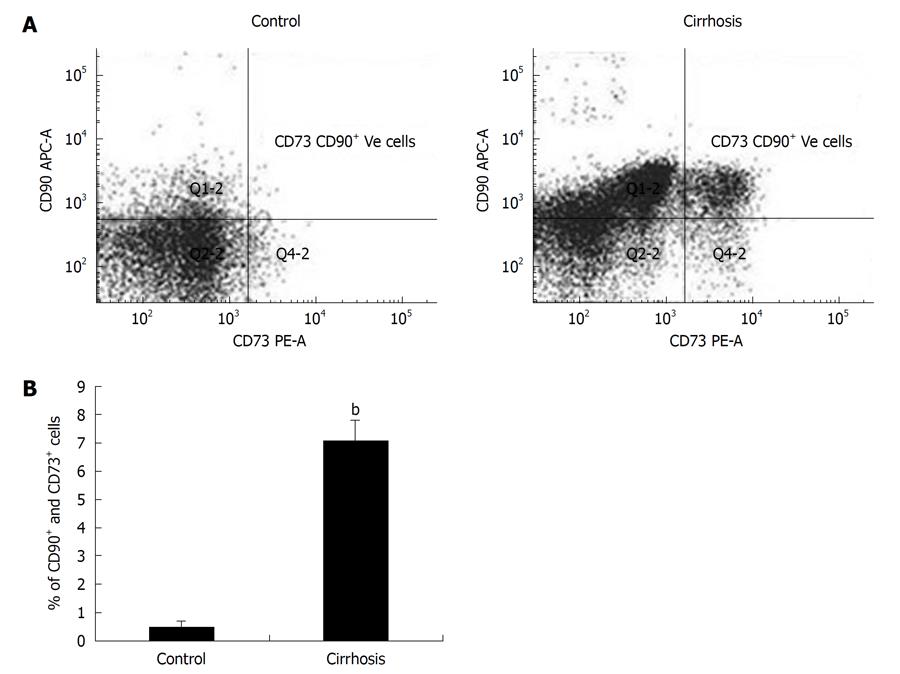
Figure 1 Flow cytometry of CD90+ CD73+ CD45- cells in peripheral blood cultures.
CD90+, CD73+ CD45- cells in peripheral blood of control and cirrhosis cultures detected by flow cytometry. After 14 d cultured cells were stained with anti CD90, anti CD73 antibodies and analyzed on FACS Aria II. A: depicts increased number of CD90+, CD73+ cells in cultures of cirrhosis patients (7.09%) (P < 0.001) compared with controls (0.48%); B: Quantitative representation of the cells in cultures.bP < 0.001.
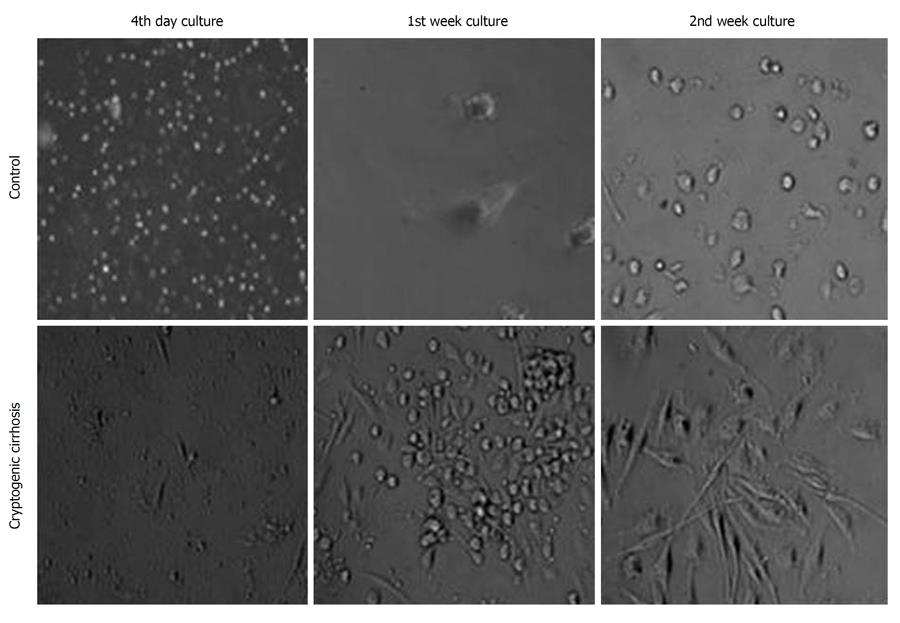
Figure 2 Morphological features of cells in cultures.
Morphological features of cells in culture from cirrhosis patients. At day 4 spindle shaped cells were observed in cirrhosis but not in control.
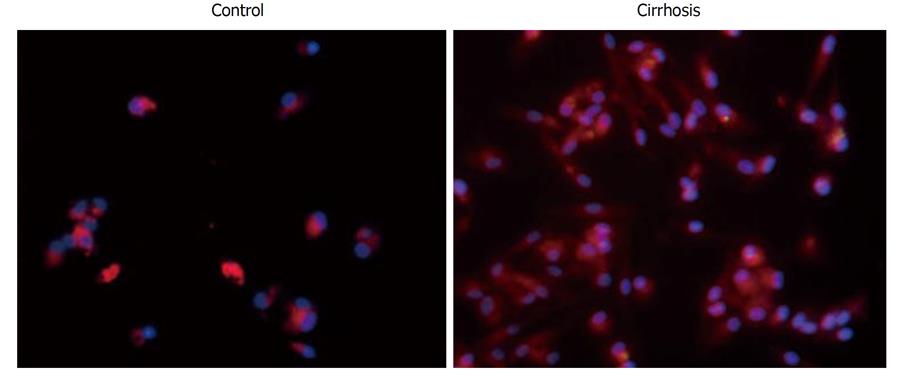
Figure 3 Immunocytochemistry of cells in cultures.
The cells from control and cirrhosis cultures were immuno-stained with anti CD90 (APC) antibody, immunofluorescent images were captured at 400 × magnification. The cells showed the presence of CD90 (stained in red) and nuclei stained blue.
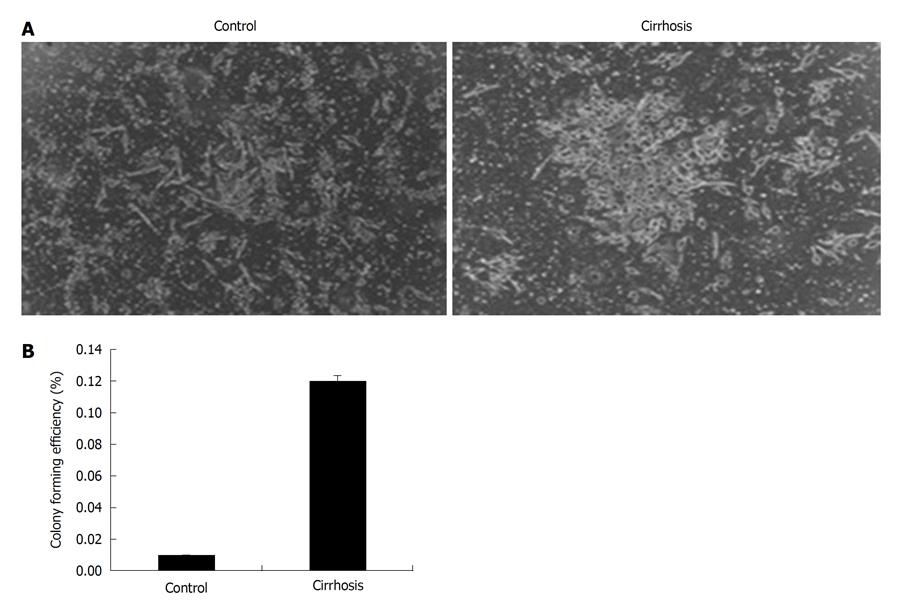
Figure 4 Colony forming efficiency of cultured cells.
A: Cells from control and cirrhosis patients were stained with crystal violet to locate colonies. Colony forming efficiency (CFE) was observed in cirrhosis patients; B: Quantitative representation of colony forming efficiency of cultured cells. There was 12 fold increase in CFE of cirrhosis when compared to control cultures.
- Citation: Sasikala M, Surya P, Radhika G, Kumar PP, Rao MS, Mukherjee RM, Rao PN, Reddy DN. Identification of circulating CD90+ CD73+ cells in cirrhosis of liver. World J Stem Cells 2011; 3(7): 63-69
- URL: https://www.wjgnet.com/1948-0210/full/v3/i7/63.htm
- DOI: https://dx.doi.org/10.4252/wjsc.v3.i7.63


