Copyright
©2010 Baishideng.
World J Stem Cells. Apr 26, 2010; 2(2): 24-33
Published online Apr 26, 2010. doi: 10.4252/wjsc.v2.i2.24
Published online Apr 26, 2010. doi: 10.4252/wjsc.v2.i2.24
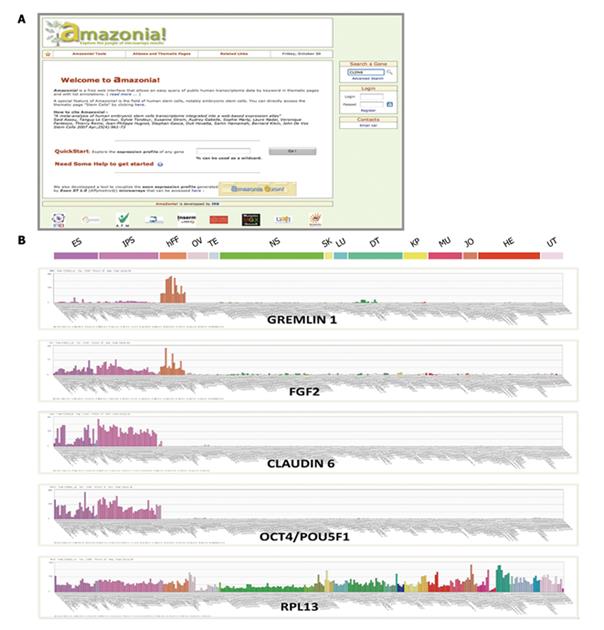
Figure 1 Visualization of gene expression in PSCs and comparison with somatic cells.
A: The Amazonia! web Atlas interface (http://www.amazonia.transcriptome.eu); B: Expression bar plots, generated with Amazonia!, for RPL13, a ubiquitously expressed gene, OCT4/POU5F1 and CLAUDIN 6 as highly PSC-specific genes, FGF2, a major human PSC growth factor expressed as an autocrine loop and by human fibroblast cells, and GREMLIN 1, an inhibitor of BMPs secreted by human fibroblast feeder cells. ES: Human embryonic stem cells; iPS cells: Induced pluripotent stem cells; hFF: Human foreskin fibroblasts; OV: Ovary & oocytes samples; TE: Testis; NS : Nervous system; SK: Skin; LU: Normal lung; DT: Digestive tract; KP: Kidney & prostate; HM: Heart & muscle; JO: Joint; HE: Normal hematological samples; UT: Uterus; PSCs: Pluripotent stem cells. Y-axis is the microarray signal value, obtained by MAS5 normalization with a TGT at 100 using Expression Console (Affymetrix, Santa-Clara, CA).
- Citation: Ramirez JM, Bai Q, Dijon-Grinand M, Assou S, Gerbal-Chaloin S, Hamamah S, Vos JD. Human pluripotent stem cells: From biology to cell therapy. World J Stem Cells 2010; 2(2): 24-33
- URL: https://www.wjgnet.com/1948-0210/full/v2/i2/24.htm
- DOI: https://dx.doi.org/10.4252/wjsc.v2.i2.24


