Copyright
©The Author(s) 2022.
World J Stem Cells. Aug 26, 2022; 14(8): 633-657
Published online Aug 26, 2022. doi: 10.4252/wjsc.v14.i8.633
Published online Aug 26, 2022. doi: 10.4252/wjsc.v14.i8.633
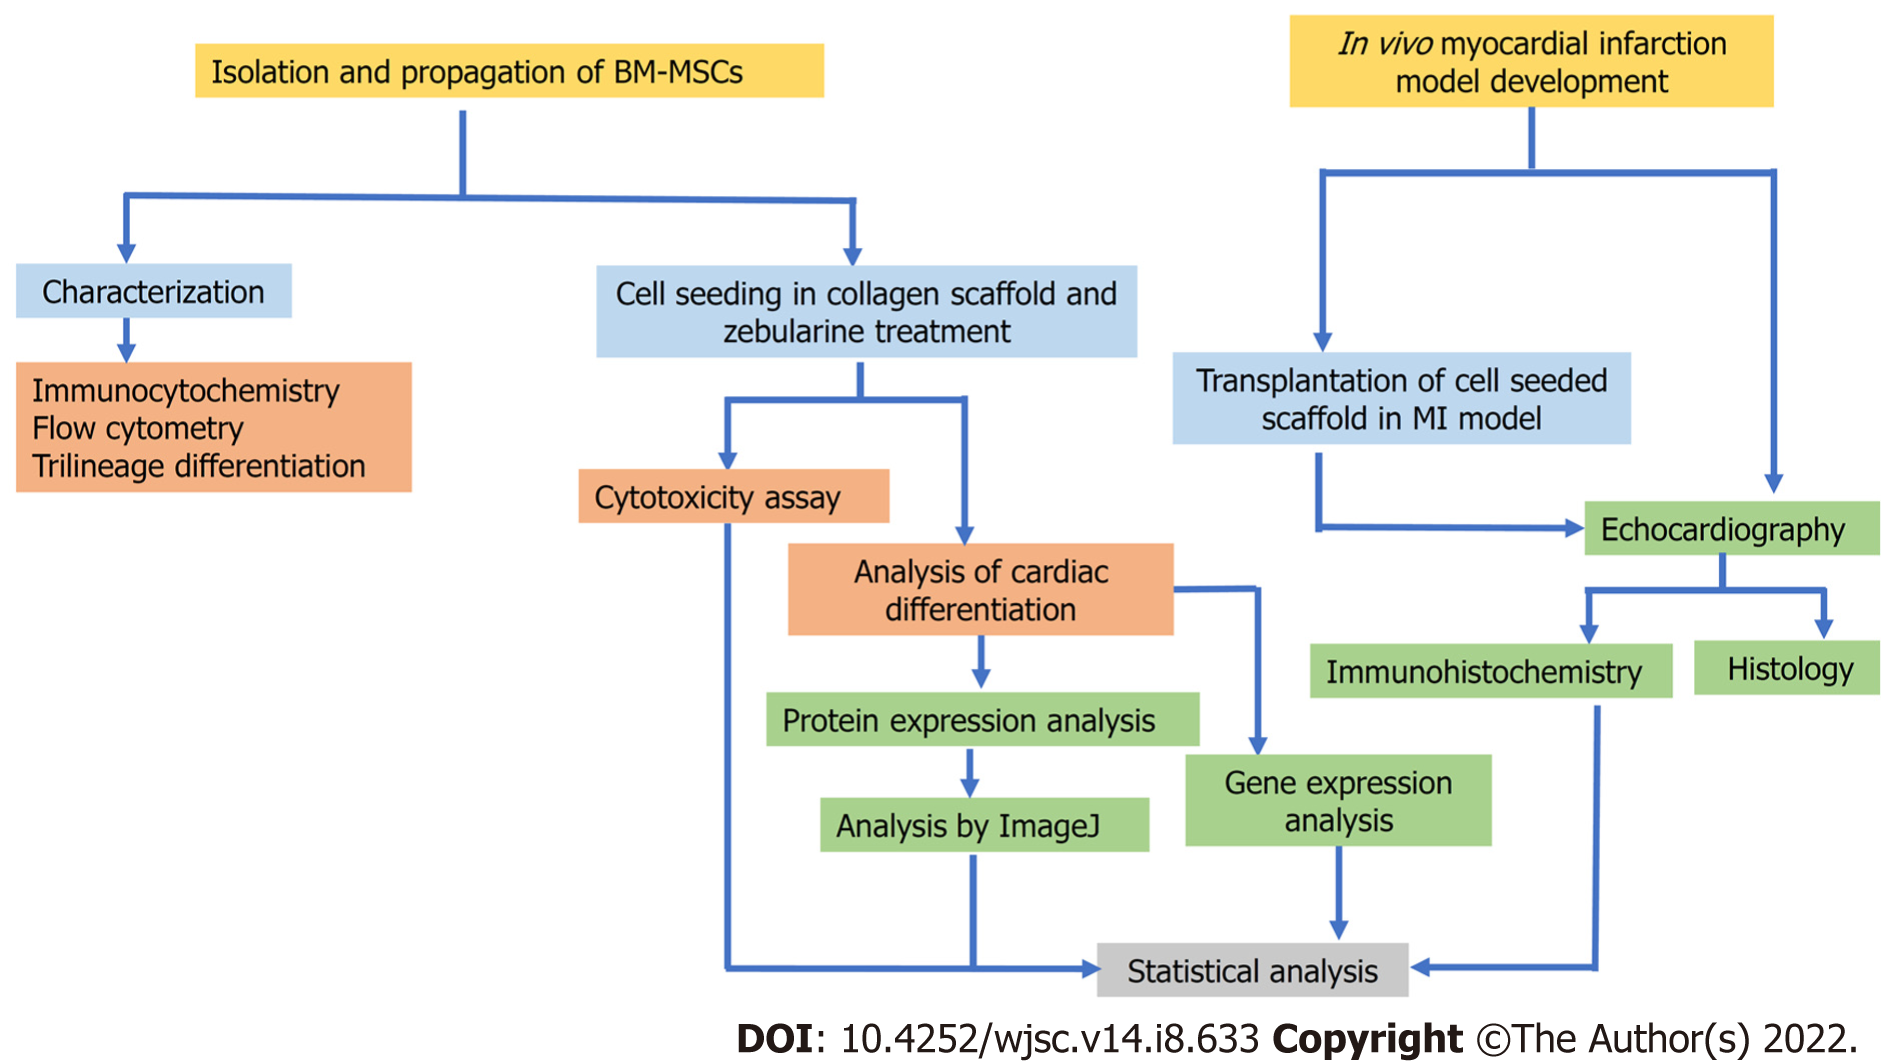
Figure 1 Experimental design.
Flow chart representing the experimental design of the study. BM-MSC: Bone marrow-mesenchymal stem cell; MI: Myocardial infarction.
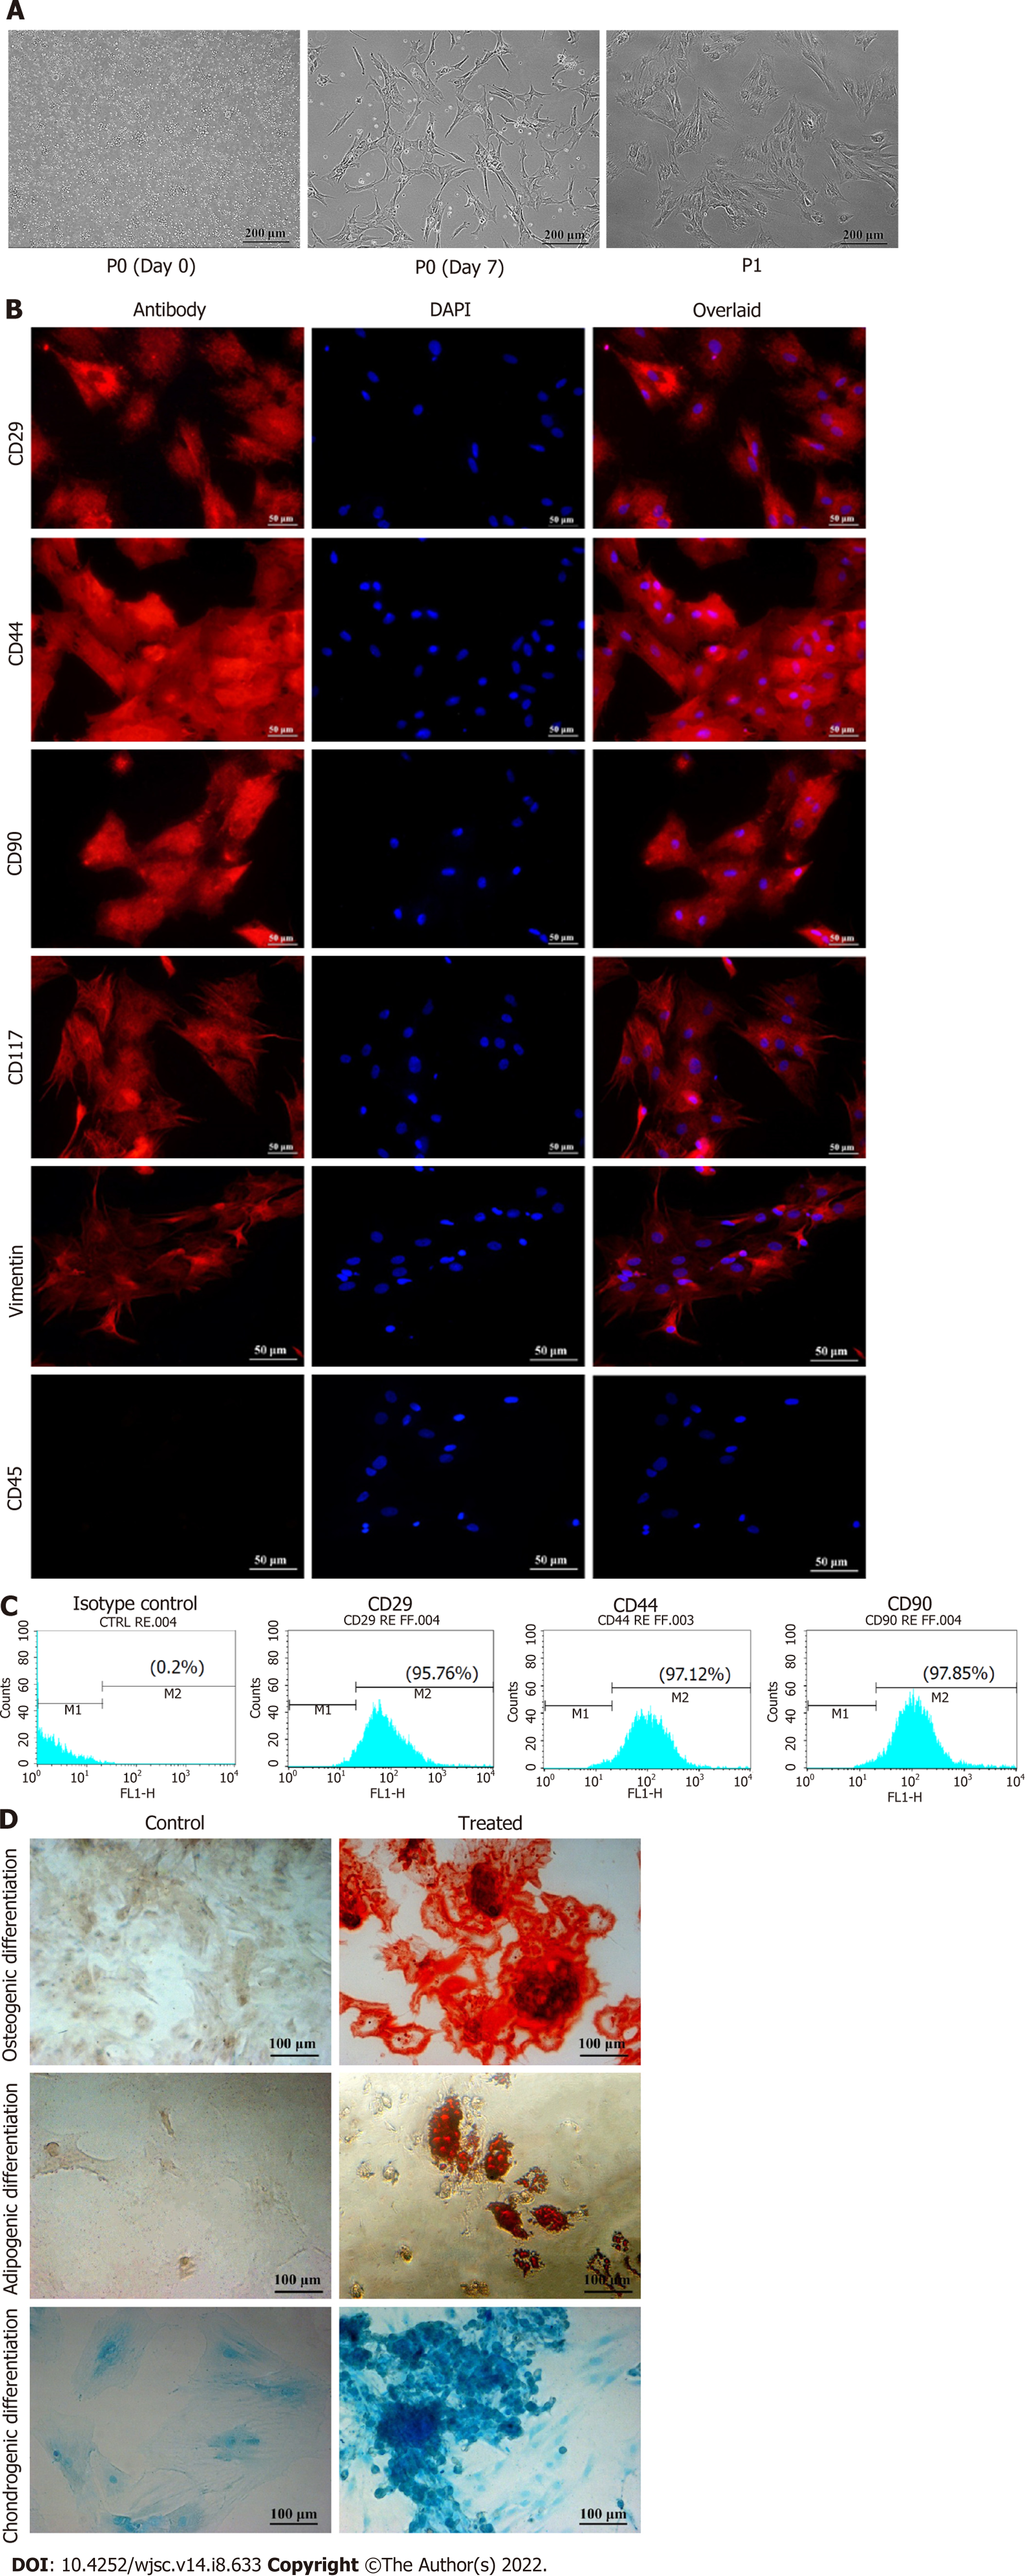
Figure 2 Isolation and characterization of mesenchymal stem cells.
A: Passage 0 and Passage 1 mesenchymal stem cells (MSCs) in culture showing plastic adherence and fibroblast like appearance, and homogeneous population; B: Immunocytochemical analysis showing positive expression of CD29, CD44, CD90, CD117, vimentin, and negative expression of CD45 which is a hematopoietic marker; C: Flow cytometric analysis showing > 95% positive expression of MSC specific surface markers CD29, CD44, CD90; D: Trilineage differentiation analysis of MSCs by Alizarin Red S, Oil Red O and Alcian Blue staining showing the ability of MSCs to differentiate into osteogenic, adipogenic and chondrogenic lineages, respectively. DAPI: 4',6-diamidino-2-phenylindole.
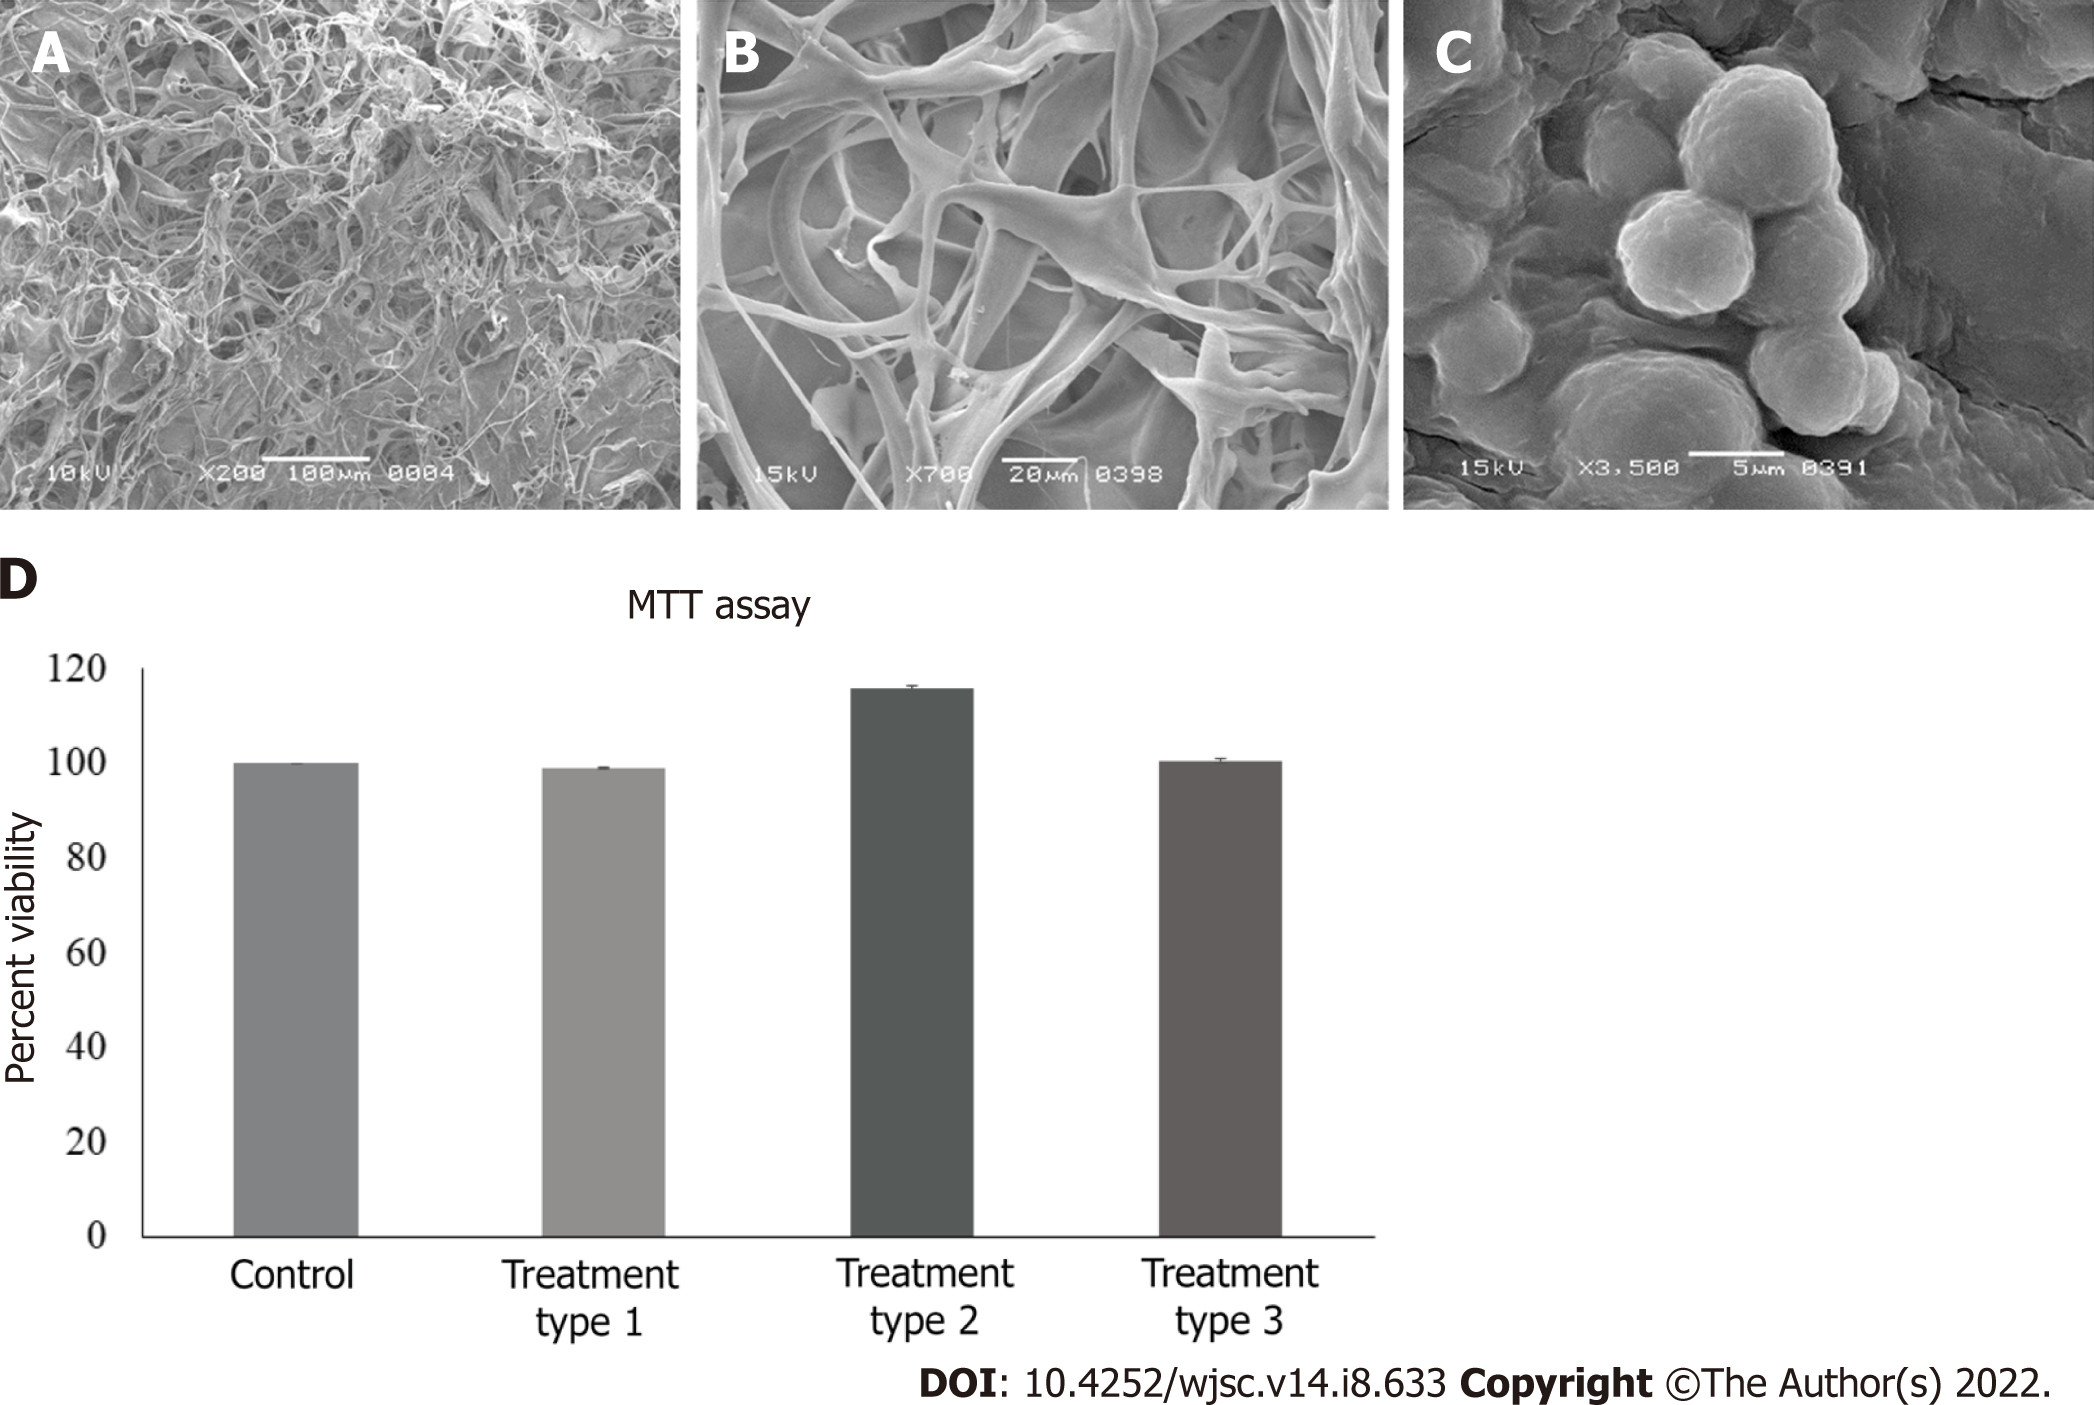
Figure 3 Scanning electron microscopy and cytotoxicity analysis.
A-C: Scanning electron microscopy analysis showing mesh like fiber network of (A) dry collagen scaffold, (B) collagen scaffold soaked in medium, and (C) spherical shaped mesenchymal stem cells (MSCs) in the scaffold; D: Cytotoxicity analysis of zebularine (3 μmol/L) treated MSC-seeded scaffolds. Bar graphs represent viable cells in all treatment groups as compared to untreated MSC-seeded collagen scaffold. Data is presented as mean ± standard error of mean with significance level aP < 0.05.
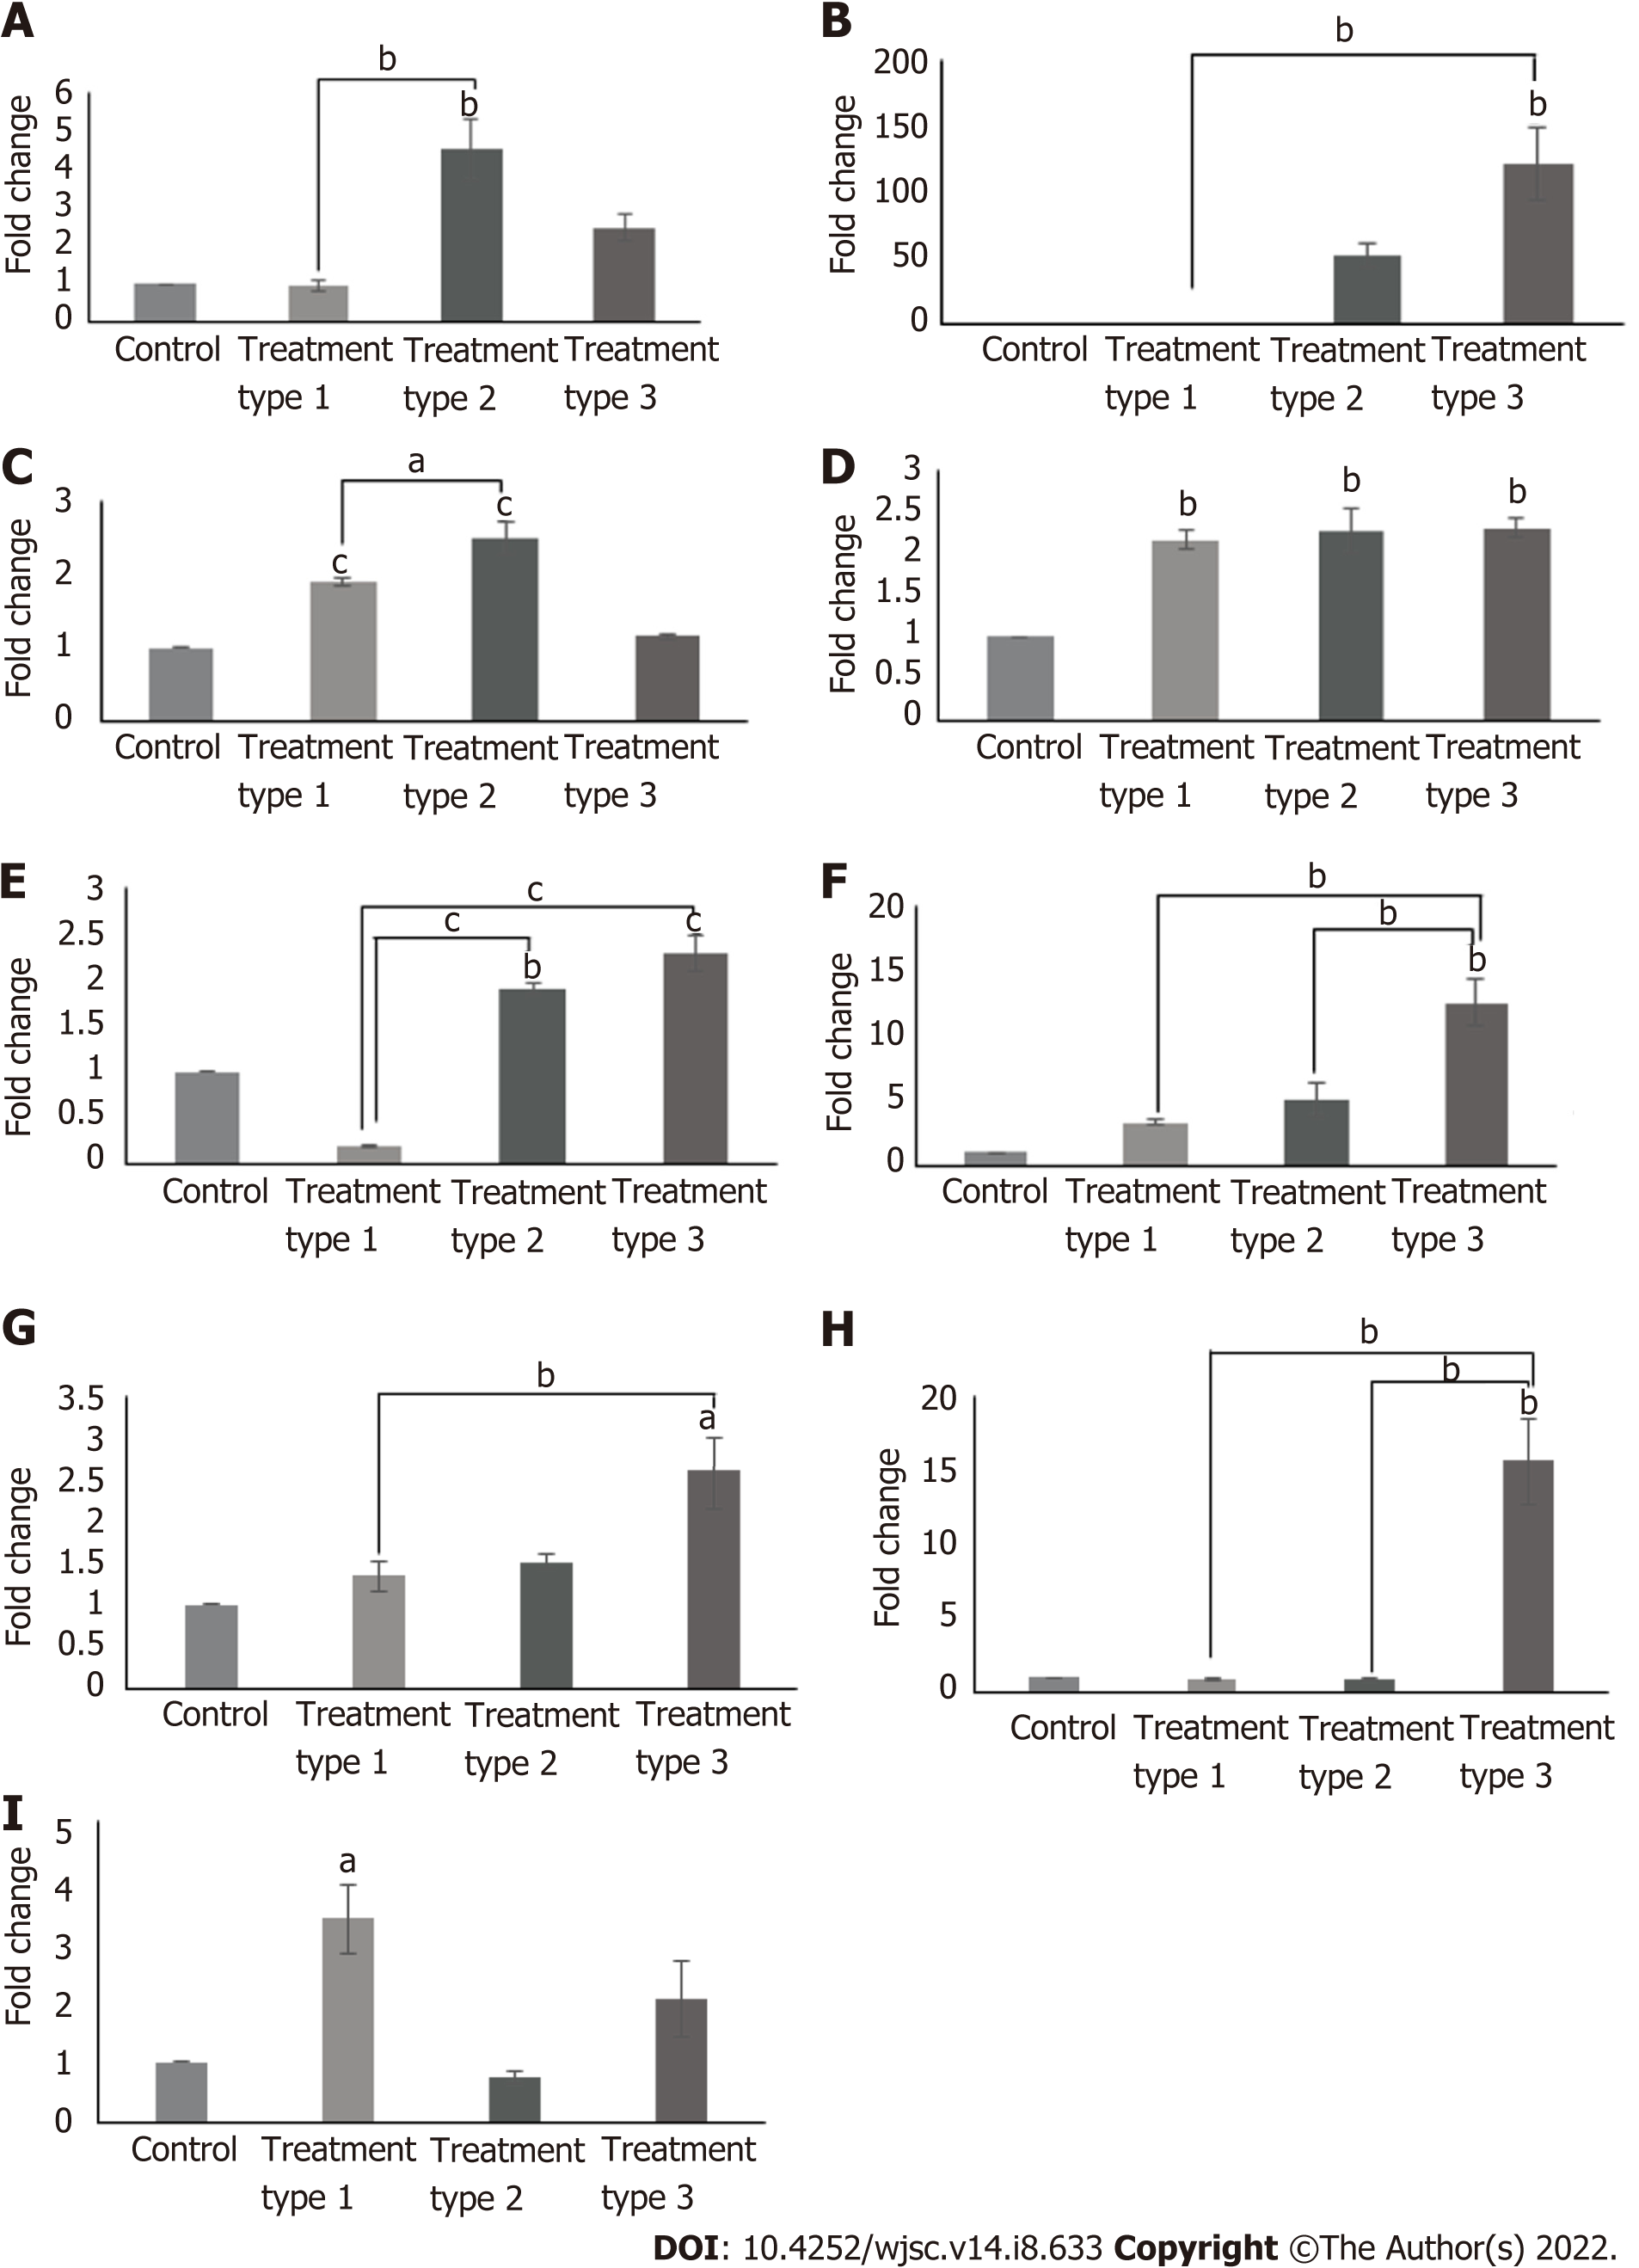
Figure 4 Gene expression analysis of cardiac markers.
Bar graphs representing fold change of cardiac specific genes, GATA4, cardiac troponin T (cTnT), cardiac troponin I (cTnI), Nkx2.5, cardiac myosin heavy chain (cMHC), connexin43, atrial natriuretic factor (ANF), T-box transcription factor 20 (Tbx20), and myocyte-specific enhancer-binding factor 2C (Mef2C) in different types of zebularine treated mesenchymal stem cell-seeded scaffolds compared to untreated control. A: GATA4; B: cTnT; C: cTnI; D: Nkx2.5; E: cMHC; F: Connexin43; G: ANF; H: Tbx20; I: Mef2C. GATA4, cTnT, connexin43, ANF, Tbx20, and cMHC showed significant increase in type 3 treatment as compared to control and other groups. Data is presented as mean ± standard error of mean with significance level aP < 0.05 (where aP < 0.05, bP < 0.01, cP < 0.001).
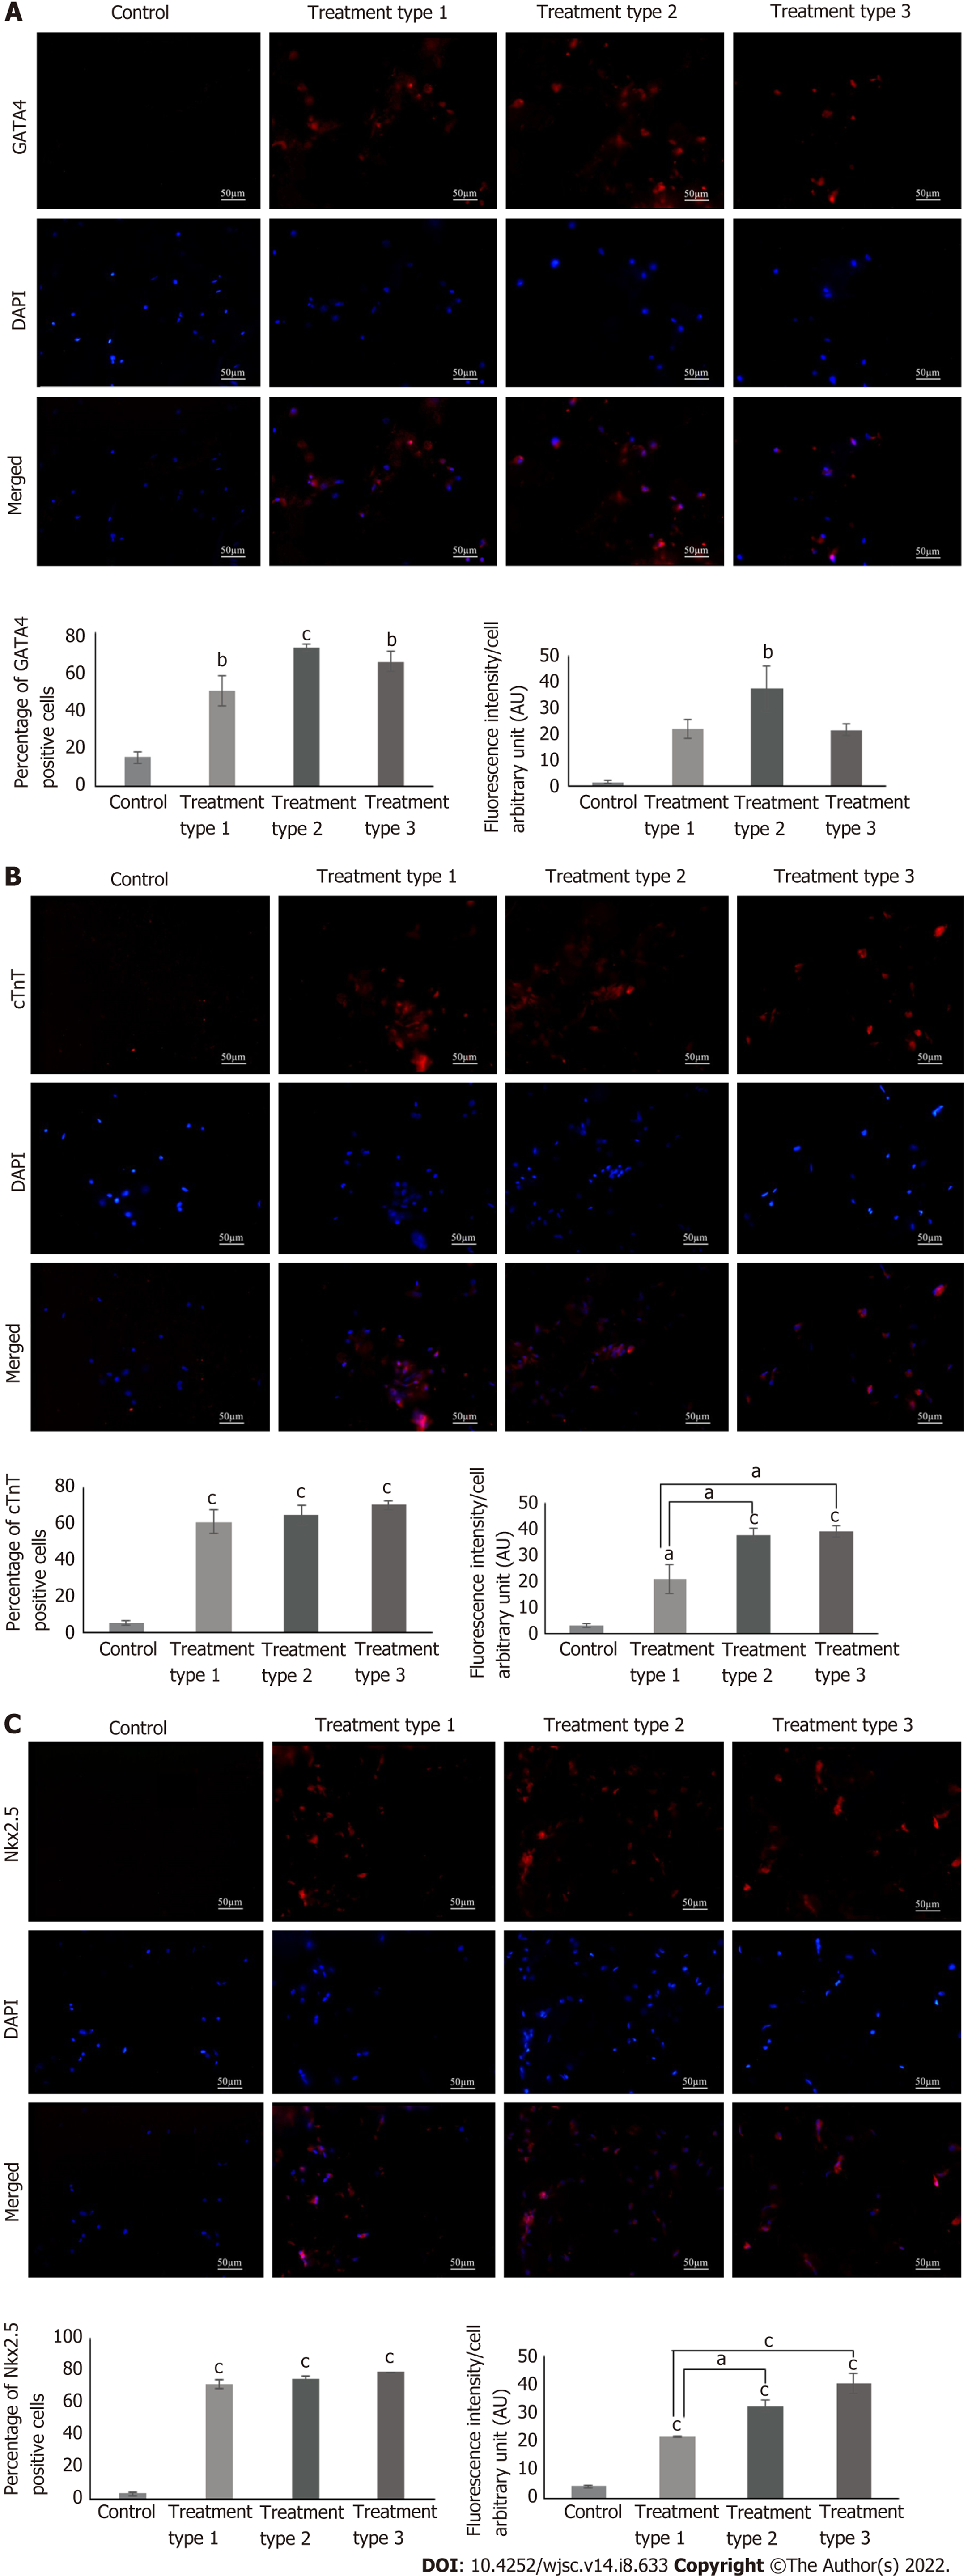
Figure 5 Protein expression analysis of cardiac markers.
A: GATA4; B: Cardiac troponin T (cTnT); C: Nkx2.5. Fluorescence images showing the expression of cardiac specific proteins GATA4, cTnT, and Nkx2.5 in frozen sections of zebularine treated mesenchymal stem cells (MSC)-seeded collagen scaffold. Corresponding bar graphs representing the percentage of positive cells and their respective fluorescence intensities in treated and untreated MSC-seeded collagen scaffolds. Data is presented as mean ± standard error of mean with significance level aP < 0.05 (where aP < 0.05, bP < 0.01, cP < 0.001). cTnT: Cardiac troponin T; DAPI: 4',6-diamidino-2-phenylindole.
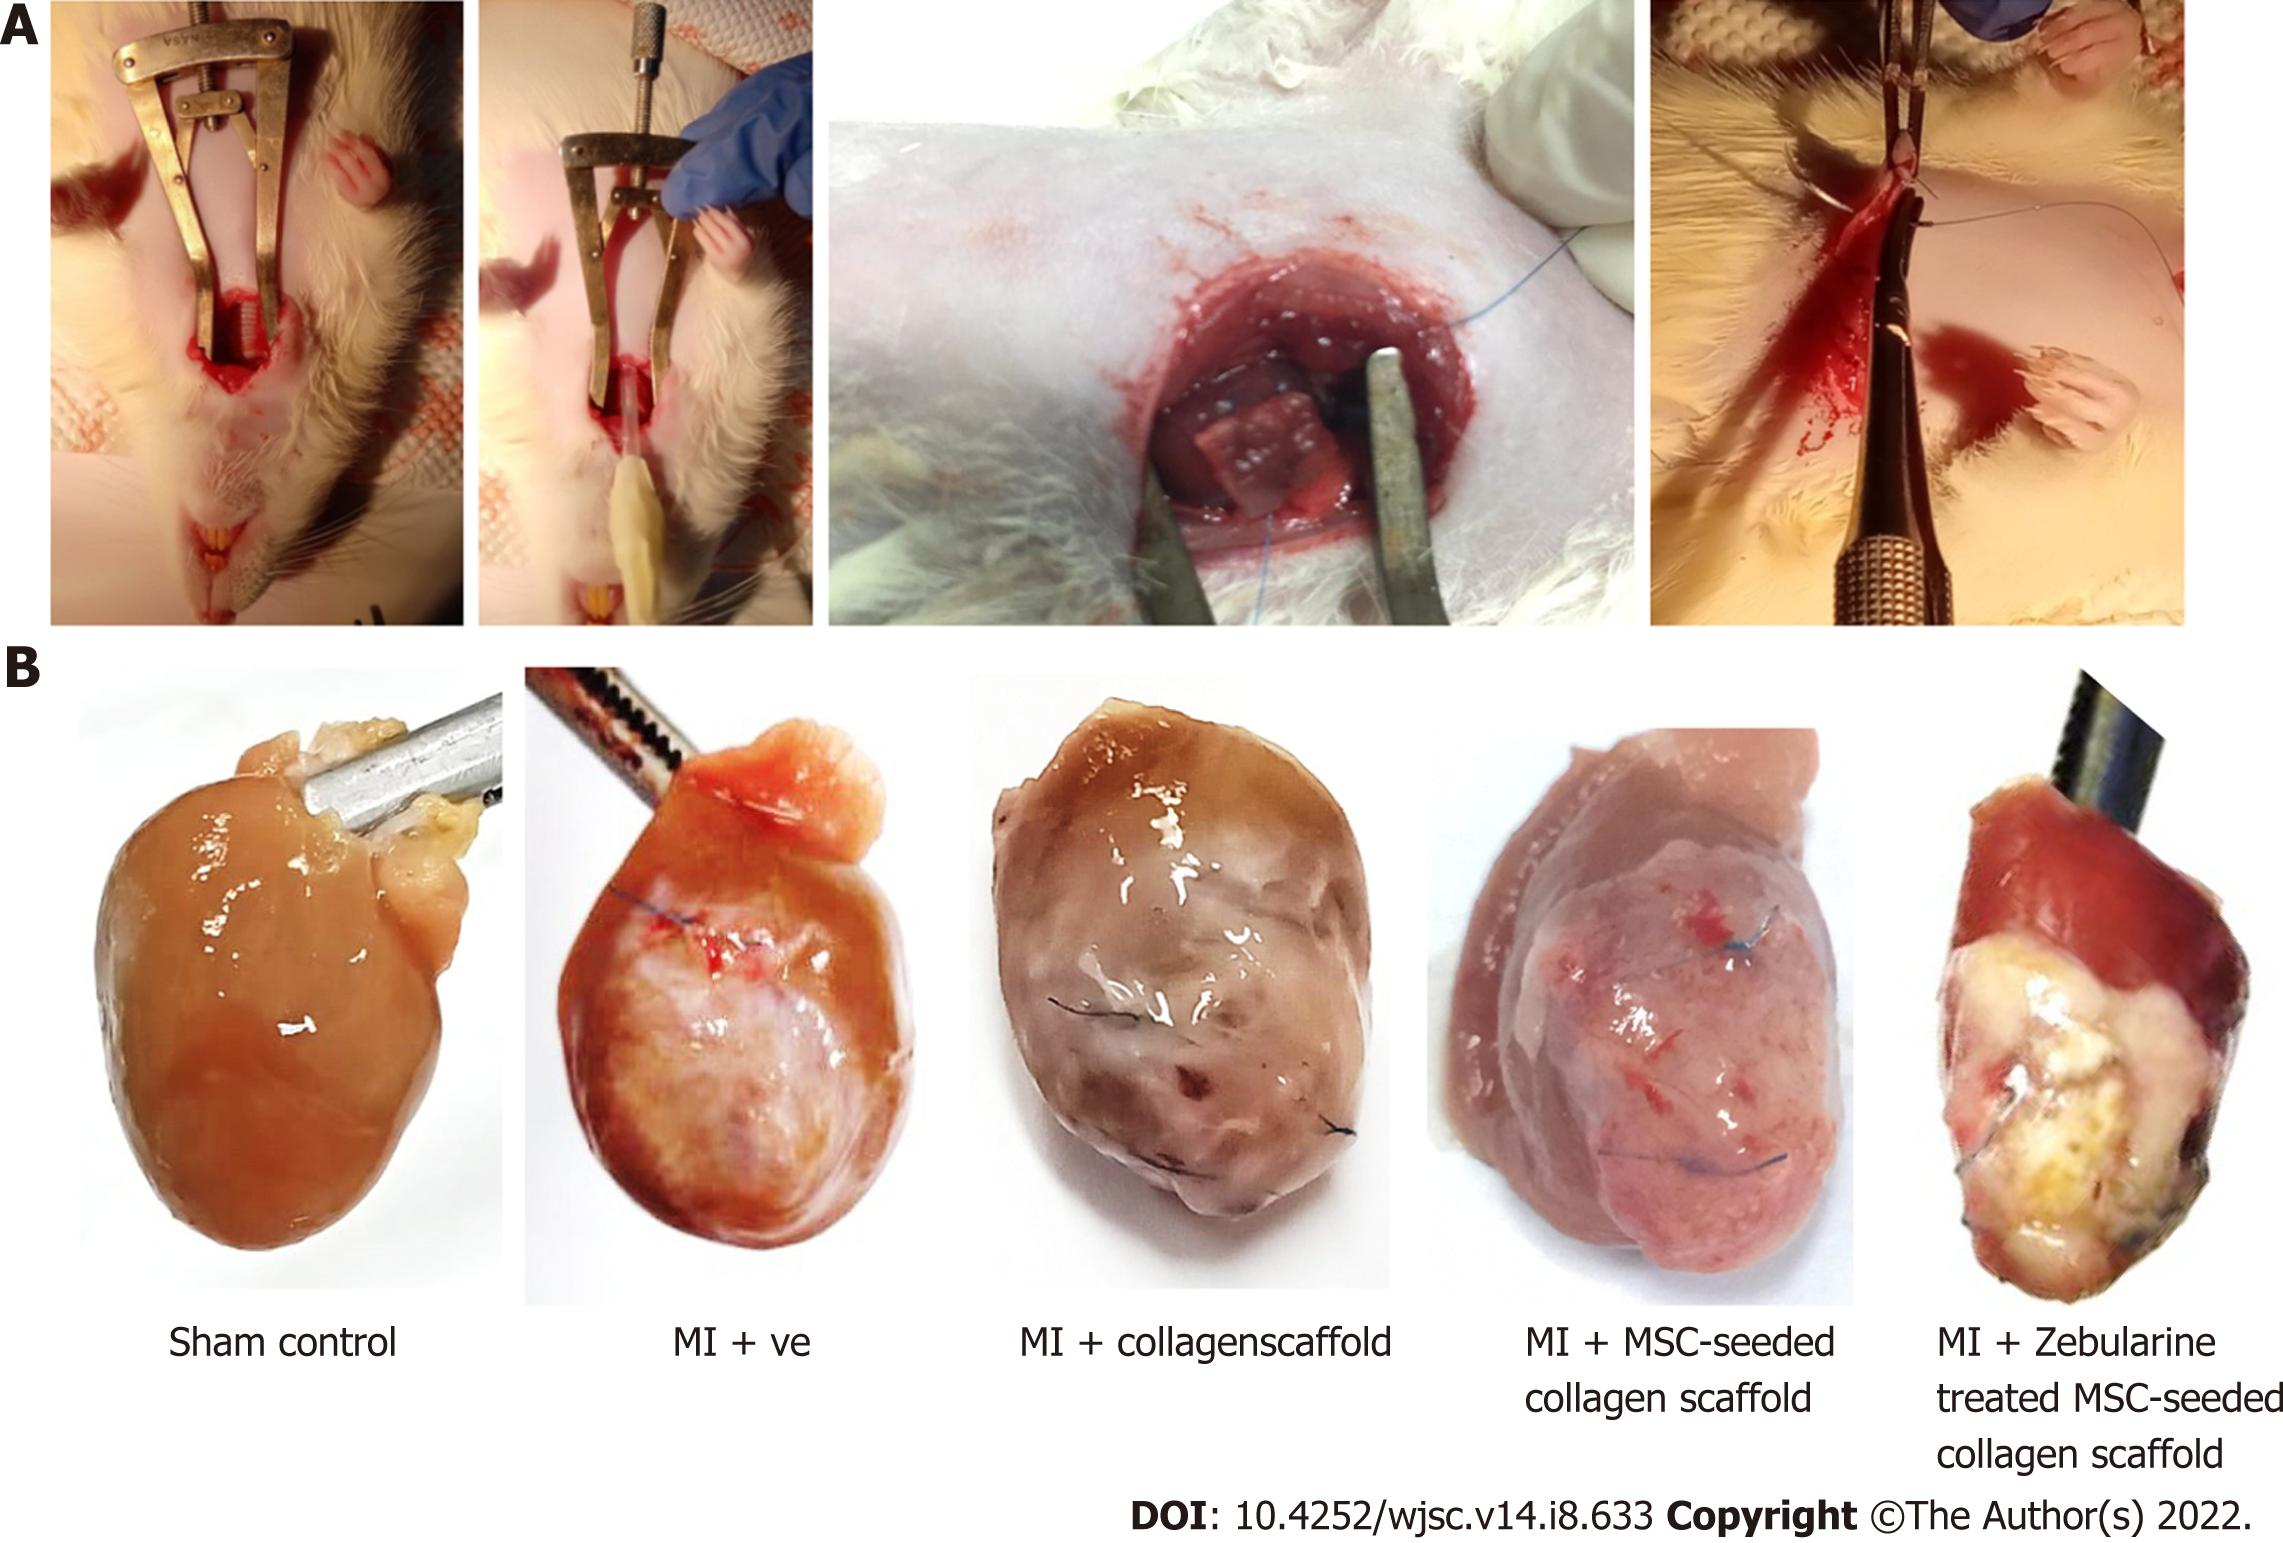
Figure 6 Collagen scaffold transplantation in rat myocardial infarction model.
A: Images showing the steps of collagen scaffold transplantation; B: Images showing isolated rat hearts of sham control, myocardial infarction group, scaffold only group, and untreated and zebularine treated mesenchymal stem cell-seeded scaffold groups. MI: Myocardial infarction; MSC: Mesenchymal stem cells.
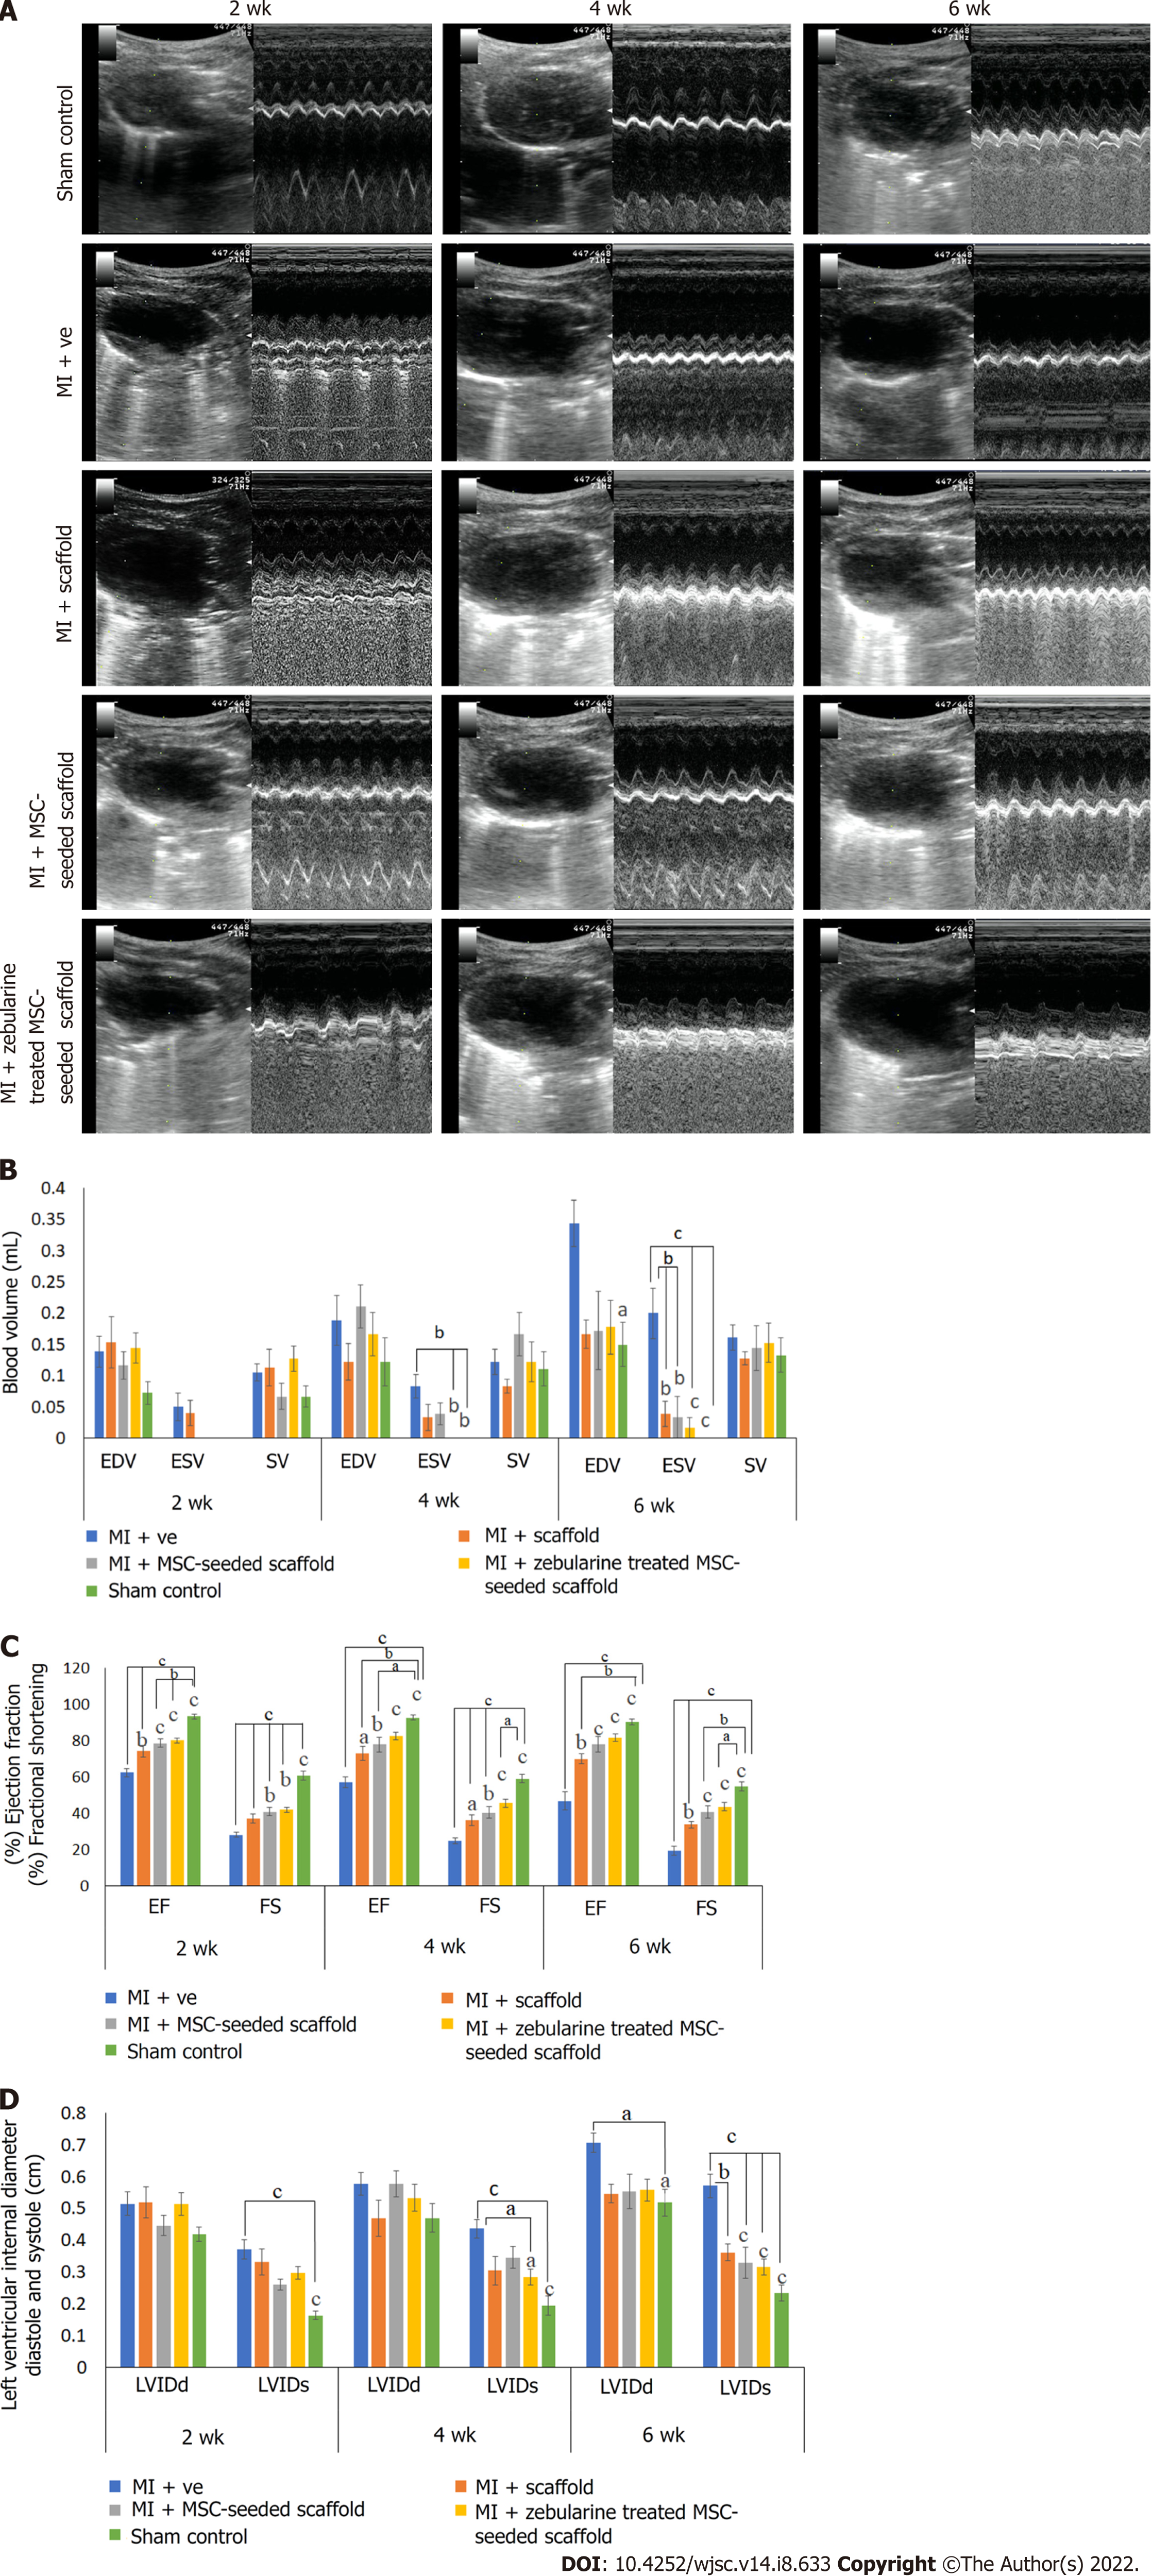
Figure 7 Cardiac functional analysis by echocardiography.
A: Ultrasound images showing B and M mode scans of left ventricle in sham control, myocardial infarction (MI) group, scaffold only group, and untreated and zebularine treated mesenchymal stem cells (MSC)-seeded scaffold groups; B-D: Bar graphs showing functional analysis in terms of (B) end systolic and diastolic volumes and stroke volume, (C) ejection fraction and fractional shortening, and (D) left ventricular systolic and diastolic internal dimensions after 2, 4 and 6 wk of MI model development. Both untreated and zebularine treated MSC-seeded collagen scaffold transplanted groups showed functional improvement. However, zebularine treated group showed more pronounced results. Data is presented as mean ± standard error of mean with significance level aP < 0.05 (where aP < 0.05, bP < 0.01, cP < 0.001). MI: Myocardial infarction; MSC: Mesenchymal stem cells; EDV: End diastolic volume; ESV: End systolic volume; LVIDd: Left ventricular internal diameter diastole; LVIDs: Left ventricular internal diameter systole; EF: Ejection fraction; FS: Fractional shortening; SV: Stroke volume.
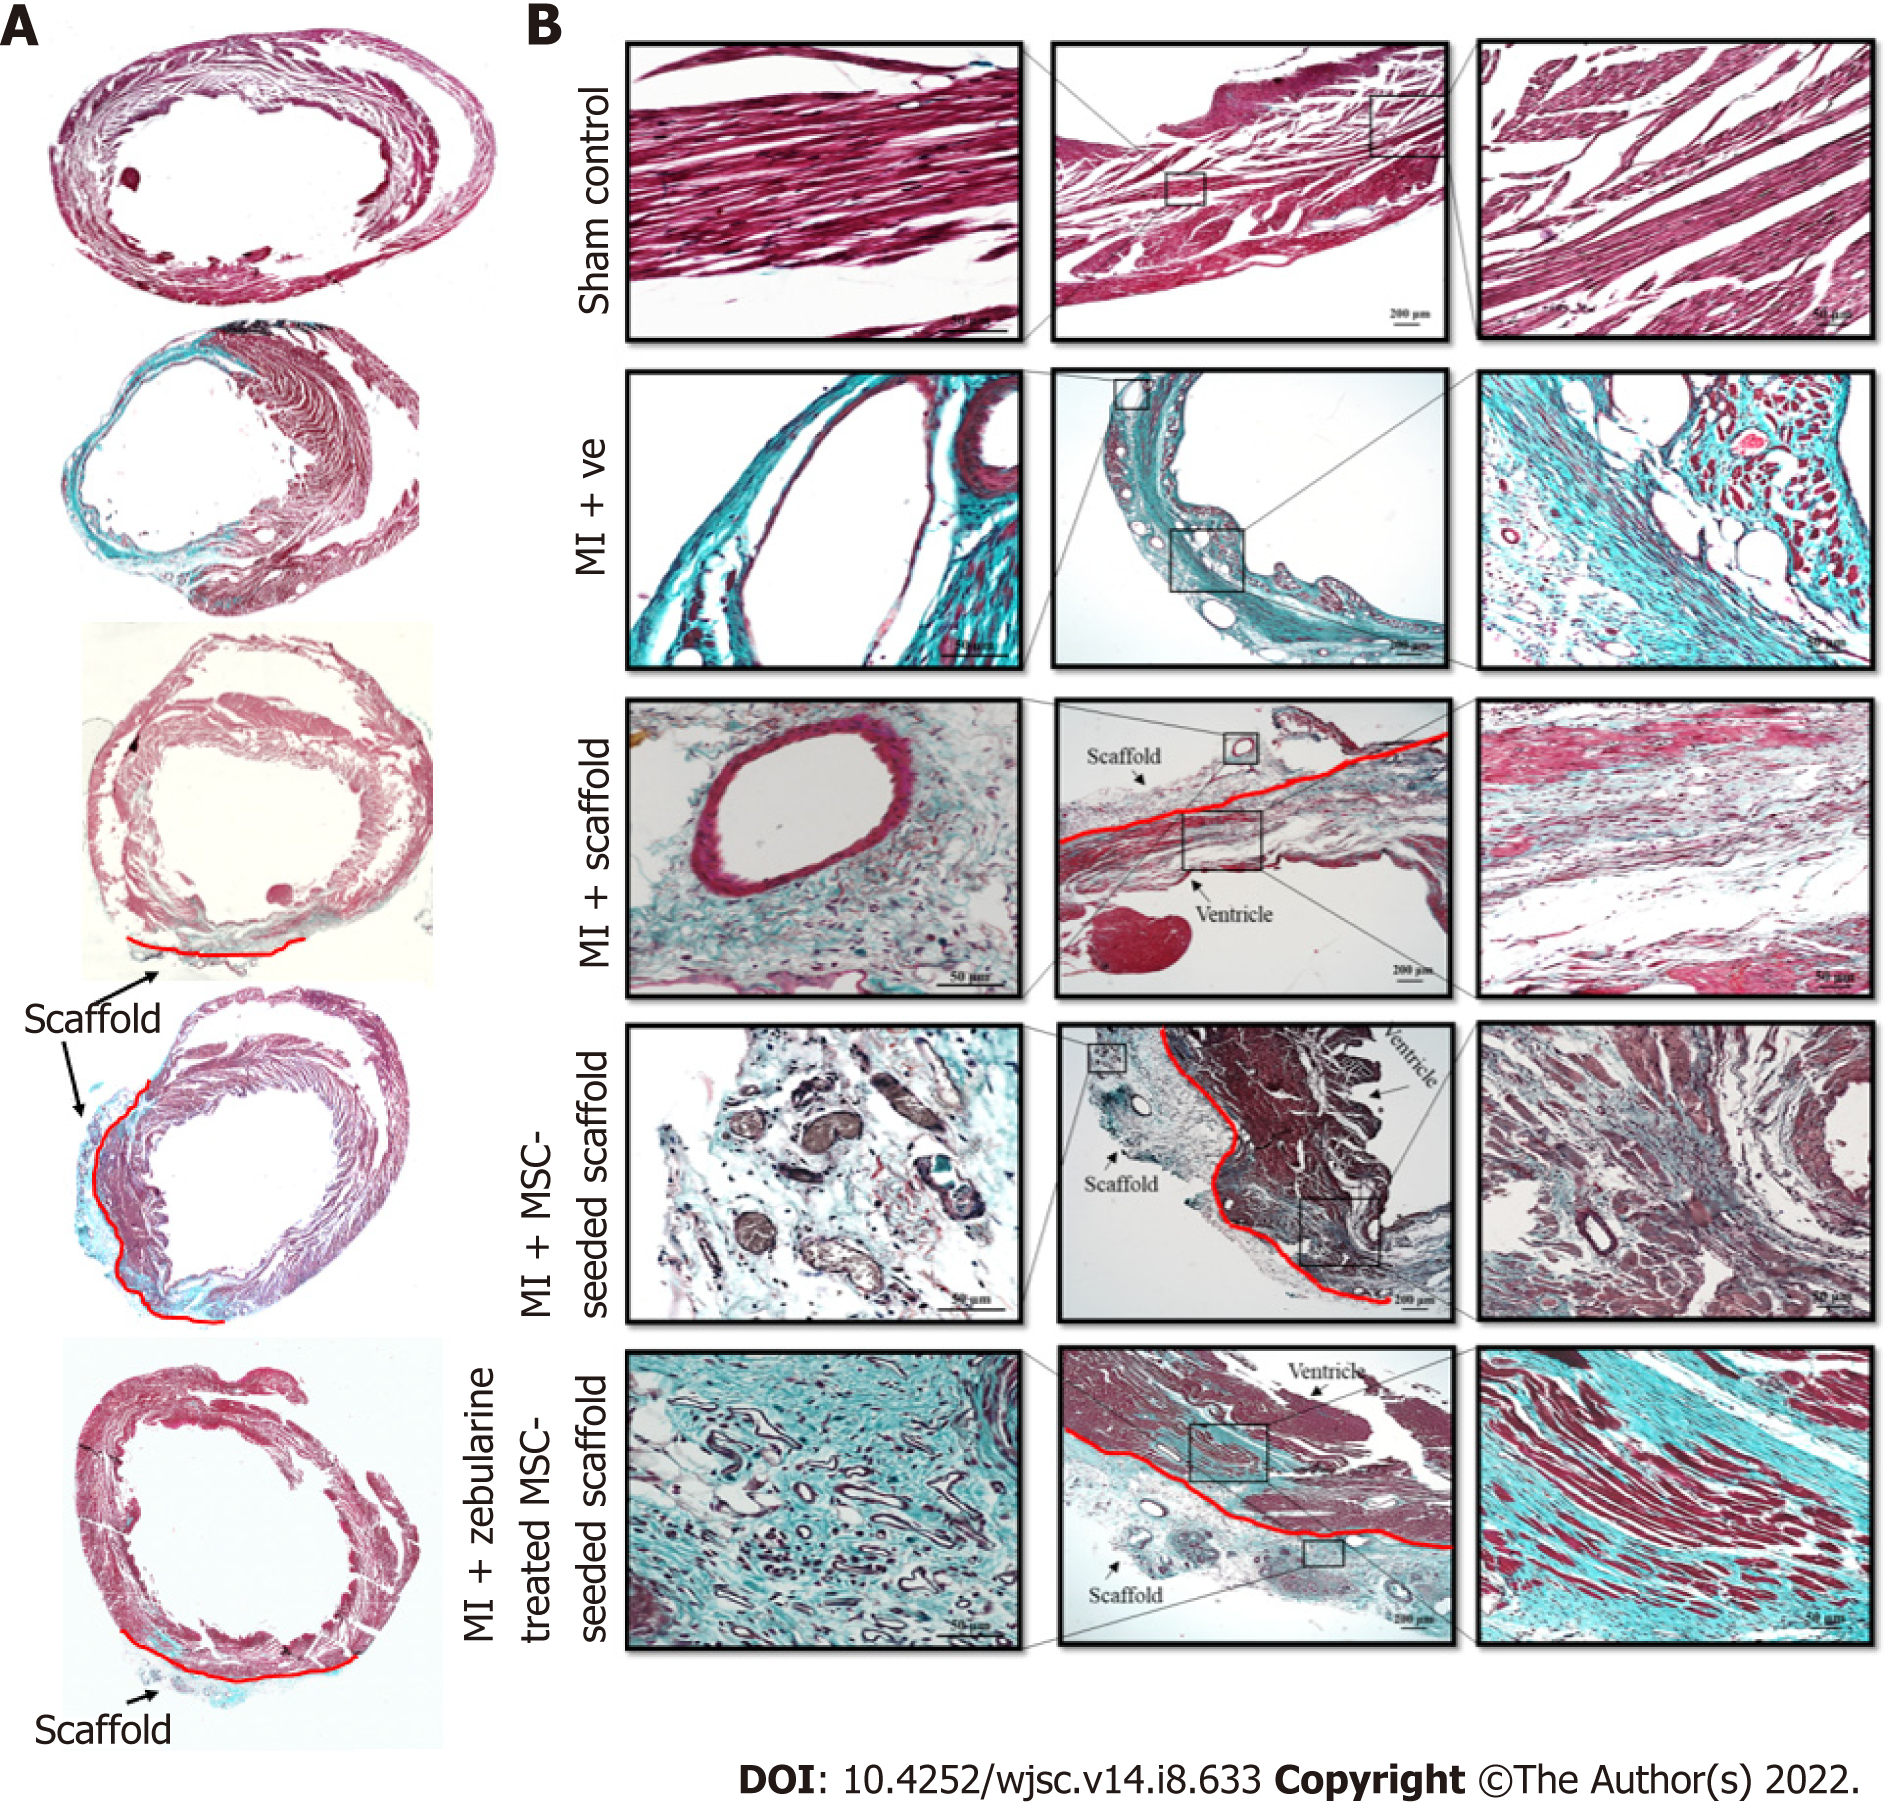
Figure 8 Histological analysis of rat hearts.
A: Images showing Masson’s trichrome stained sections of whole heart; B: Images showing Masson’s trichrome stained sections of the corresponding magnified regions in sham control, myocardial infarction (MI) group, scaffold only group, and untreated and zebularine treated mesenchymal stem cell-seeded scaffold groups 6 wk post MI. MI: Myocardial infarction; MSC: Mesenchymal stem cells.
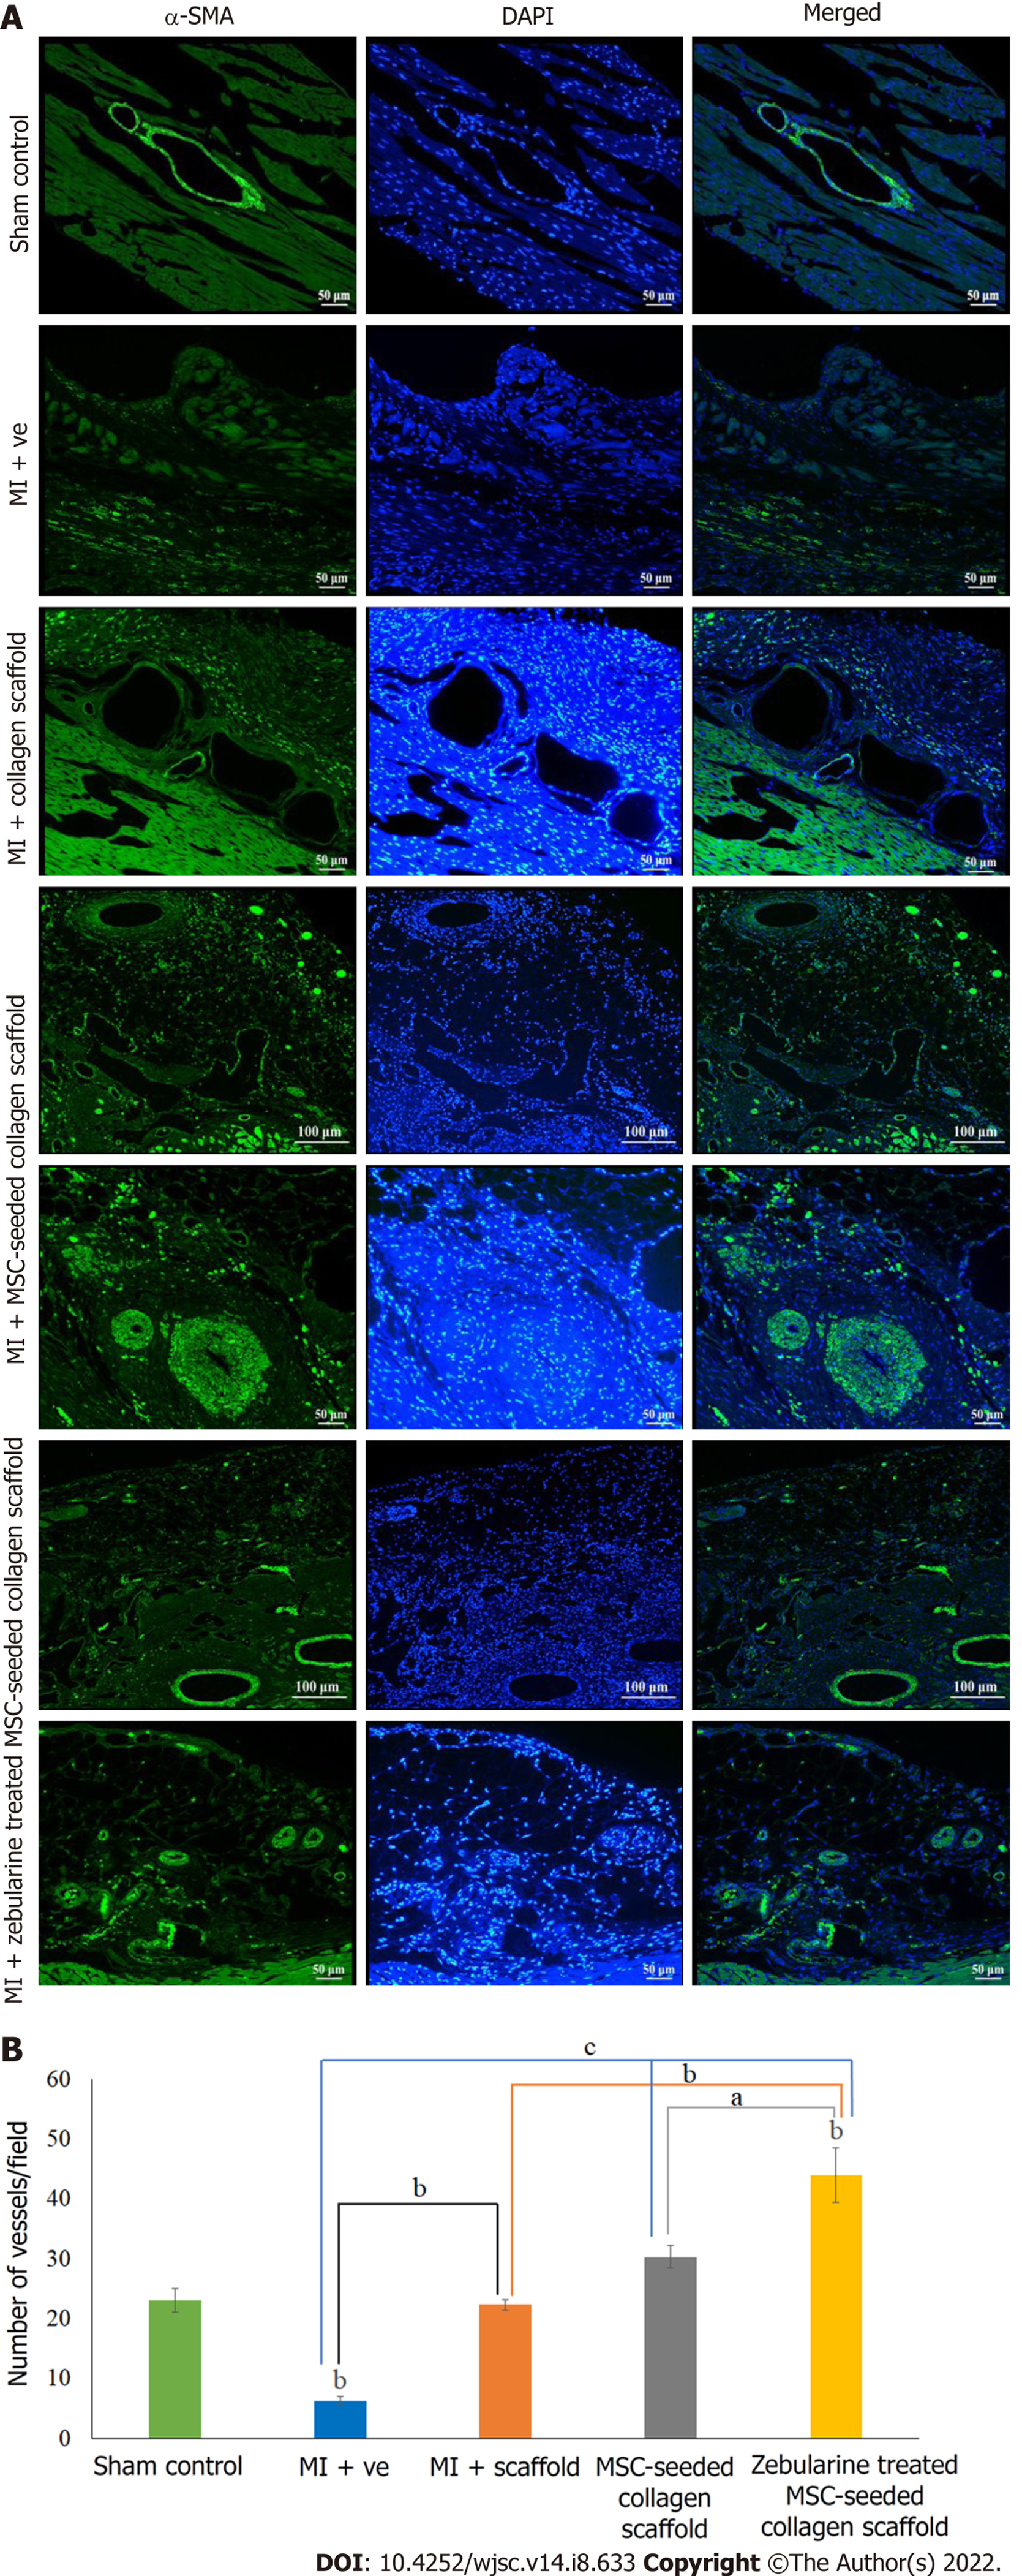
Figure 9 Analysis of angiogenesis.
A: Immunohistochemical analysis of rat hearts by α-smooth muscle actin showing blood vessels in the left ventricle in sham control and myocardial infarction model; scaffold only group, and untreated and zebularine treated mesenchymal stem cells (MSC)-seeded scaffold groups also show angiogenesis in the scaffold region as well; B: Bar graphs showing the quantification of blood vessels and statistical analysis. Zebularine treated MSC-seeded scaffold transplanted group showed more significant increase in the number of blood vessels. Data is presented as mean ± standard error of mean with significance level aP < 0.05 (where aP < 0.05, bP < 0.01, cP < 0.001). SMA: Smooth muscle actin; MI: Myocardial infarction; MSC: Mesenchymal stem cells.
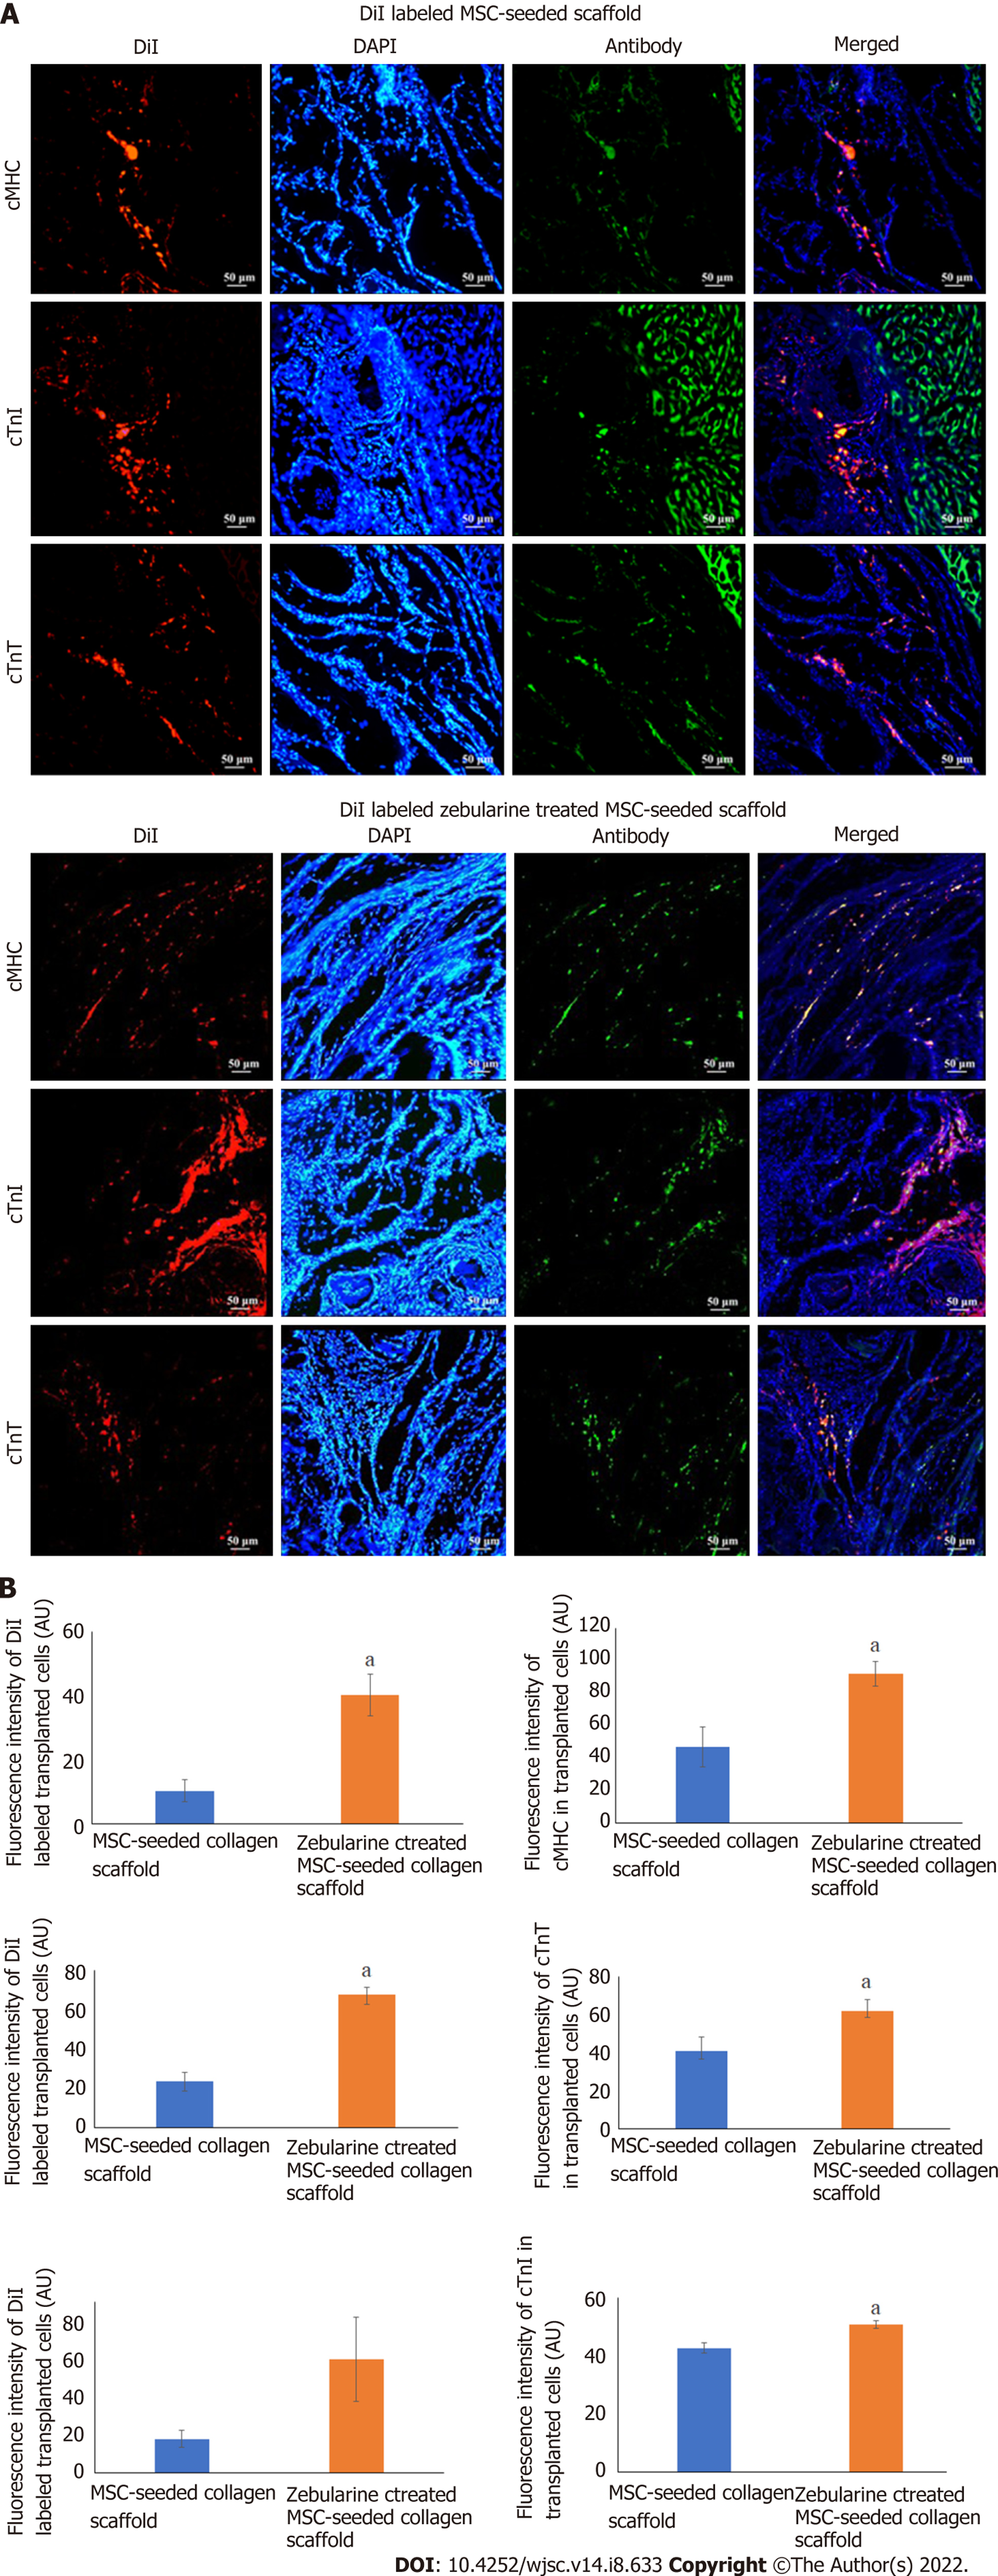
Figure 10 Cell tracking analysis.
A: Fluorescence images showing DiI labeled mesenchymal stem cells (MSCs) in the scaffold near the border of the scaffold and the infarcted myocardium, and co-localized green fluorescent cardiac proteins, cardiac myosin heavy chain, cardiac troponin T, and cardiac troponin I in the untreated and zebularine treated MSC-seeded scaffold transplanted rat heart; B: Quantification of fluorescence intensities showing significantly higher intensity of DiI labeled MSCs and protein expression in zebularine treated MSC-seeded scaffold group. Data is presented as mean ± standard error of mean with significance level aP < 0.05 (where aP < 0.05). MSC: Mesenchymal stem cells; DAPI: 4',6-diamidino-2-phenylindole. cTnT: Cardiac troponin T; cTnI: Cardiac troponin I; cMHC: Cardiac myosin heavy chain; DAPI: 4',6-diamidino-2-phenylindole.
- Citation: Qazi REM, Khan I, Haneef K, Malick TS, Naeem N, Ahmad W, Salim A, Mohsin S. Combination of mesenchymal stem cells and three-dimensional collagen scaffold preserves ventricular remodeling in rat myocardial infarction model. World J Stem Cells 2022; 14(8): 633-657
- URL: https://www.wjgnet.com/1948-0210/full/v14/i8/633.htm
- DOI: https://dx.doi.org/10.4252/wjsc.v14.i8.633


