Copyright
©The Author(s) 2022.
World J Stem Cells. Mar 26, 2022; 14(3): 231-244
Published online Mar 26, 2022. doi: 10.4252/wjsc.v14.i3.231
Published online Mar 26, 2022. doi: 10.4252/wjsc.v14.i3.231
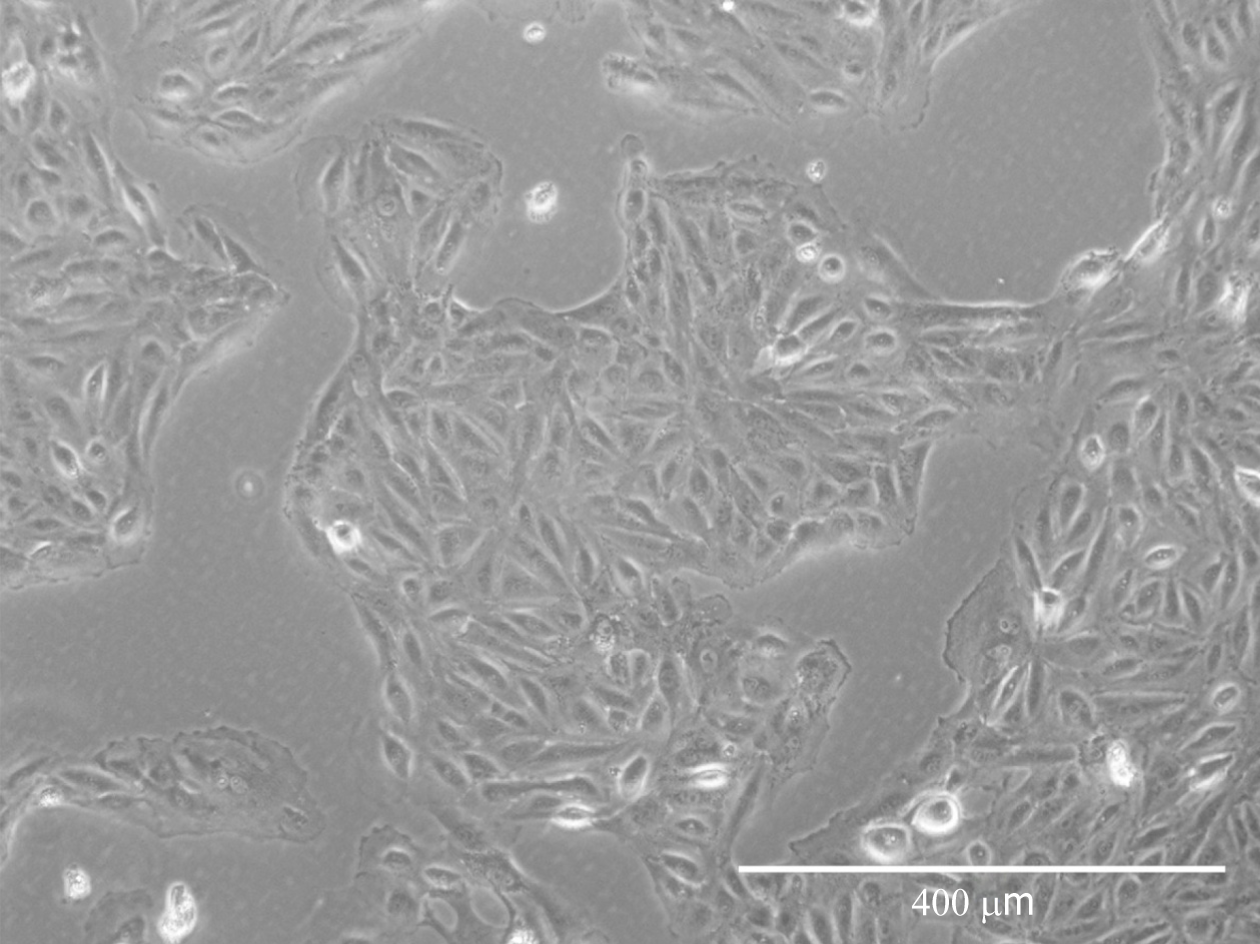
Figure 1 Porcine urine-derived cells at passage 4.
After single-cell dissociation, the cells present a fibroblastic morphology but compact cell culture. Scale bar = 400 μM.
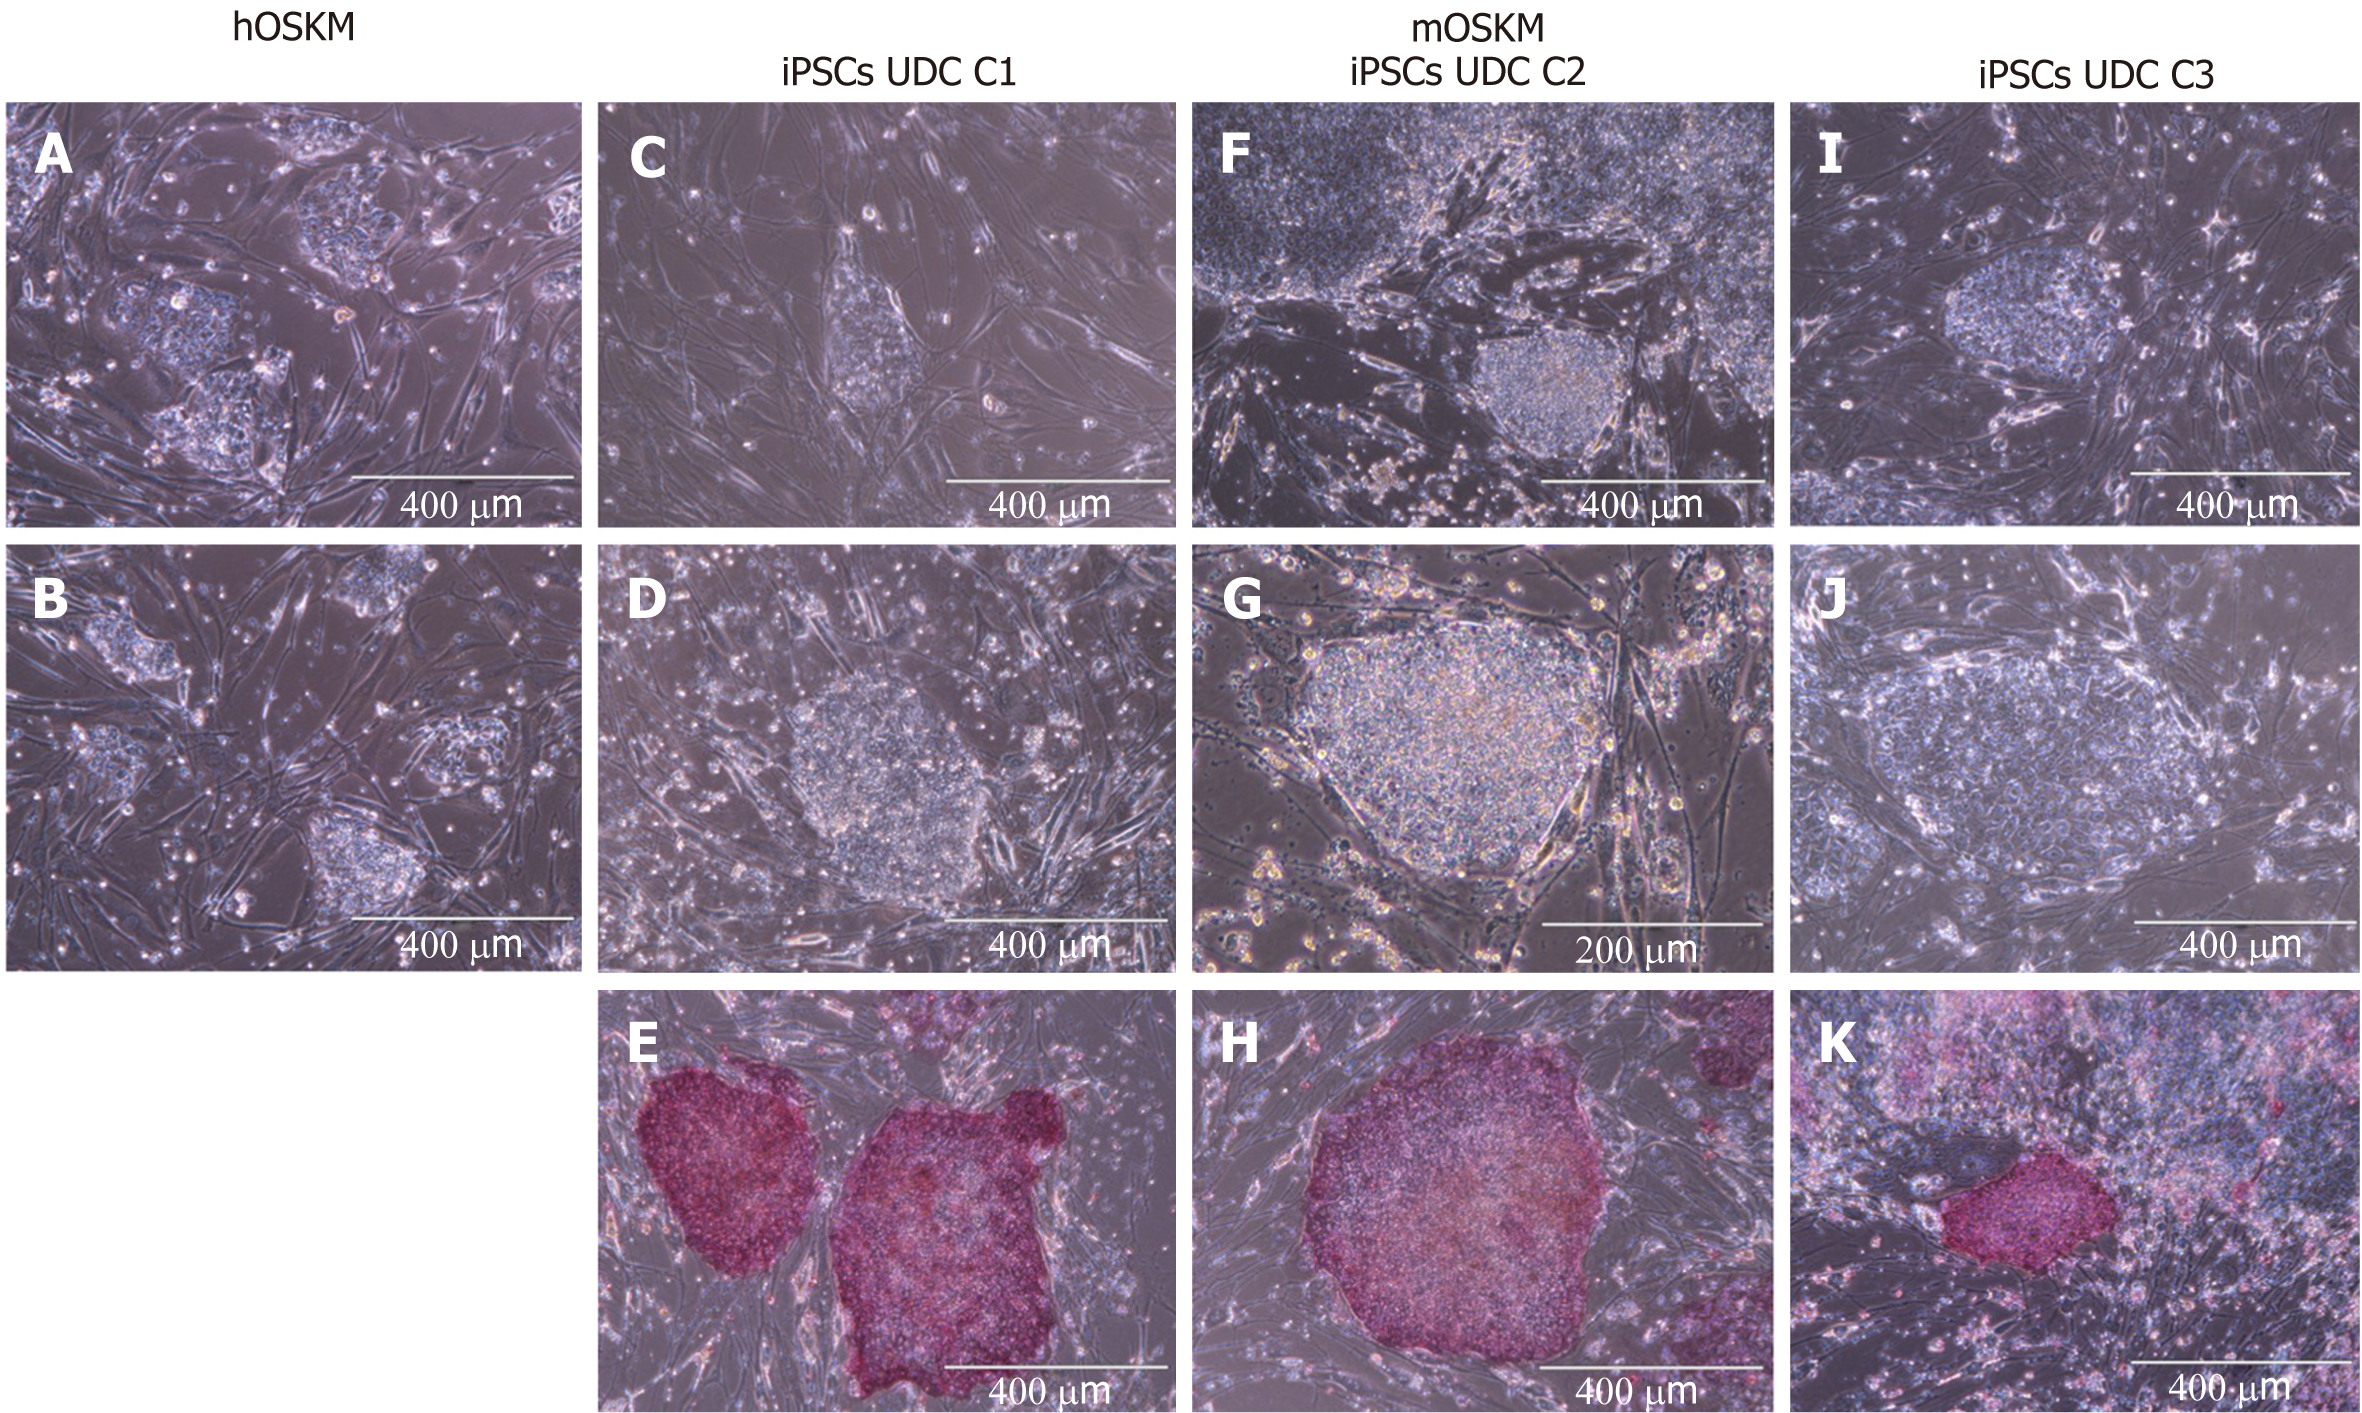
Figure 2 Urine-derived cells reprogrammed with hOSKM and mOSKM.
A and B: Urine-derived cells (UDCs) reprogrammed with hOSKM, scale bar: 400 μM; C, D, and E: UDCs reprogrammed with mOSKM: C1, scale bar: 400 μM; F: UDCs reprogrammed with mOSKM: C2, scale bar: 400 μM; G: UDCs reprogrammed with mOSKM: C2, scale bar: 200 μM; H: UDCs reprogrammed with mOSKM: C2, scale bar: 400 μM; I, J and K: UDCs reprogrammed with mOSKM: C3, scale bar: 400 μM. Colonies are flat, with well-defined edges and tightly packed cells in the centre. UDC: Urine-derived cell; iPSCs: Induced pluripotent stem cells.
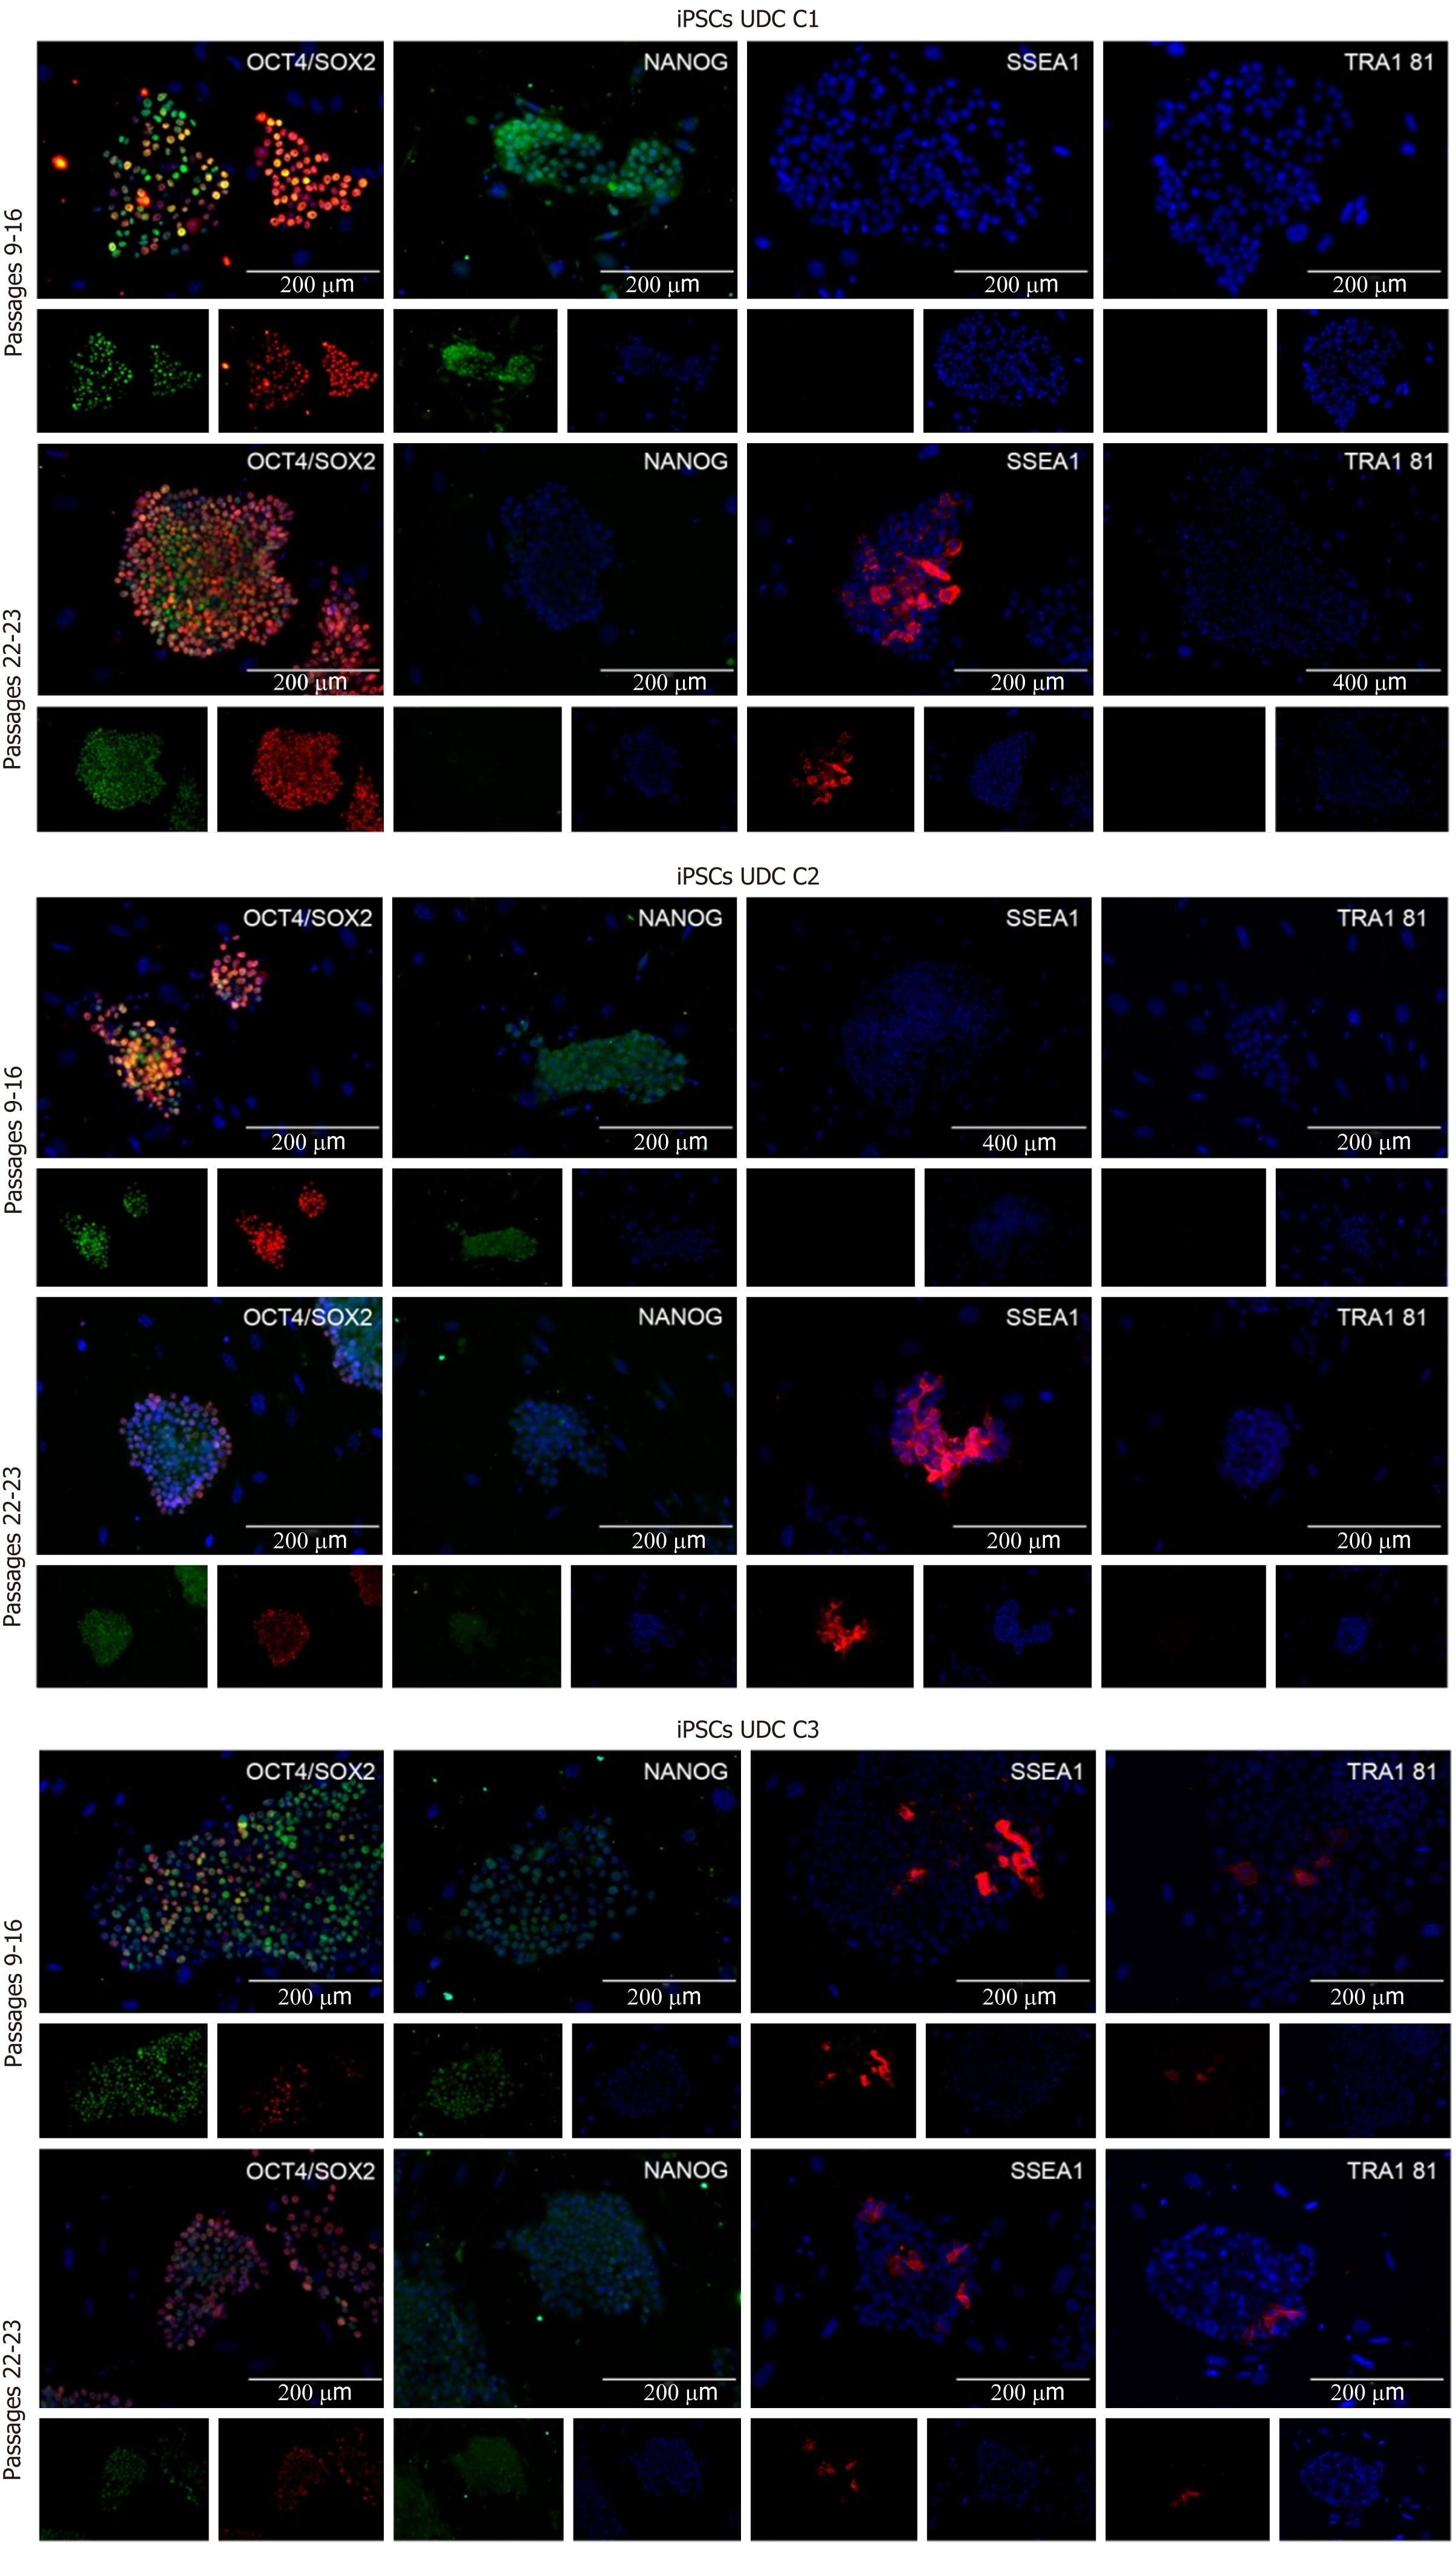
Figure 3 Immunofluorescence for SOX2, octamer-binding transcription factor 4 (OCT4), NANOG, SSEA1, and TRA1 81 detection in C1, C2, and C3 at different passages.
Cell lines at p9-16 were positive for OCT4, SOX2, and NANOG and negative for SSEA1 and TRA1 81. C3 presented some cells positive for SSEA1 and TRA1 81. At later passages, OCT4 and SOX2 were observed, and some cells also presented SSEA1. C1 and C2 were negative for NANOG and TRA1 81, while C3 presented a mildly positive detection for both. UDC: Urine-derived cell; iPSCs: Induced pluripotent stem cells.
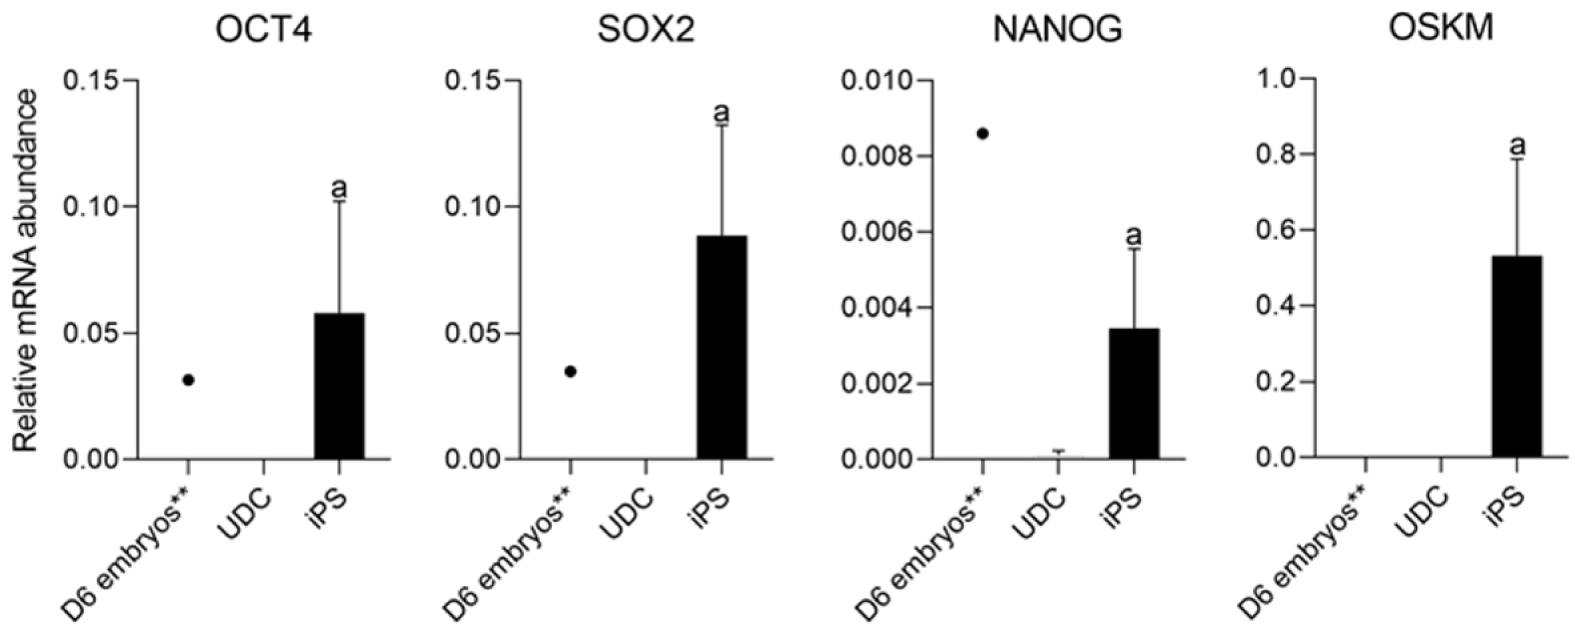
Figure 4 Analysis of the expression of endogenous factors octamer-binding transcription factor 4 (OCT4), SOX2, NANOG, and exogenous OSKM between urine-derived cell and induced pluripotent stem cells.
aP < 0.05 between urine-derived cells (UDCs) and induced pluripotent stem cells (iPSCs). **Represents gene expression analysis of a pool of D6 porcine blastocysts, which did not integrate statistical analyses. Both endogenous and exogenous reprogramming factors were detected on iPSCs but not on UDCs, and porcine blastocysts presented endogenous pluripotency-related gene expression only. UDC: Urine-derived cell; iPSCs: Induced pluripotent stem cells.
Figure 5 Analysis of the expression of endogenous factors octamer-binding transcription factor 4 (OCT4), SOX2, NANOG, and exogenous OSKM in the different lineages (C1, C2, and C3) of induced pluripotent stem cells.
Exogenous reprogramming factors were still detected in later passages. Superscript letters represent differences (P < 0.05) between groups. aRepresents higher relative mRNA abundance, brepresents lower relative mRNA abundance when compared to a, and crepresents lower relative mRNA abundance when compared to b. UDC: Urine-derived cell.
Figure 6 Analysis of endogenous gene expression in urine-derived cell s and the different groups (early passages, intermediate passages, and late passages) of induced pluripotent stem cells.
Exogenous reprogramming factors were still detected in later passages. Superscript letters represent differences (P < 0.05) between groups. aRepresents higher relative mRNA abundance, brepresents lower relative mRNA abundance when compared to a, and crepresents lower relative mRNA abundance when compared to b. EP: Early passages; IP: Intermediate passages; LP: Late passages; UDC: Urine-derived cell.
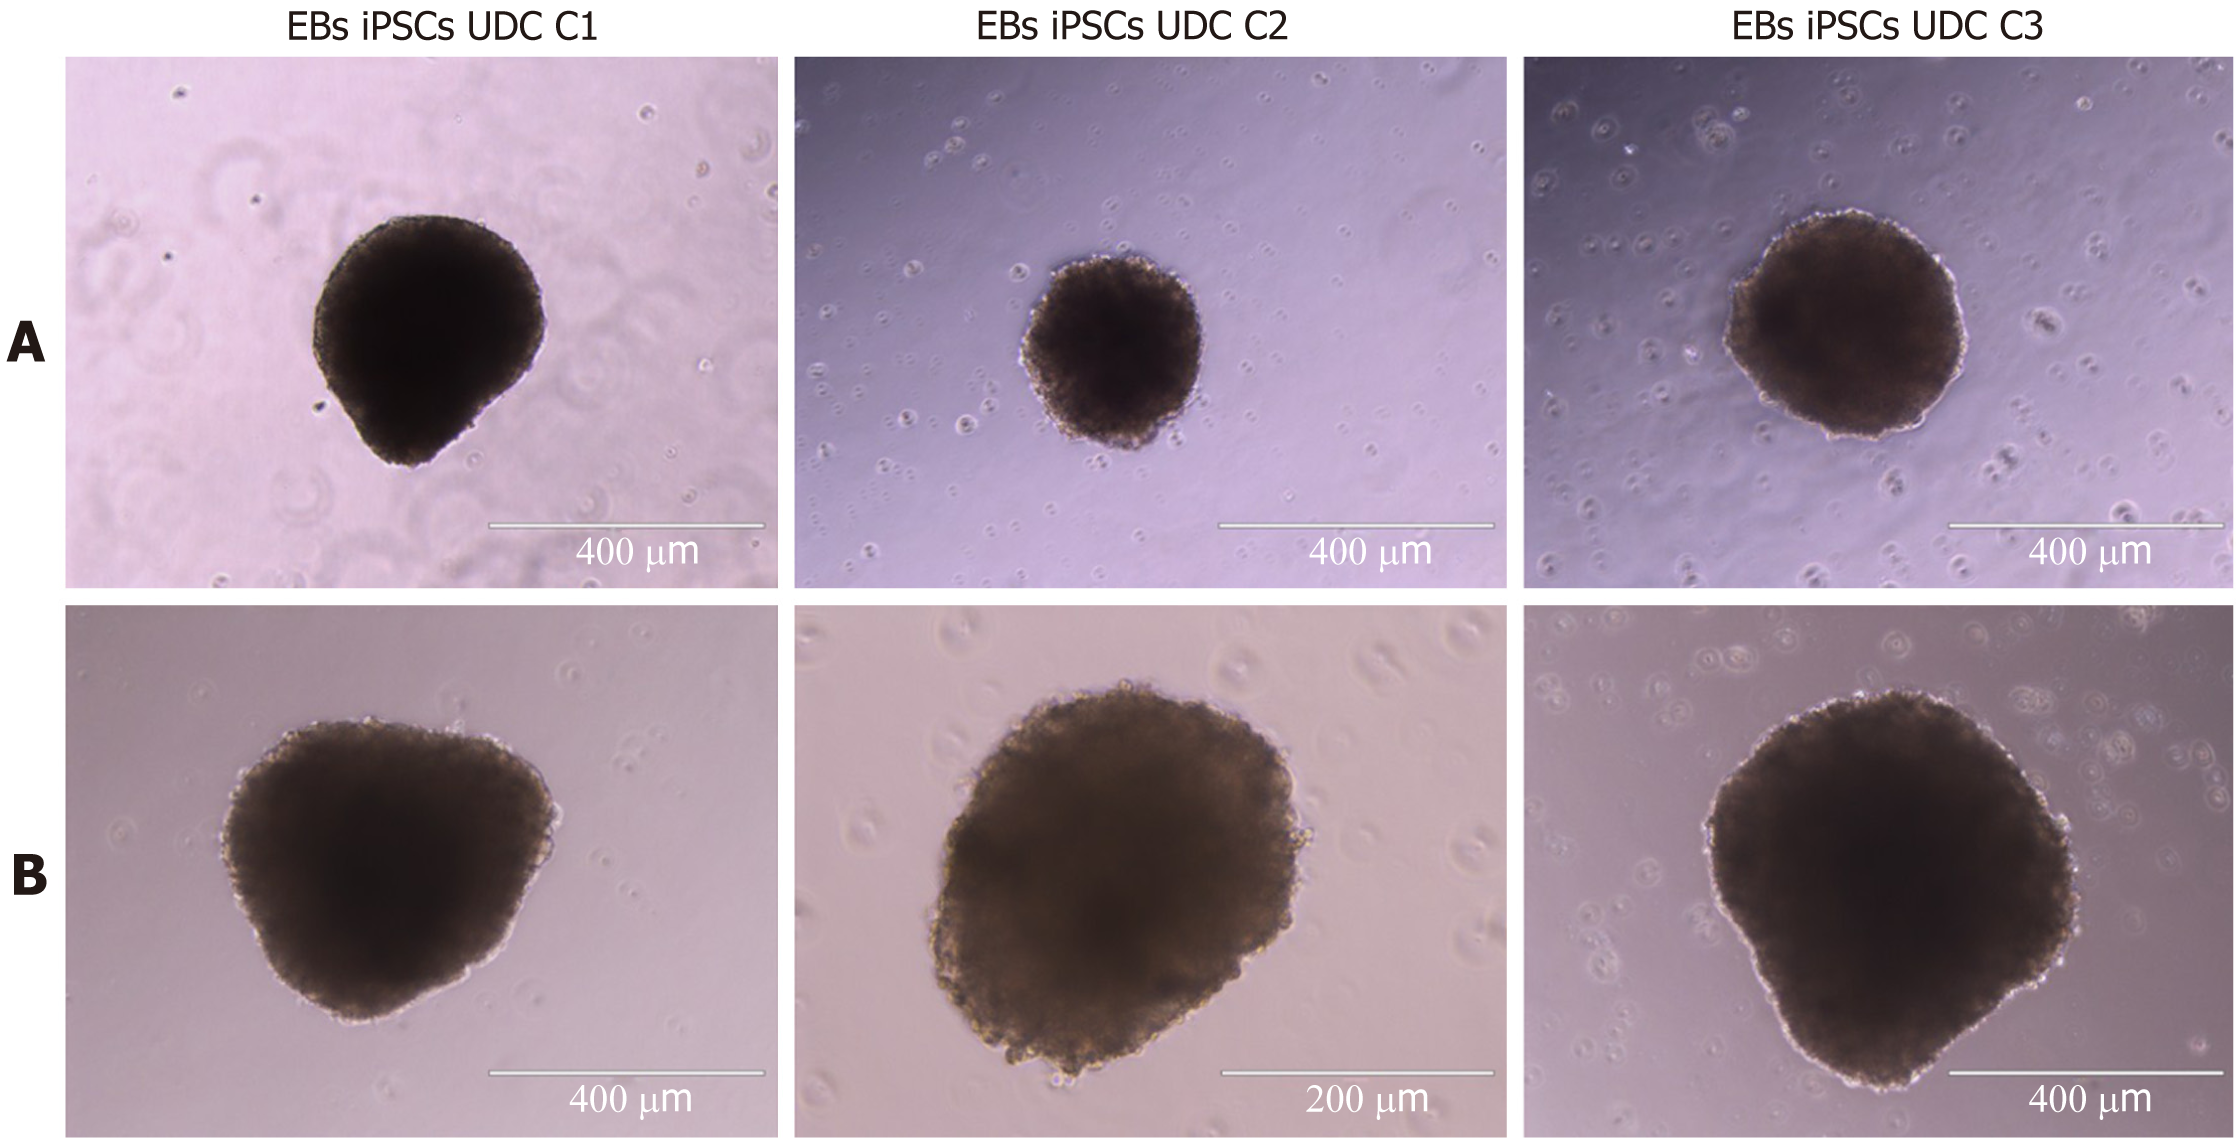
Figure 7 All three clonal induced pluripotent stem cell lineages formed embryoid bodies with typical 3D morphology.
A: Embryoid bodies (EBs) from induced pluripotent stem cells (iPSCs) at passages 15-16 (scale bar = 400 μM); B: EBs from iPSCs at passages 24-15 (scale bar = 400 μM-200 μM). EBs: Embryoid bodies; UDC: Urine-derived cell; iPSCs: Induced pluripotent stem cells.
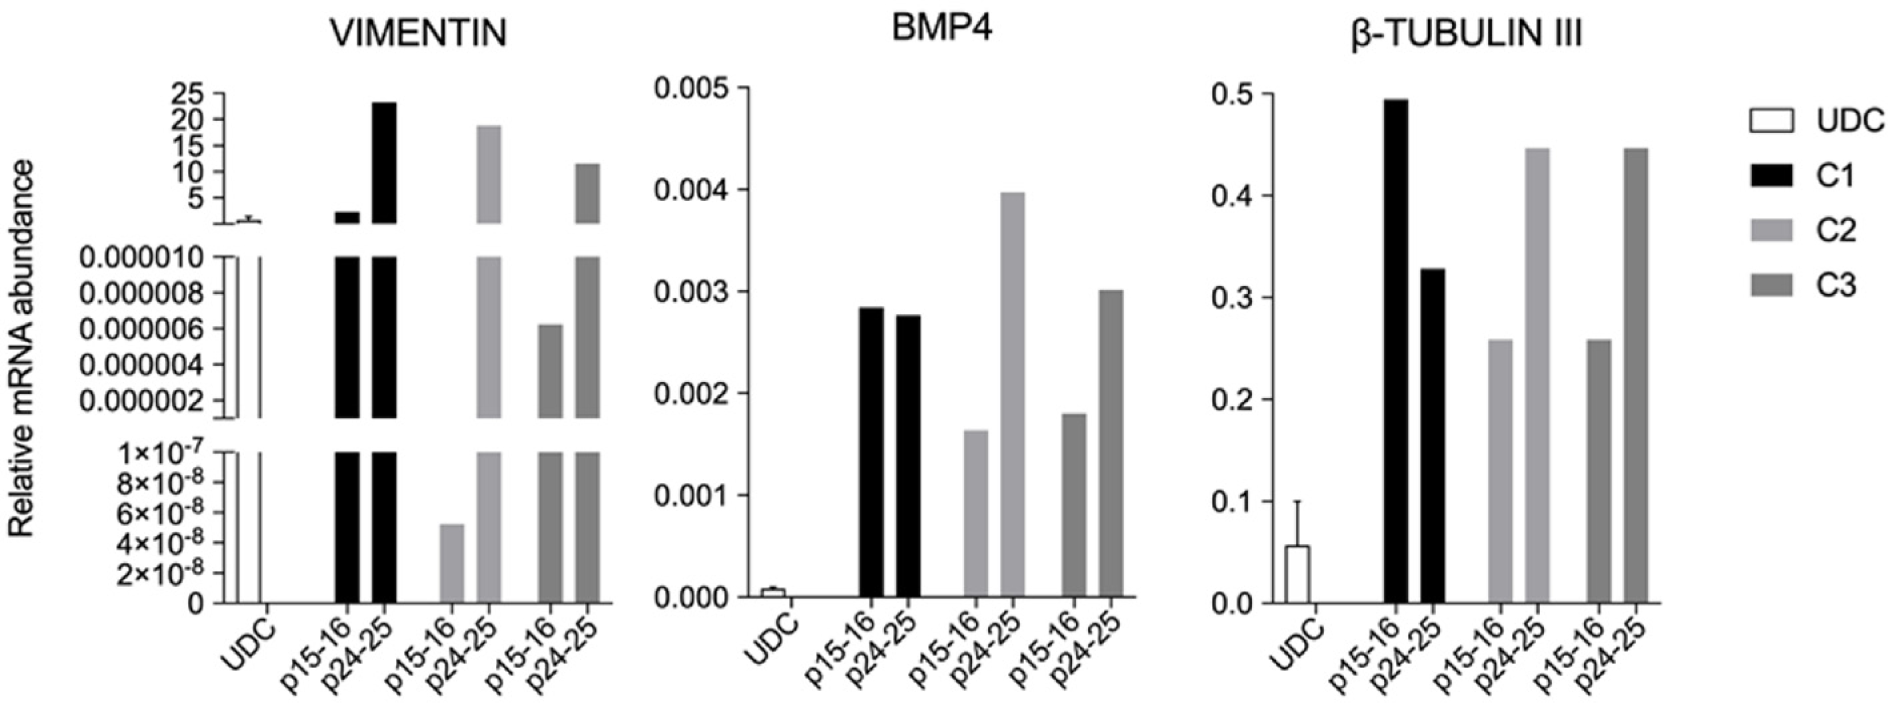
Figure 8 Relative mRNA abundance of urine-derived cells and embryoid bodies derived from the three porcine induced pluripotent stem cells lines showing VIMENTIN, BMP4 and β-TUBULIN-III detection.
Embryoid bodies were analysed when porcine induced pluripotent stem cells were at p15-16 and again at p24-25. UDC: Urine-derived cell.
- Citation: Recchia K, Machado LS, Botigelli RC, Pieri NCG, Barbosa G, de Castro RVG, Marques MG, Pessôa LVF, Fantinato Neto P, Meirelles FV, Souza AF, Martins SMMK, Bressan FF. In vitro induced pluripotency from urine-derived cells in porcine. World J Stem Cells 2022; 14(3): 231-244
- URL: https://www.wjgnet.com/1948-0210/full/v14/i3/231.htm
- DOI: https://dx.doi.org/10.4252/wjsc.v14.i3.231


