Copyright
©The Author(s) 2021.
World J Stem Cells. Apr 26, 2021; 13(4): 317-330
Published online Apr 26, 2021. doi: 10.4252/wjsc.v13.i4.317
Published online Apr 26, 2021. doi: 10.4252/wjsc.v13.i4.317
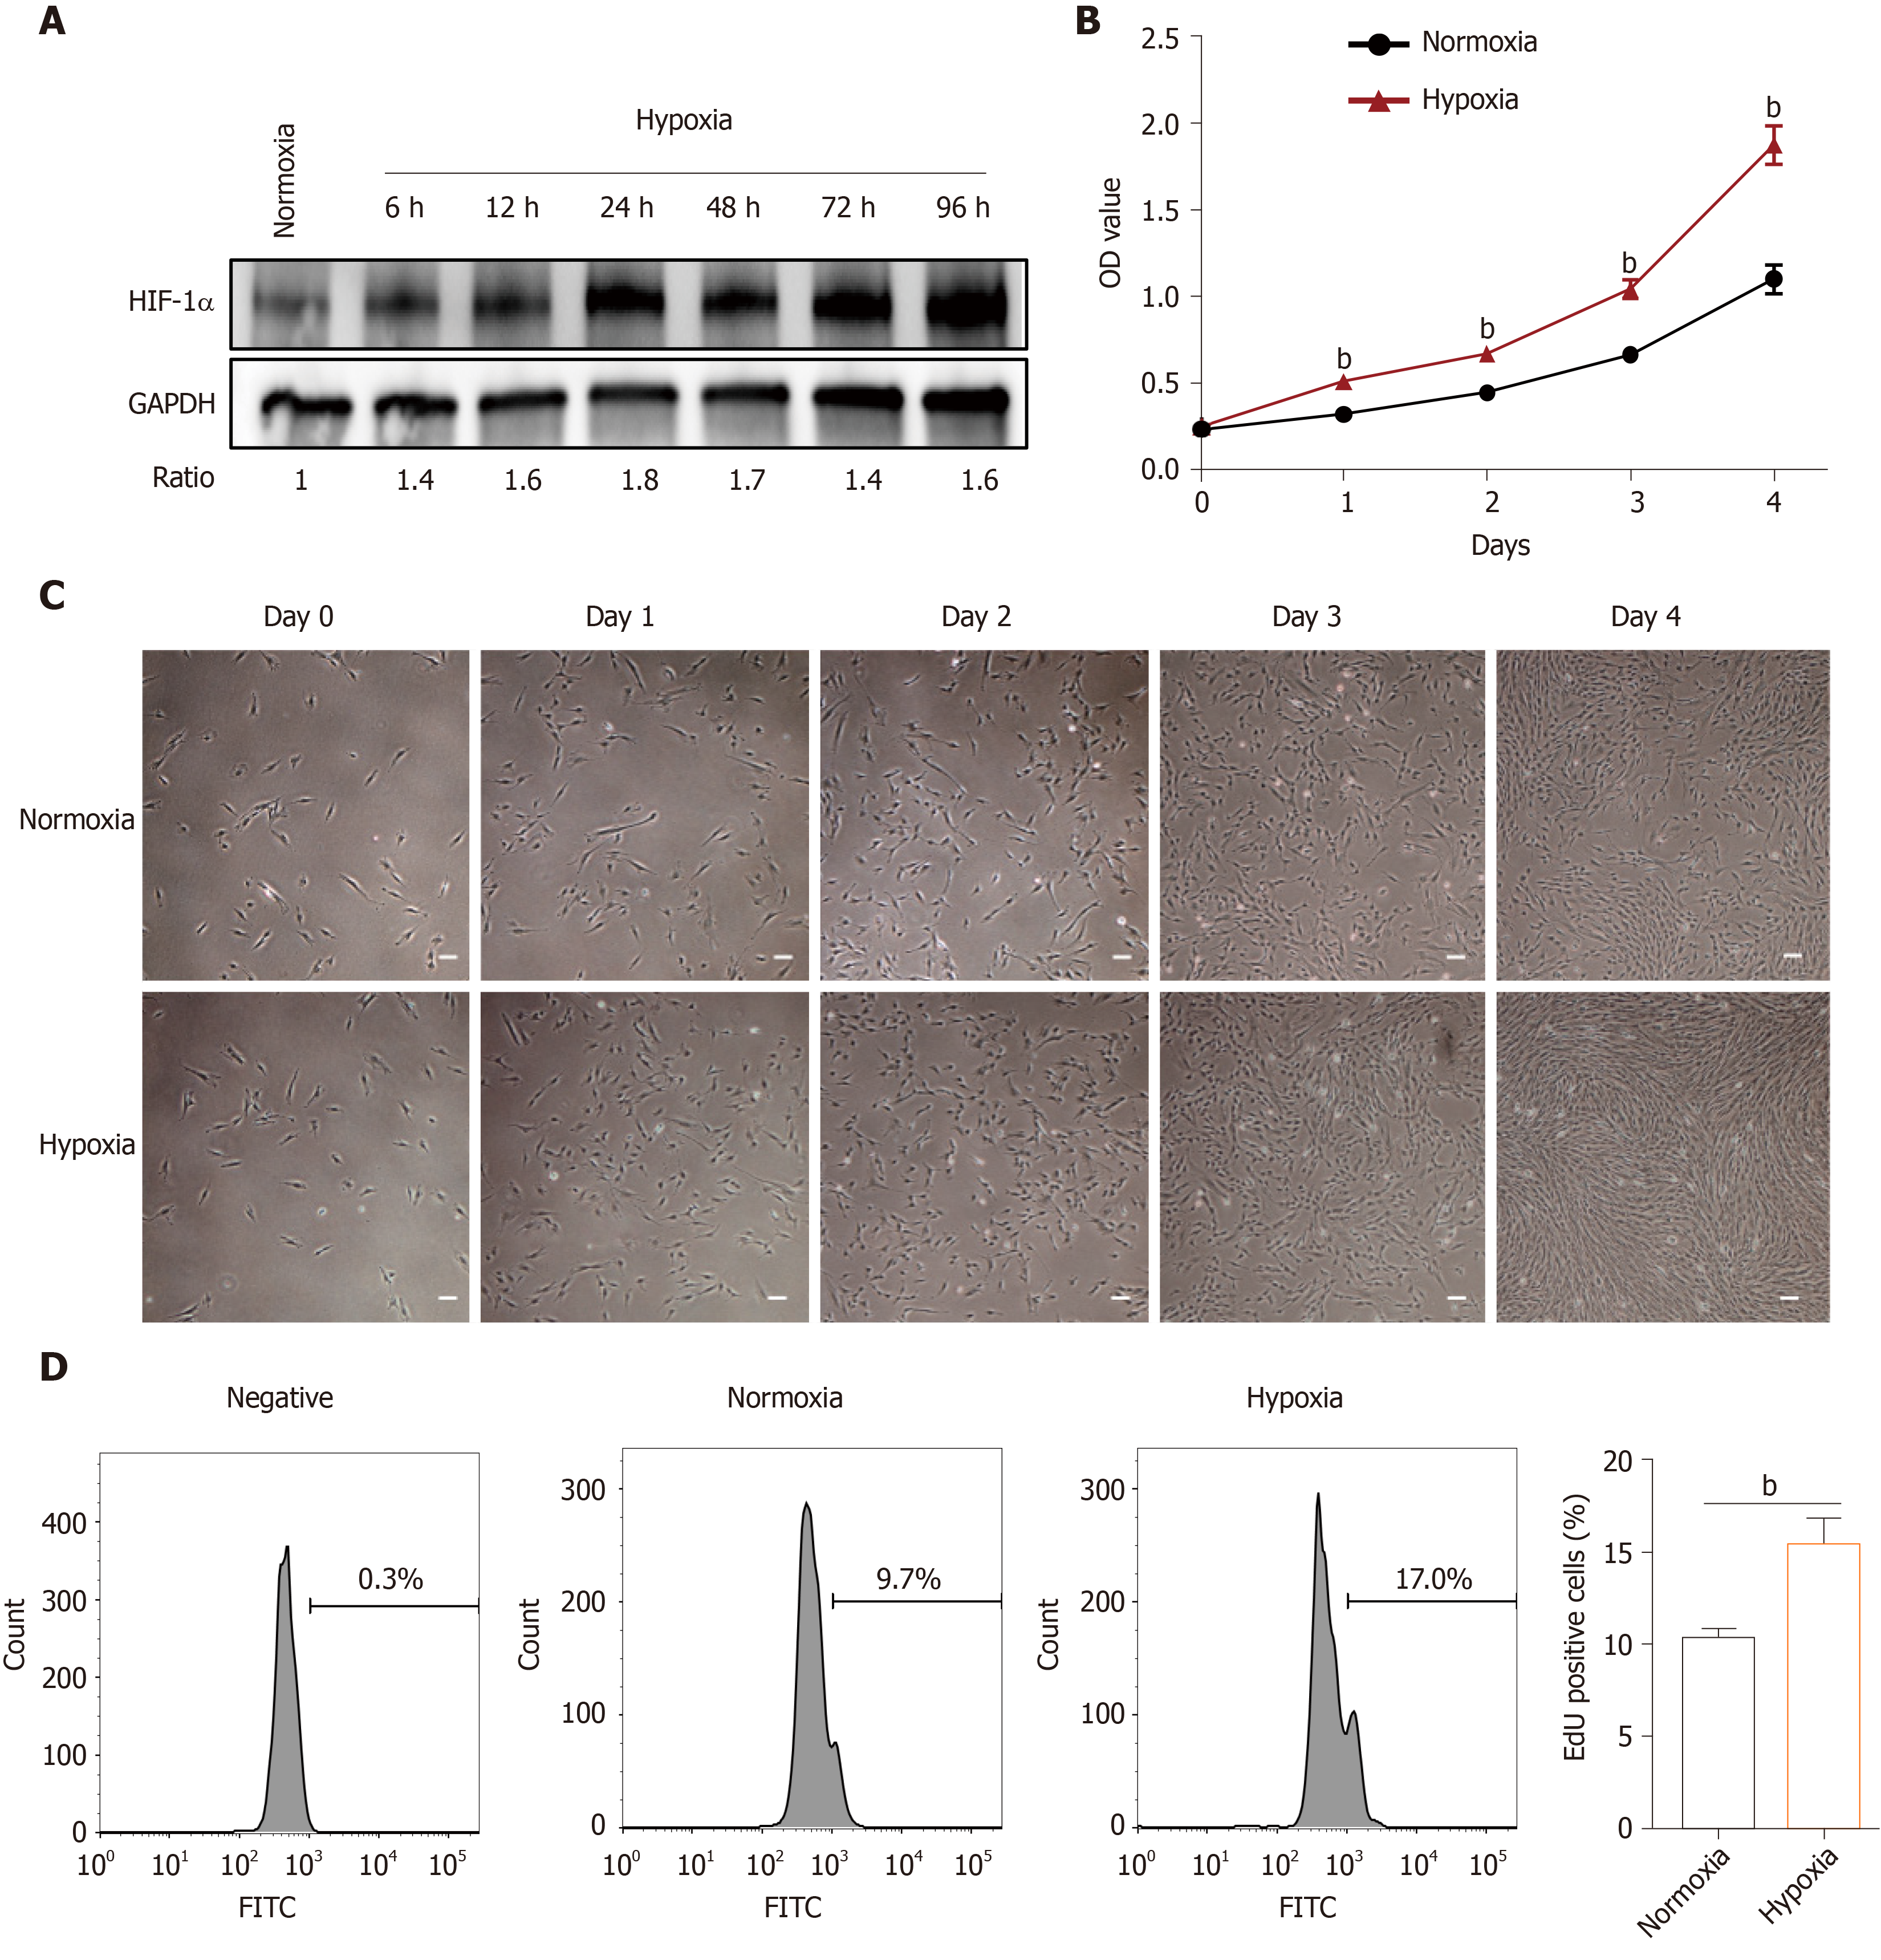
Figure 1 Effect of hypoxia on human placenta-derived mesenchymal stem cell proliferation.
A: Western blotting of hypoxia-inducible factor 1α (HIF-1α) in human placenta-derived mesenchymal stem cells (hP-MSCs) exposed to hypoxia for 6, 12, 24, 48, 72, or 96 h with normalization against glyceraldehyde-3-phosphate dehydrogenase (GAPDH); B: Proliferation of hP-MSCs under hypoxia and normoxia. Data are means ± SD (n = 4); C: Growth of hP-MSCs under hypoxia and normoxia as visualized by optical microscopy (× 4 magnification; scale bars, 100 μm); D: Proliferation rates of hP-MSCs determined by 5-ethynyl-20-deoxyuridine flow cytometry in triplicate and repeated in three independent experiments. OD: Optical density; FITC: Fluorescein isothiocyanate.
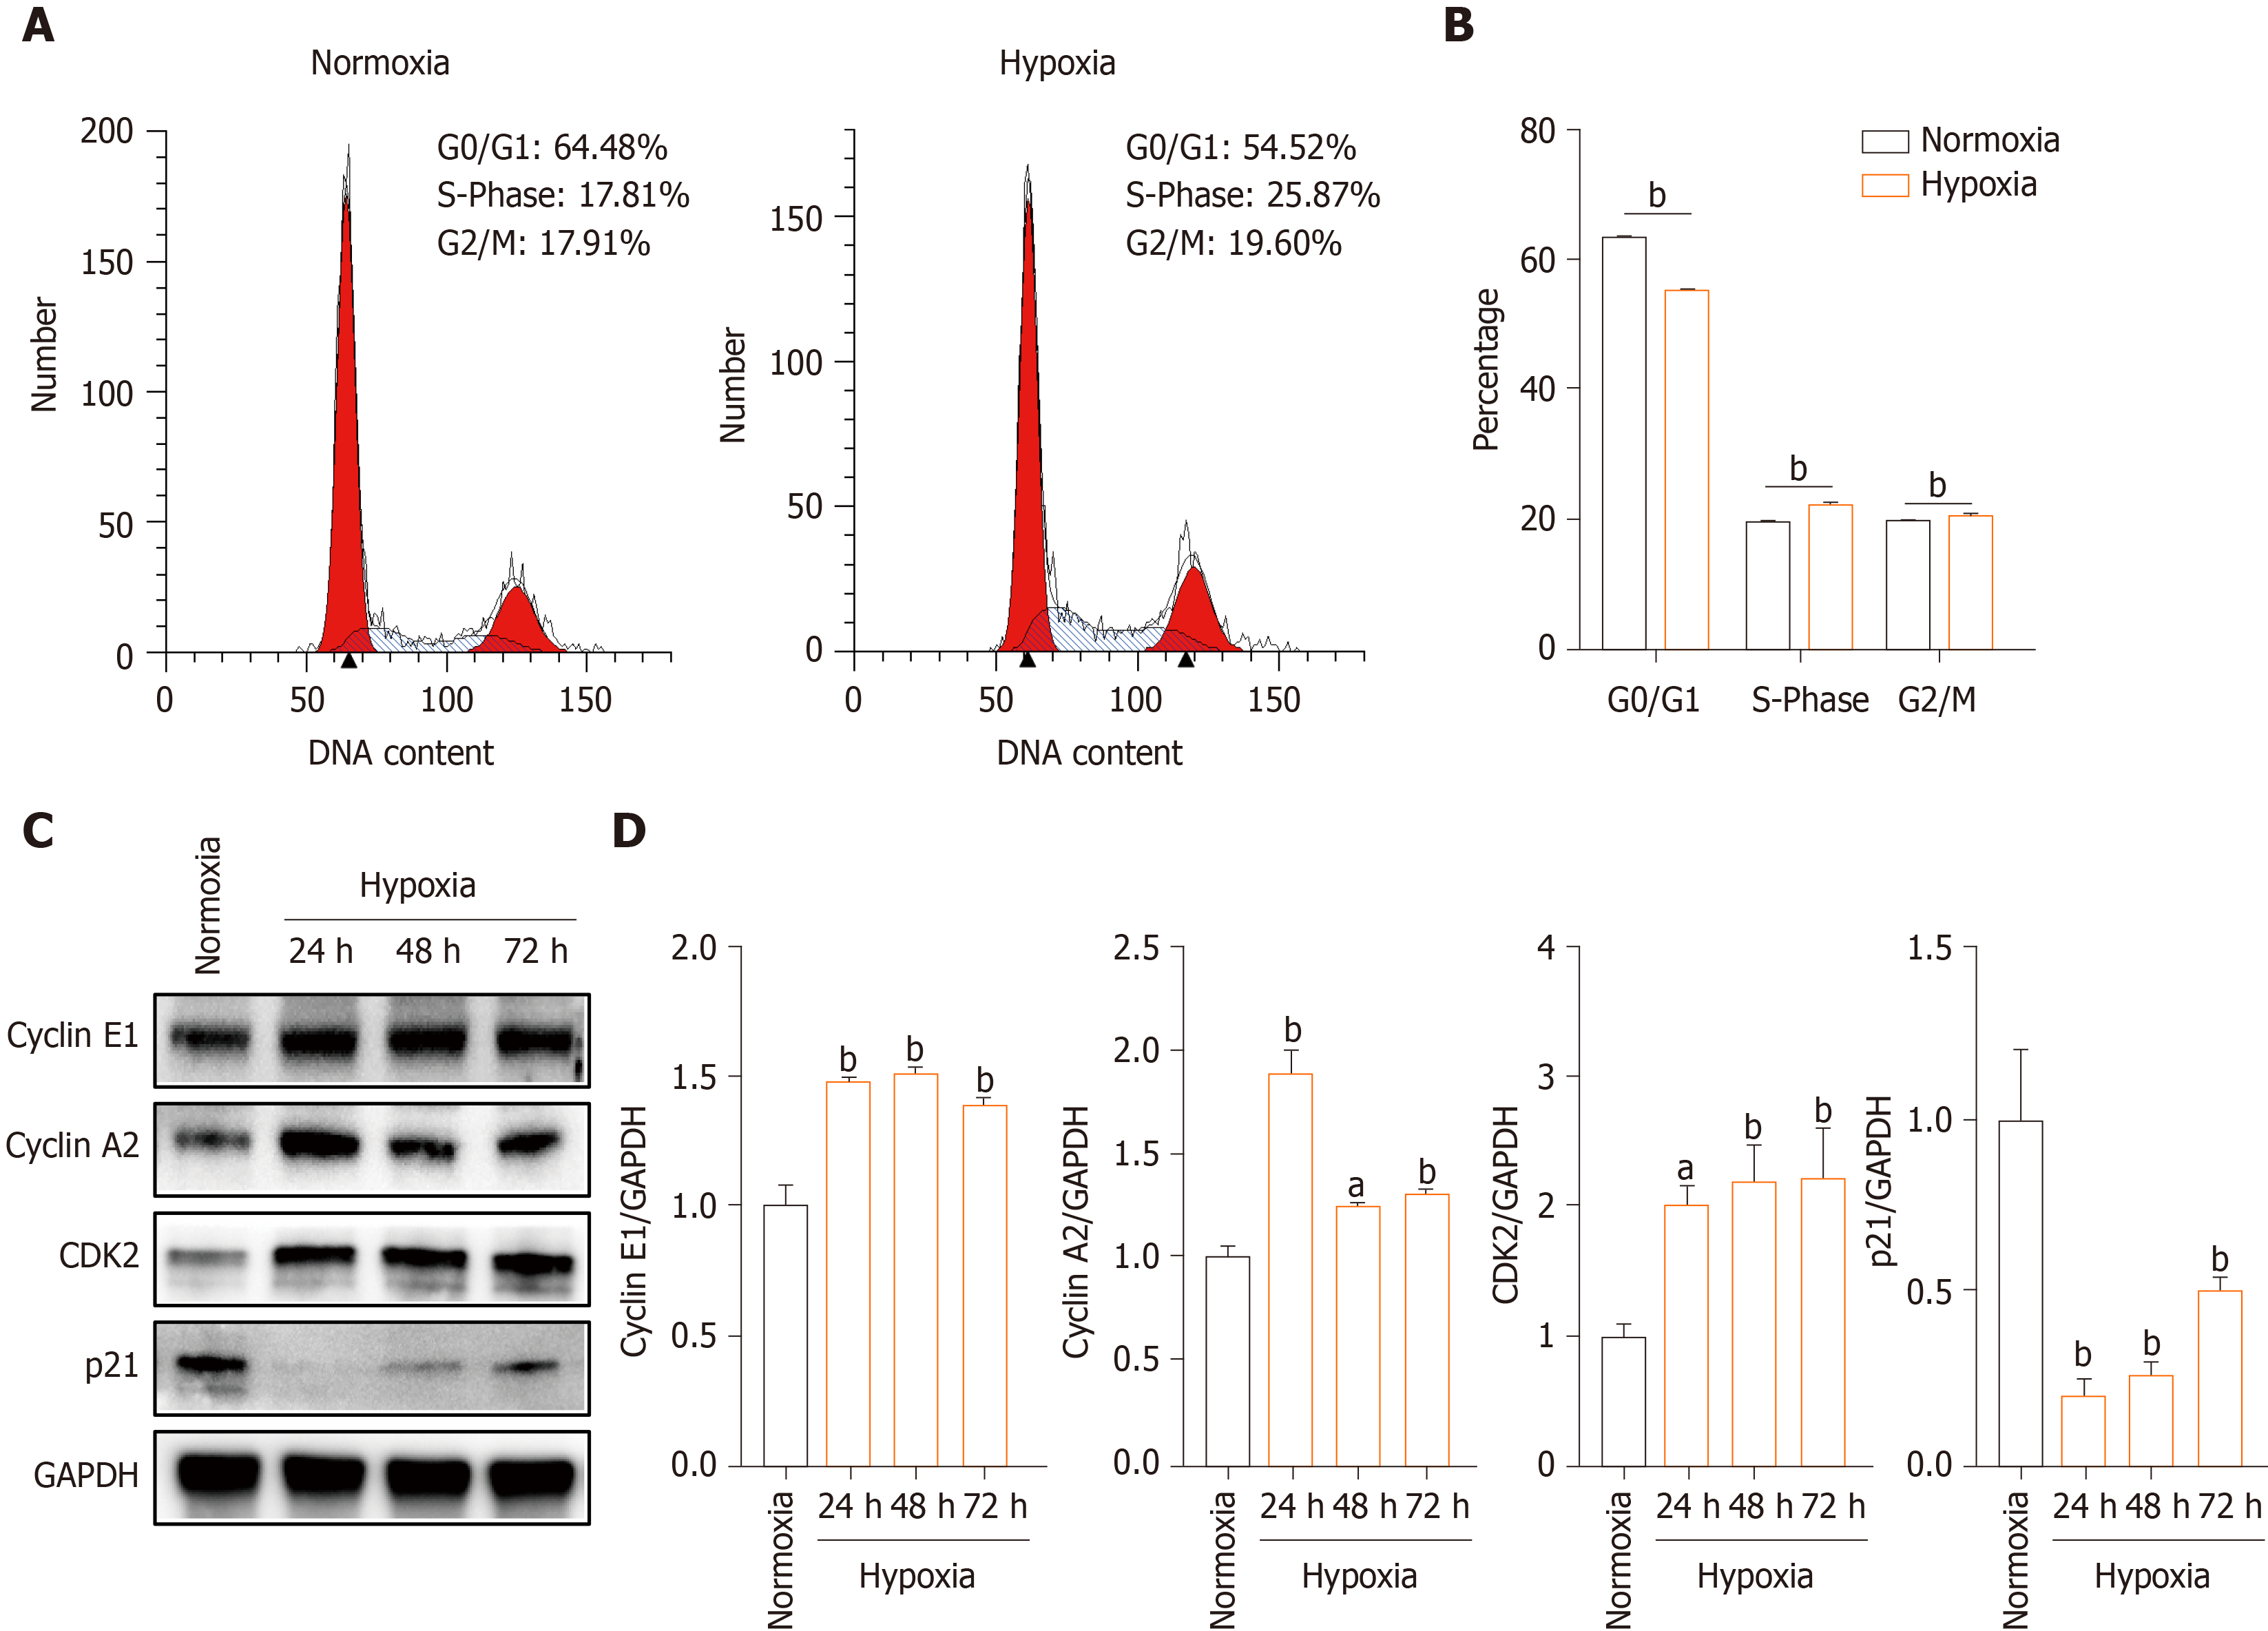
Figure 2 Hypoxia promotes cell cycle progression in human placenta-derived mesenchymal stem cells.
A: Cell cycle phase distribution of human placenta-derived mesenchymal stem cells (hP-MSCs) cultured under hypoxia and normoxia for 48 h and assayed by flow cytometry; B: Graph of the cell cycle distribution. Data are means ± SD (n = 3); Student’s t-test; C: Western blotting of cyclin E1, cyclin A2, CDK2, and p21 in hP-MSCs exposed to hypoxia for 24, 48, or 72 h; D: Cyclin E1, cyclin A2, CDK2, and p21 expression levels normalized against glyceraldehyde-3-phosphate dehydrogenase (GAPDH). Data are means ± SD (n = 3). aP < 0.05 and bP < 0.01.
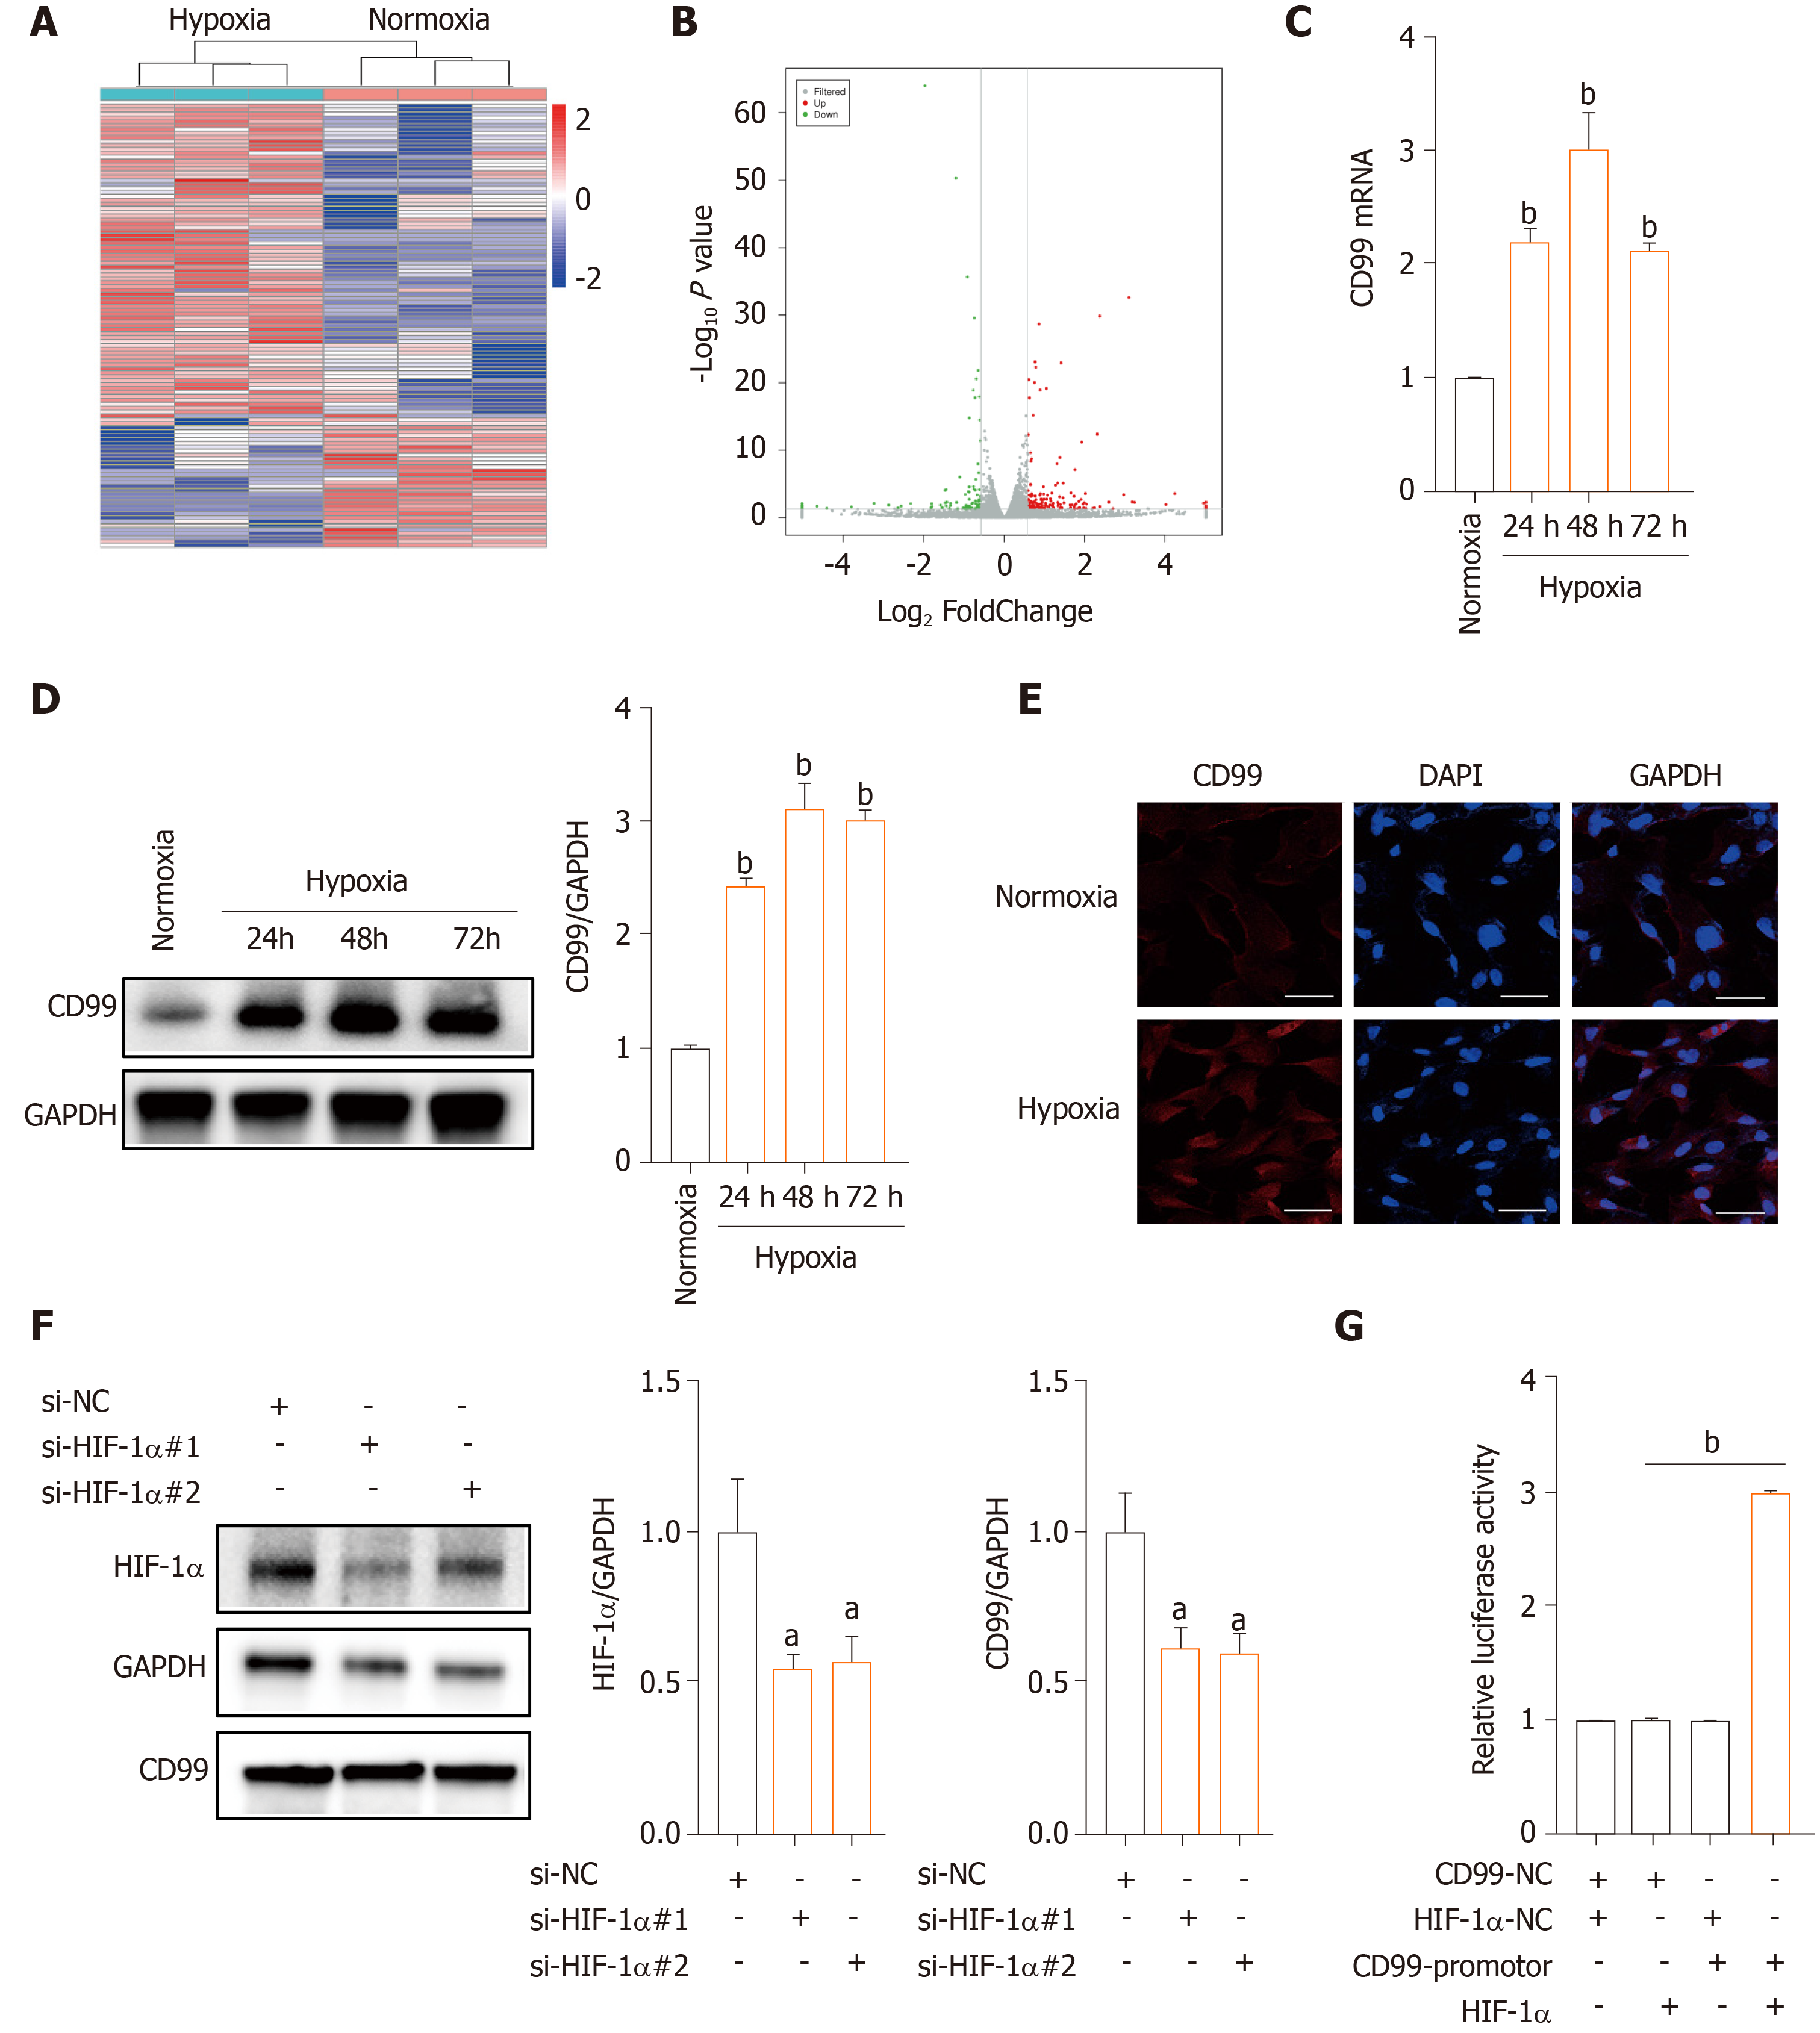
Figure 3 Hypoxia induces hypoxia-inducible factor 1α-mediated CD99 expression.
A: Heat map showing hierarchical clustering of differentially expressed genes (DEGs) human placenta-derived mesenchymal stem cells (hP-MSCs) cultured under hypoxia and normoxia for 48 h; B: Volcano plot of DEGs; C: Effect of hypoxia on CD99 expression in hP-MSCs by real-time quantitative polymerase chain reaction. Data are means ± SD (n = 3); Student’s t-test. bP < 0.01 vs normoxia; D: Western blotting of CD99 in hP-MSCs exposed to hypoxia for 24, 48, or 72 h with normalization against glyceraldehyde-3-phosphate dehydrogenase (GAPDH). Data are means ± SD (n = 3). bP < 0.01 vs normoxia; E: Immunofluorescence microscopy of CD99 on hP-MSCs cultured under hypoxia and normoxia for 48 h (× 20 magnification; scale bars, 50 μm); F: Western blotting of hypoxia-inducible factor 1α (HIF-1α) and CD99 expression in hP-MSCs exposed to hypoxia for 48 h after pretreatment with HIF-1α-specific small interfering RNAs (si-HIF-1α#1 and si-HIF-1α#2) with normalization against GAPDH. Data are means ± SD (n = 3). aP < 0.05 vs si-NC; G: Relative luciferase activity of a CD99 reporter plasmid in HEK-293 cells co-transfected with an HIF-1α activation vector after 48 h. Data are means ± SD (n = 3). bP < 0.01. NC: Negative control.
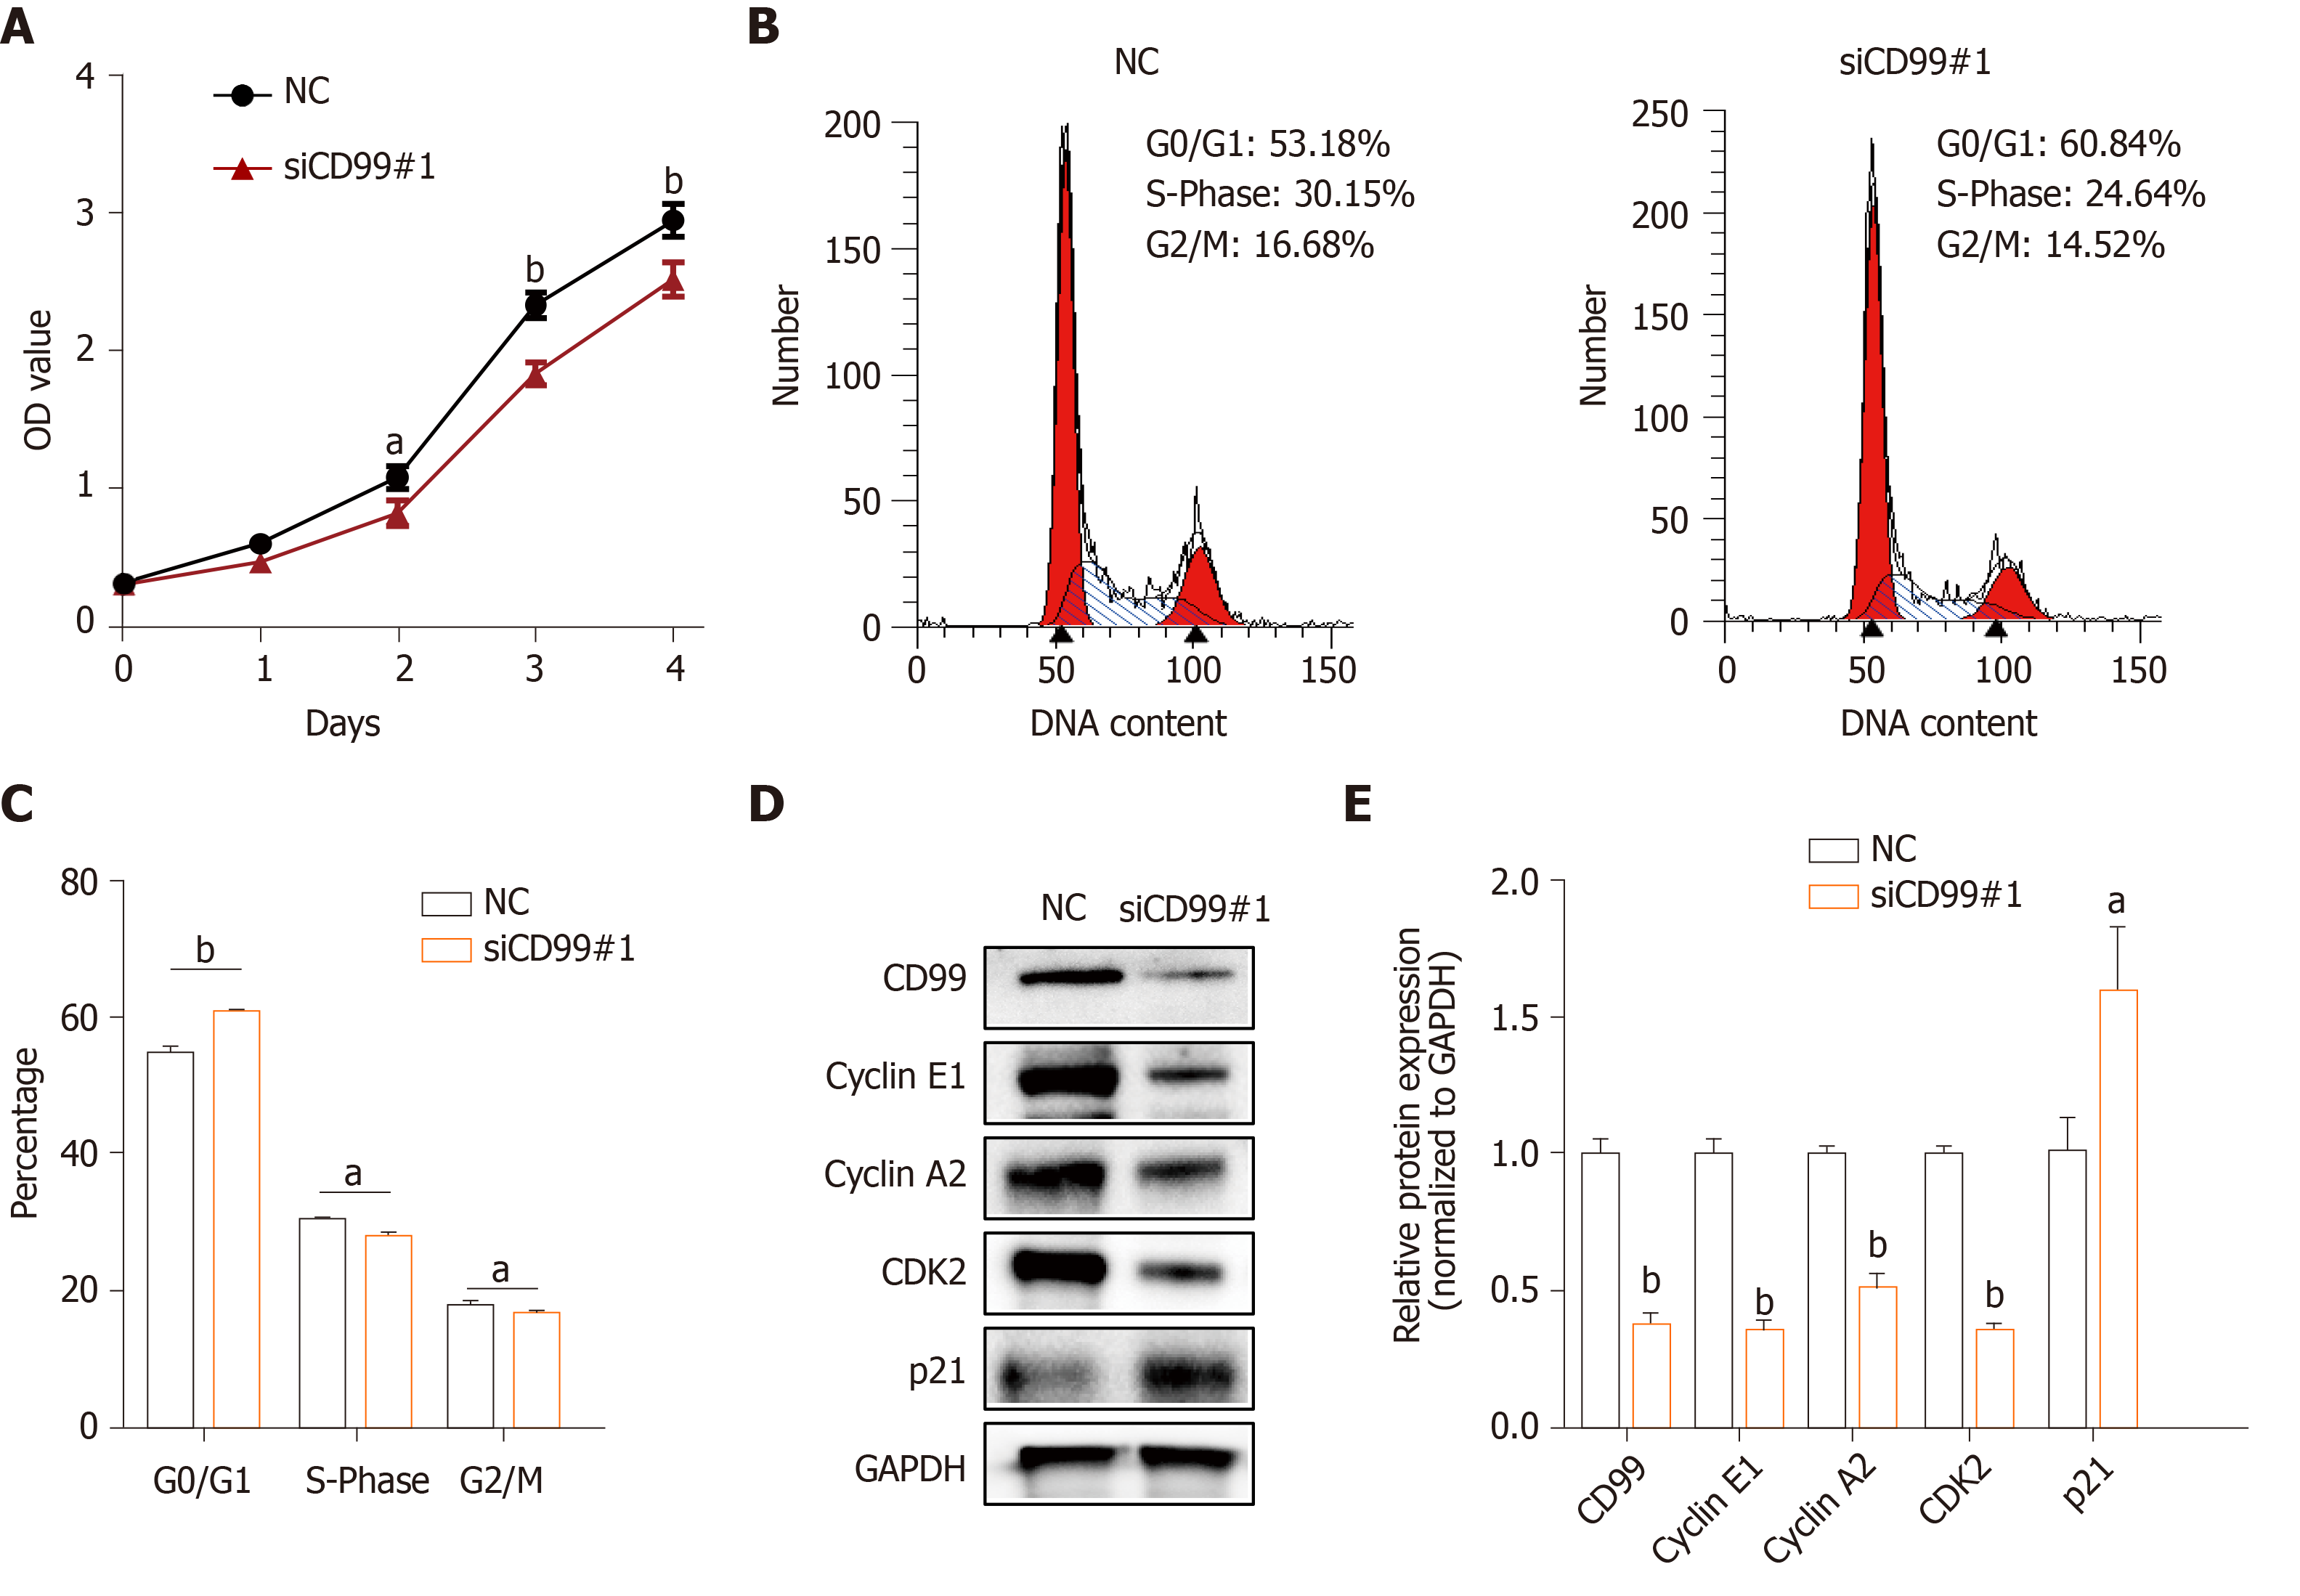
Figure 4 Effect of CD99 expression on human placenta-derived mesenchymal stem cells proliferation under hypoxia.
A: Proliferation of human placenta-derived mesenchymal stem cells (hP-MSCs) cultured under hypoxia after pretreatment with CD99-specific small interfering RNAs (siCD99#1). Data are means ± SD (n = 4); B: Cell cycle phase distribution of hP-MSCs cultured under hypoxia after pretreatment with siCD99#1 and assayed by flow cytometry; C: Graph of the cell cycle distribution. Data are means ± SD (n = 3); Student’s t-test; D: Western blotting of CD99, cyclin E1, cyclin A2, CDK2, and p21 in hP-MSCs cultured under hypoxia for 48 h after pretreatment with siCD99#1; E: Expression levels of CD99, cyclin E1, cyclin A2, CDK2, and p21 normalized against that of glyceraldehyde-3-phosphate dehydrogenase (GAPDH). Data are means ± SD (n = 3). aP < 0.05 and bP < 0.01. NC: Negative control; OD: Optical density.
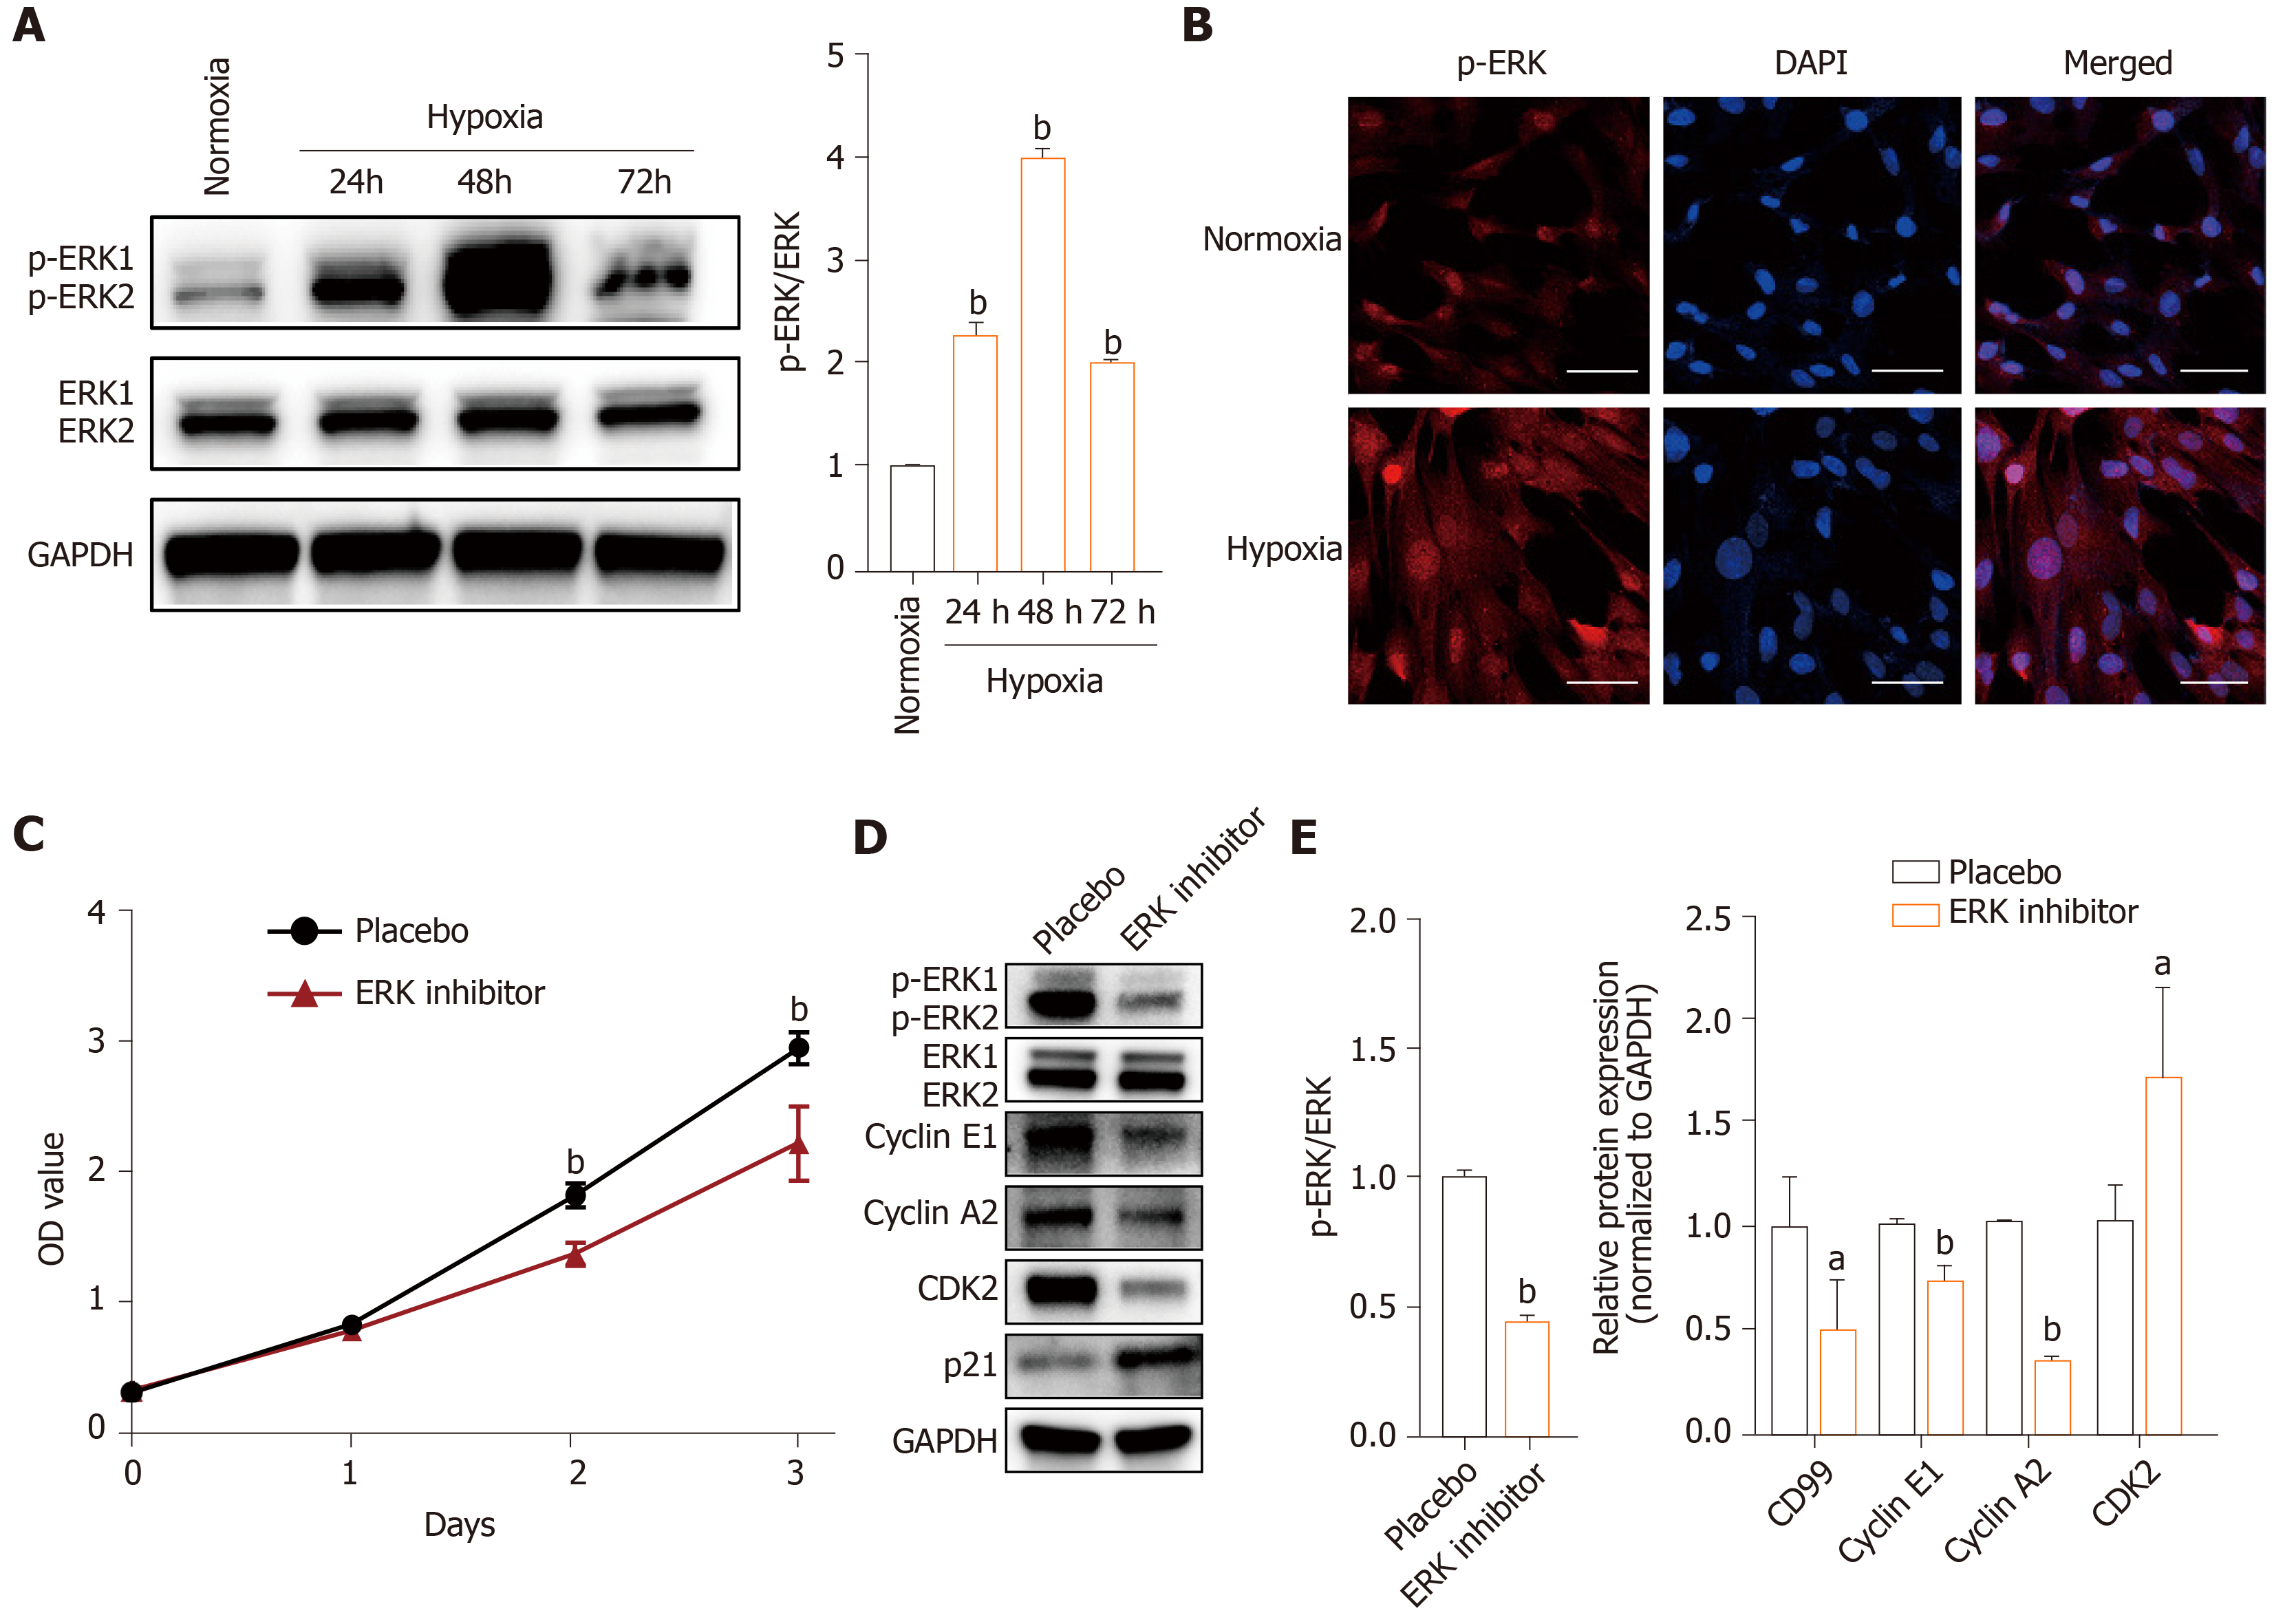
Figure 5 Hypoxia activates MAPK/ERK signaling and promotes human placenta-derived mesenchymal stem cells proliferation.
A: Western blotting of phosphorylated (p)-ERK) in human placenta-derived mesenchymal stem cells (hP-MSCs) exposed to hypoxia for 24, 48, or 72 h normalized against ERK; B: Immunofluorescence microscopy of p-ERK in hP-MSCs cultured under hypoxia and normoxia for 48 h (× 20 magnification; scale bars, 50 μm); C: Proliferation of hP-MSCs cultured under hypoxia after pretreatment with the ERK1/2 signaling inhibitor PD98059 (50 μmol/L). Data are means ± SD (n = 4); D: Western blotting of p-ERK, ERK, cyclin E1, cyclin A2, CDK2, and p21 in hP-MSCs cultured under hypoxia for 48 h after pretreatment with PD98059; E: Expression of p-ERK normalized against that of ERK and cyclin E1, cyclin A2, CDK2, and p21 expression normalized against that of glyceraldehyde-3-phosphate dehydrogenase (GAPDH). Data are means ± SD (n = 3). aP < 0.05 and bP < 0.01. p-ERK: OD: Optical density.
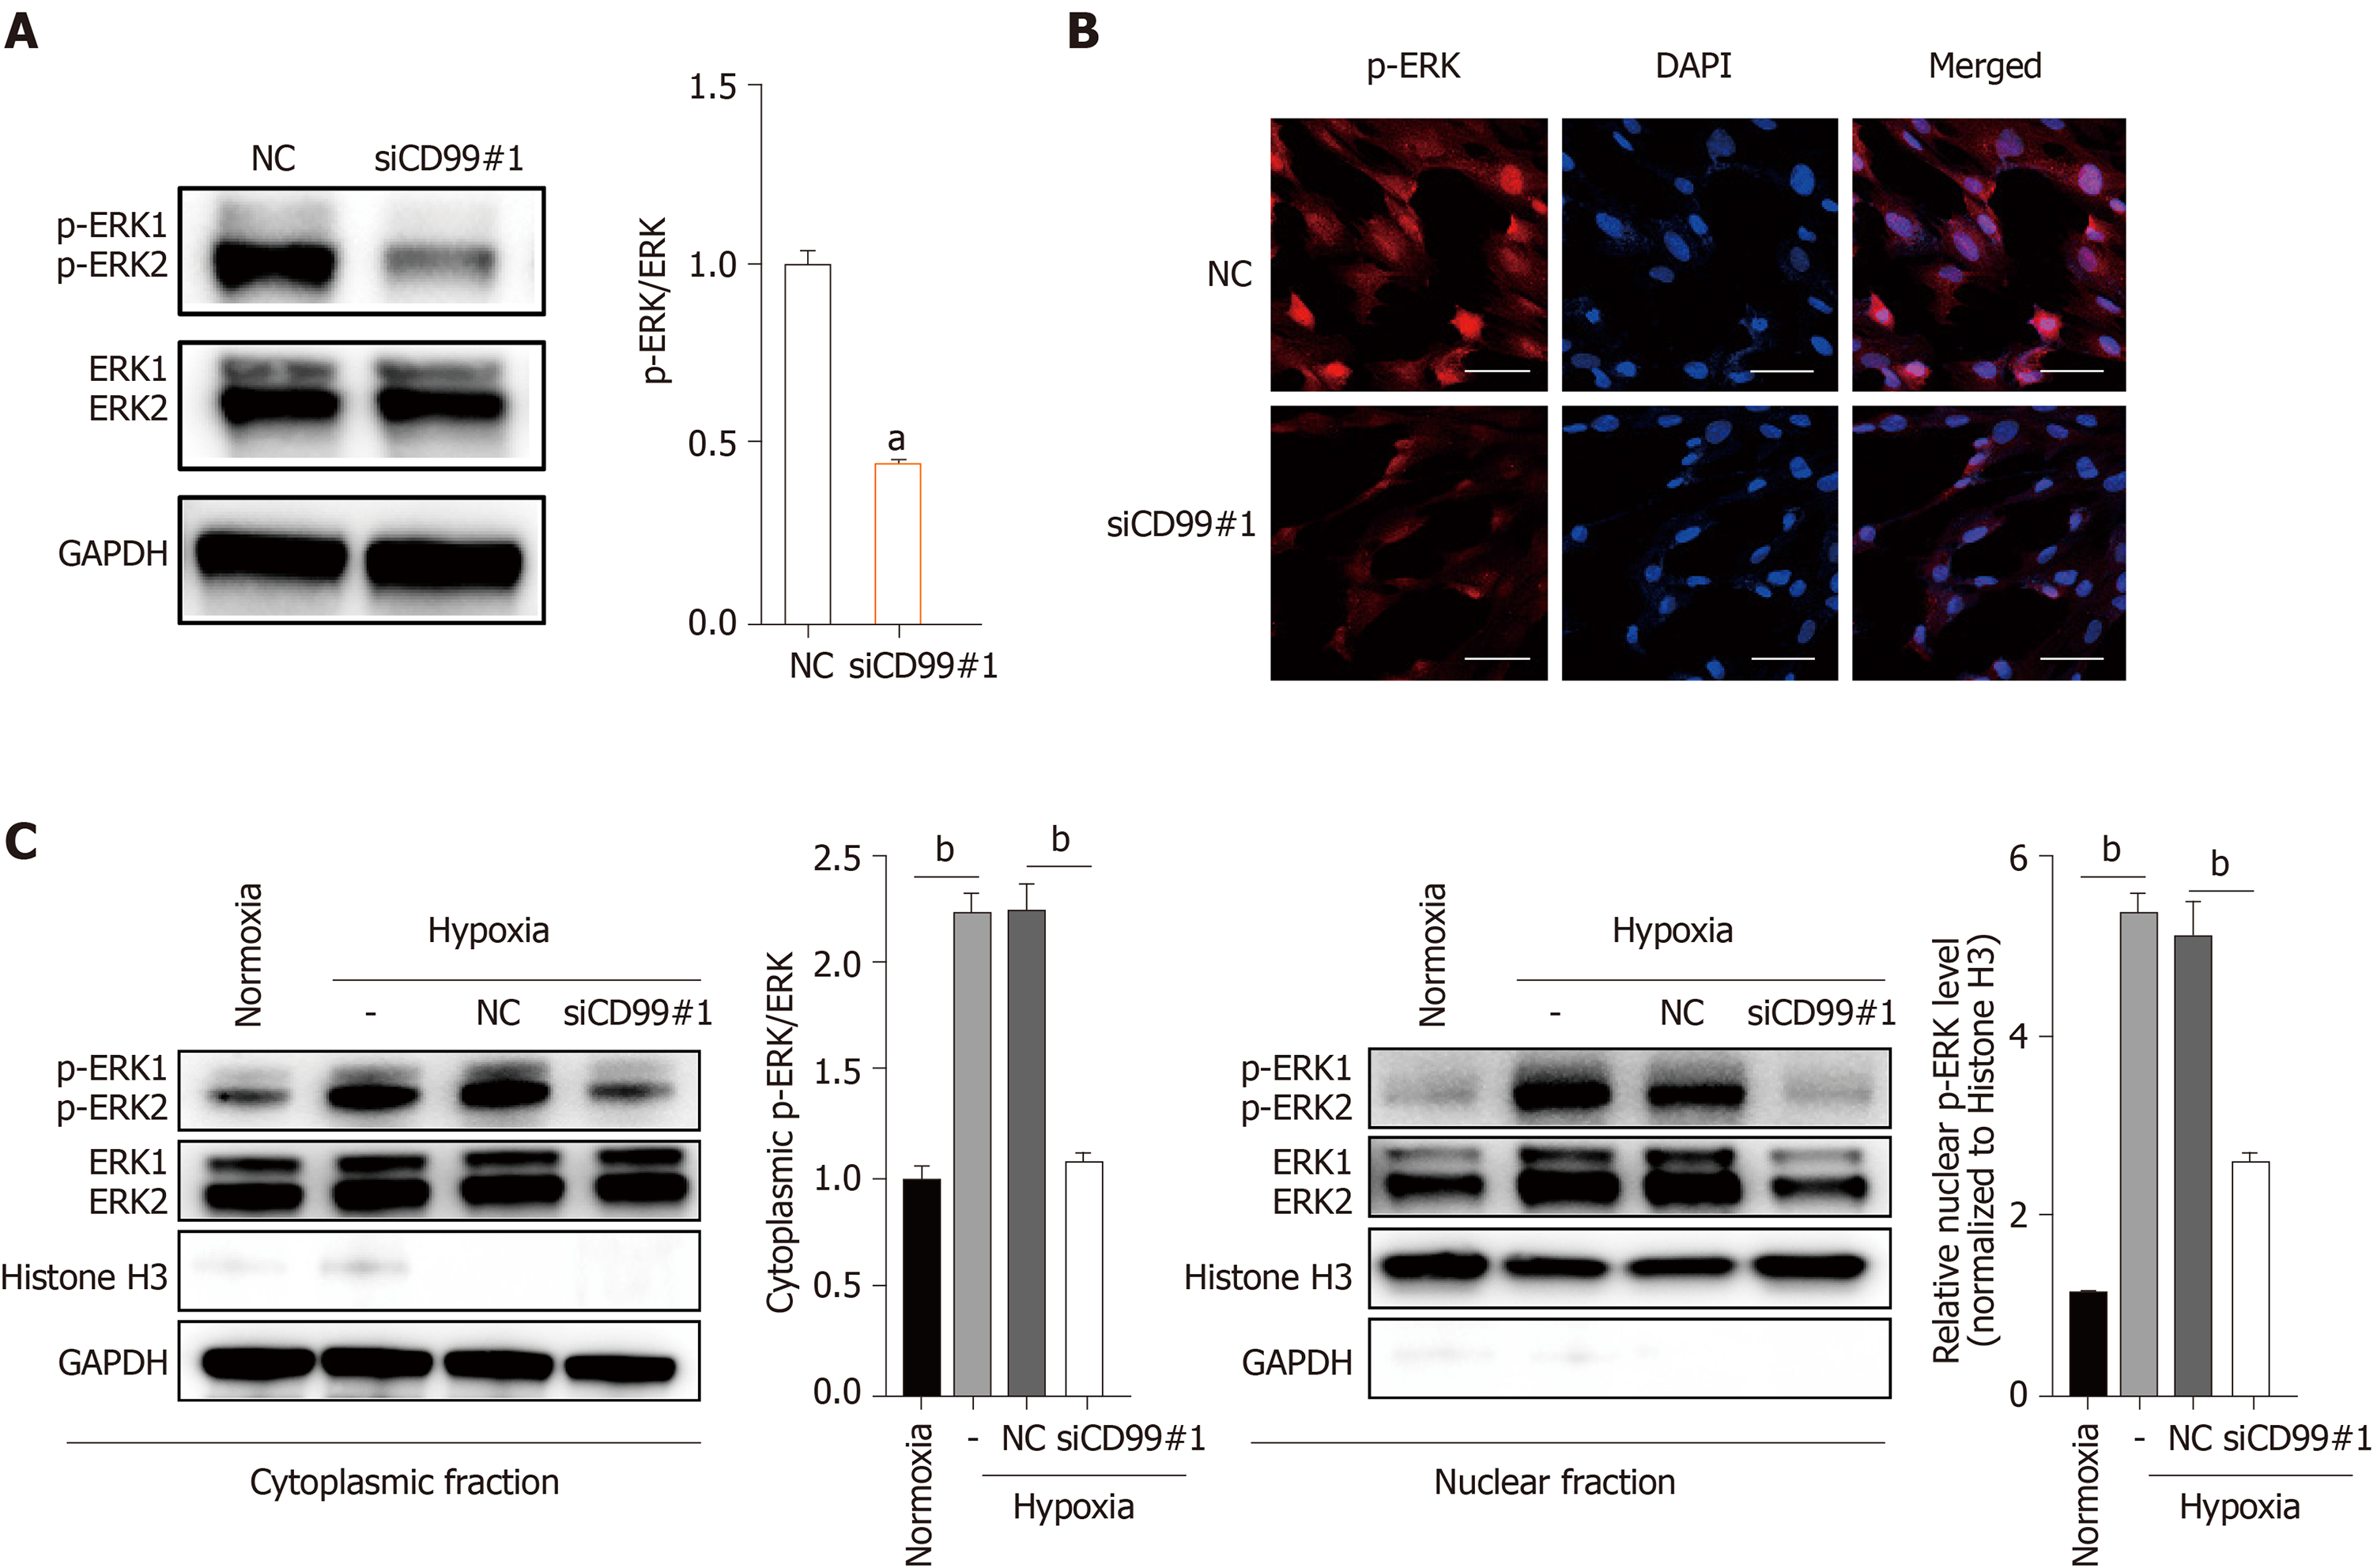
Figure 6 Hypoxia-induced CD99 expression modulates human placenta-derived mesenchymal stem cells proliferation via the MAPK/ERK signaling pathway.
A: Western blotting of phosphorylated (p)-ERK phosphorylation in human placenta-derived mesenchymal stem cells (hP-MSCs) exposed to hypoxia for 48 h and pretreated with siCD99#1; B: Immunofluorescence microscopy of (p-ERK) in hP-MSCs cultured under hypoxia for 48 h and pretreated with siCD99#1 (× 20 magnification; scale bars, 50 μm); C: Western blotting of cytoplasmic and nuclear fractions of hP-MSCs cultured under hypoxia for 48 h and pretreated with siCD99#1. p-ERK expression was normalized against that of ERK or histone H3. Data are means ± SD (n = 3). aP < 0.05 and bP < 0.01. OD: Optical density.
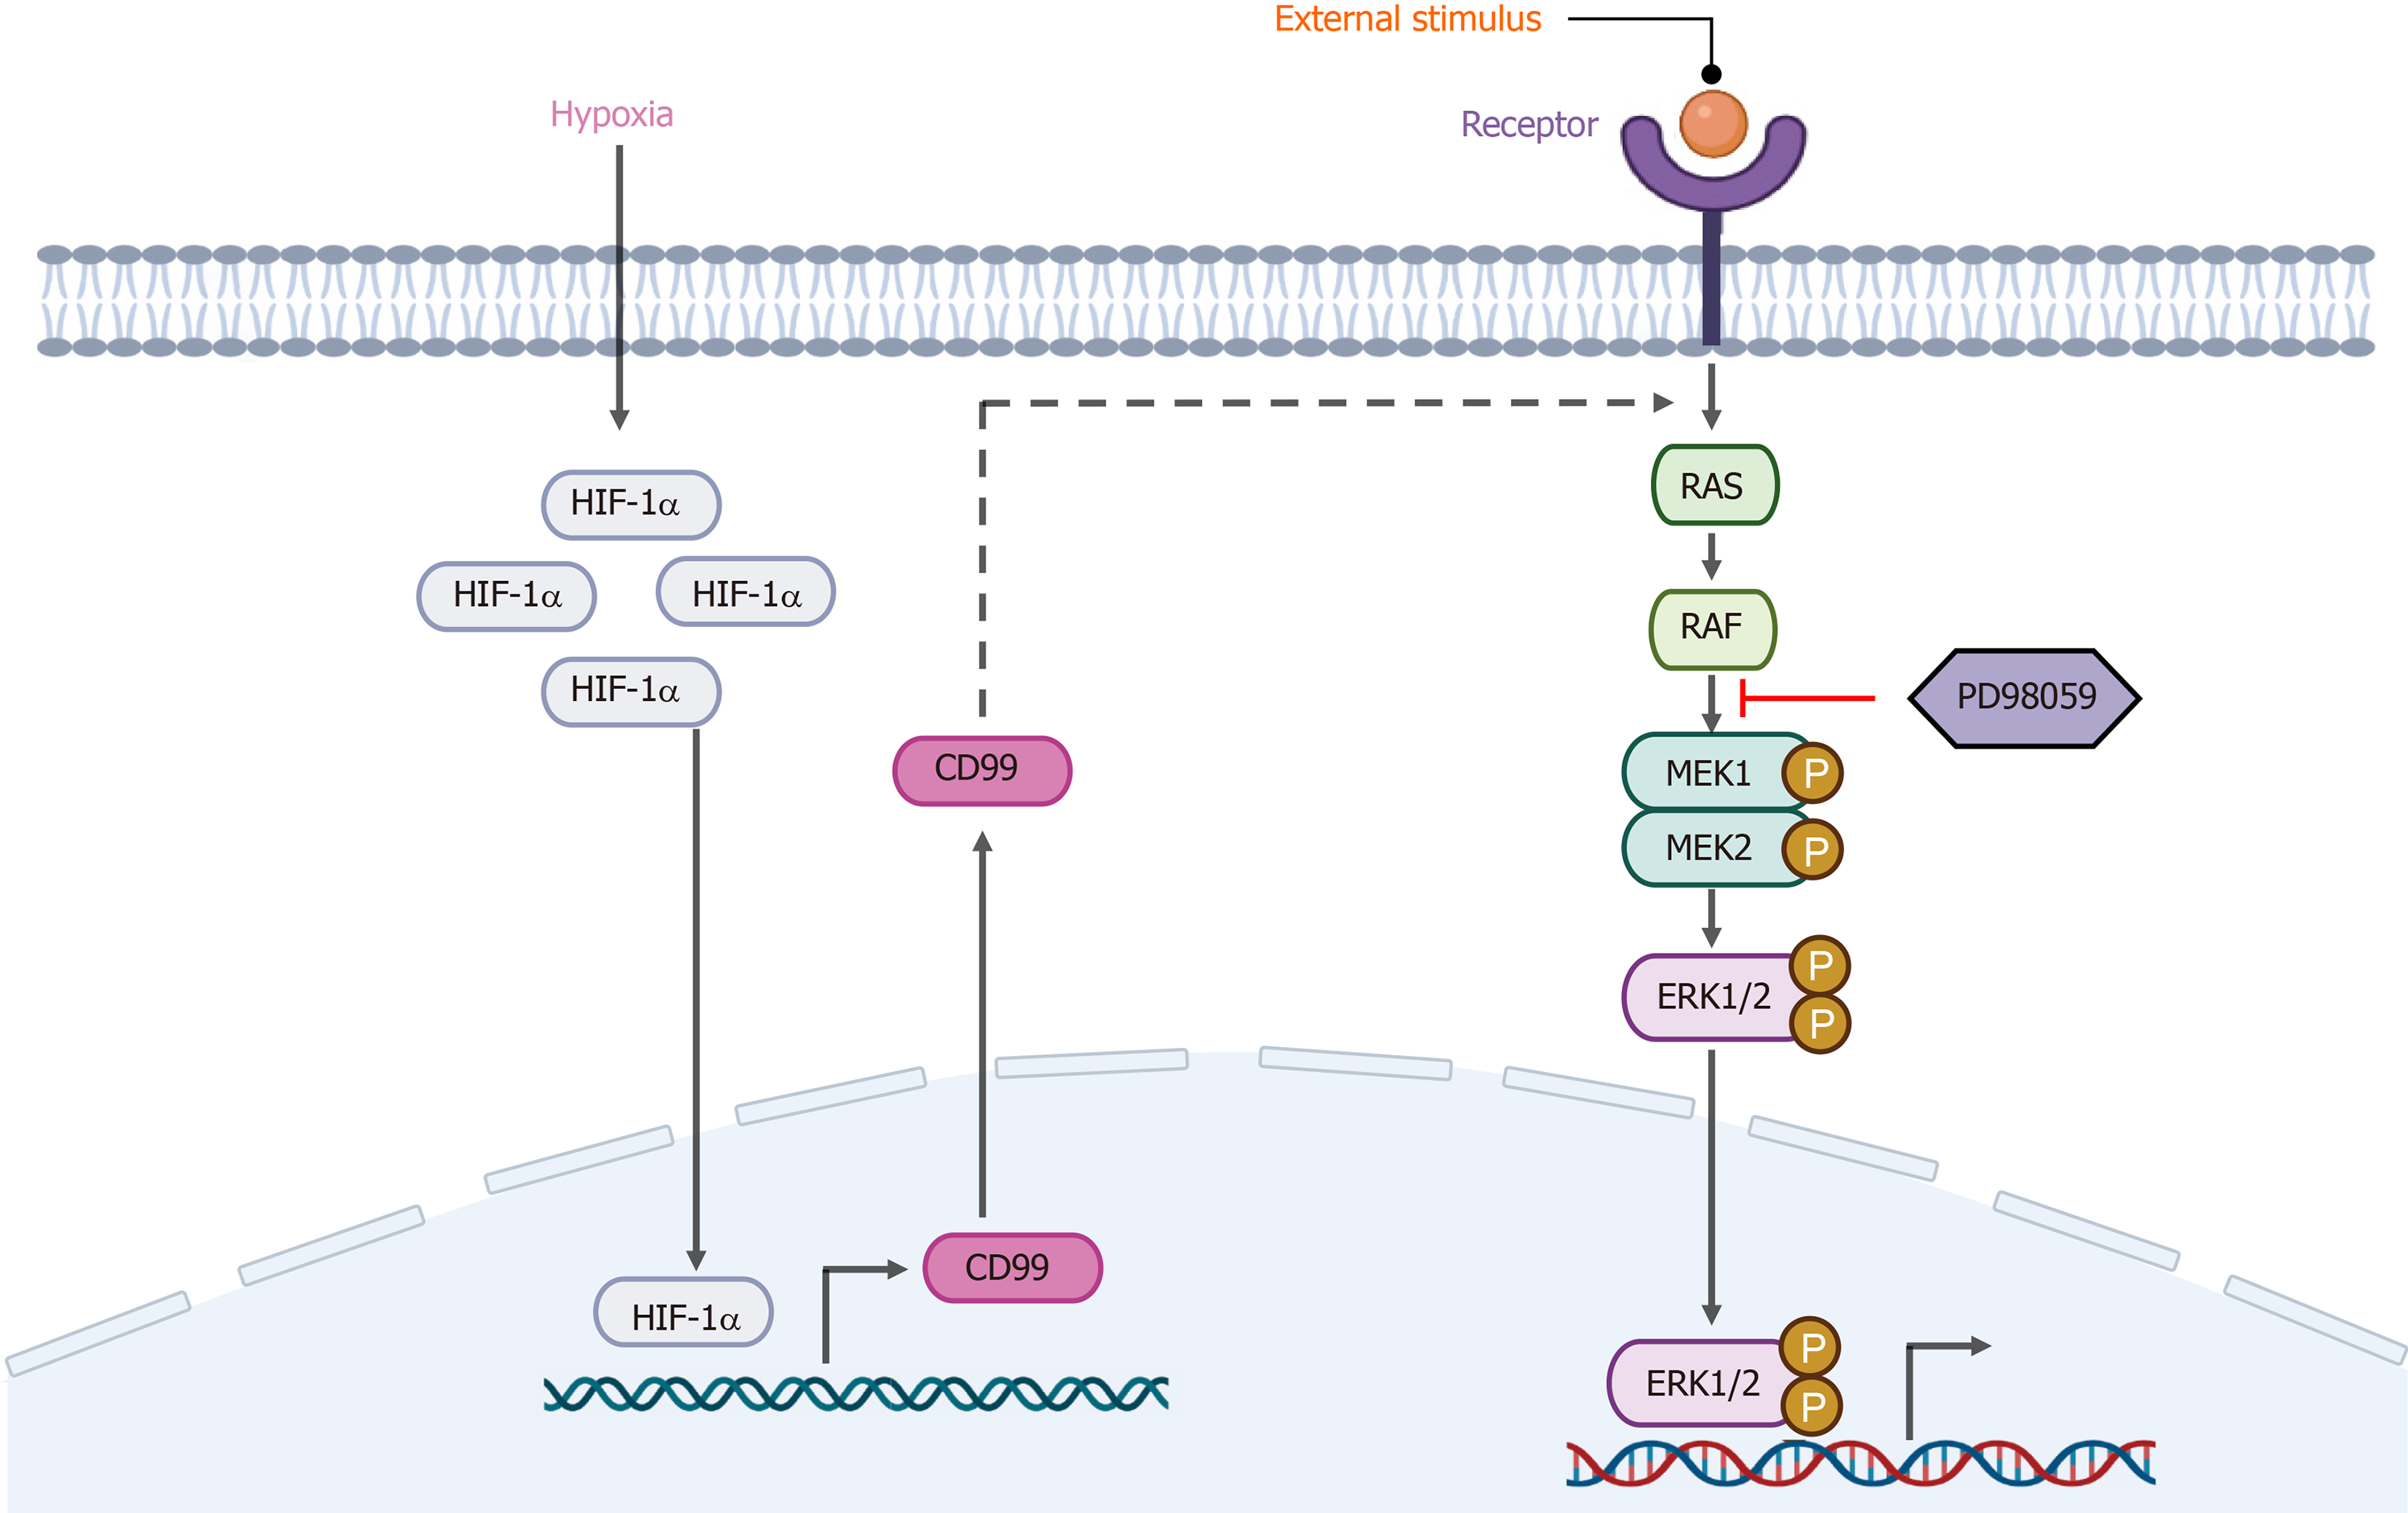
Figure 7 Schematic diagram of the mechanism of the promotion of human placenta-derived mesenchymal stem cell proliferation under hypoxia by the hypoxia-inducible factor 1α/CD99/ERK axis (created at BioRender.
com). HIF-1α: Hypoxia-inducible factor 1α.
- Citation: Feng XD, Zhu JQ, Zhou JH, Lin FY, Feng B, Shi XW, Pan QL, Yu J, Li LJ, Cao HC. Hypoxia-inducible factor-1α–mediated upregulation of CD99 promotes the proliferation of placental mesenchymal stem cells by regulating ERK1/2. World J Stem Cells 2021; 13(4): 317-330
- URL: https://www.wjgnet.com/1948-0210/full/v13/i4/317.htm
- DOI: https://dx.doi.org/10.4252/wjsc.v13.i4.317


