Copyright
©The Author(s) 2020.
World J Stem Cells. Sep 26, 2020; 12(9): 1032-1049
Published online Sep 26, 2020. doi: 10.4252/wjsc.v12.i9.1032
Published online Sep 26, 2020. doi: 10.4252/wjsc.v12.i9.1032
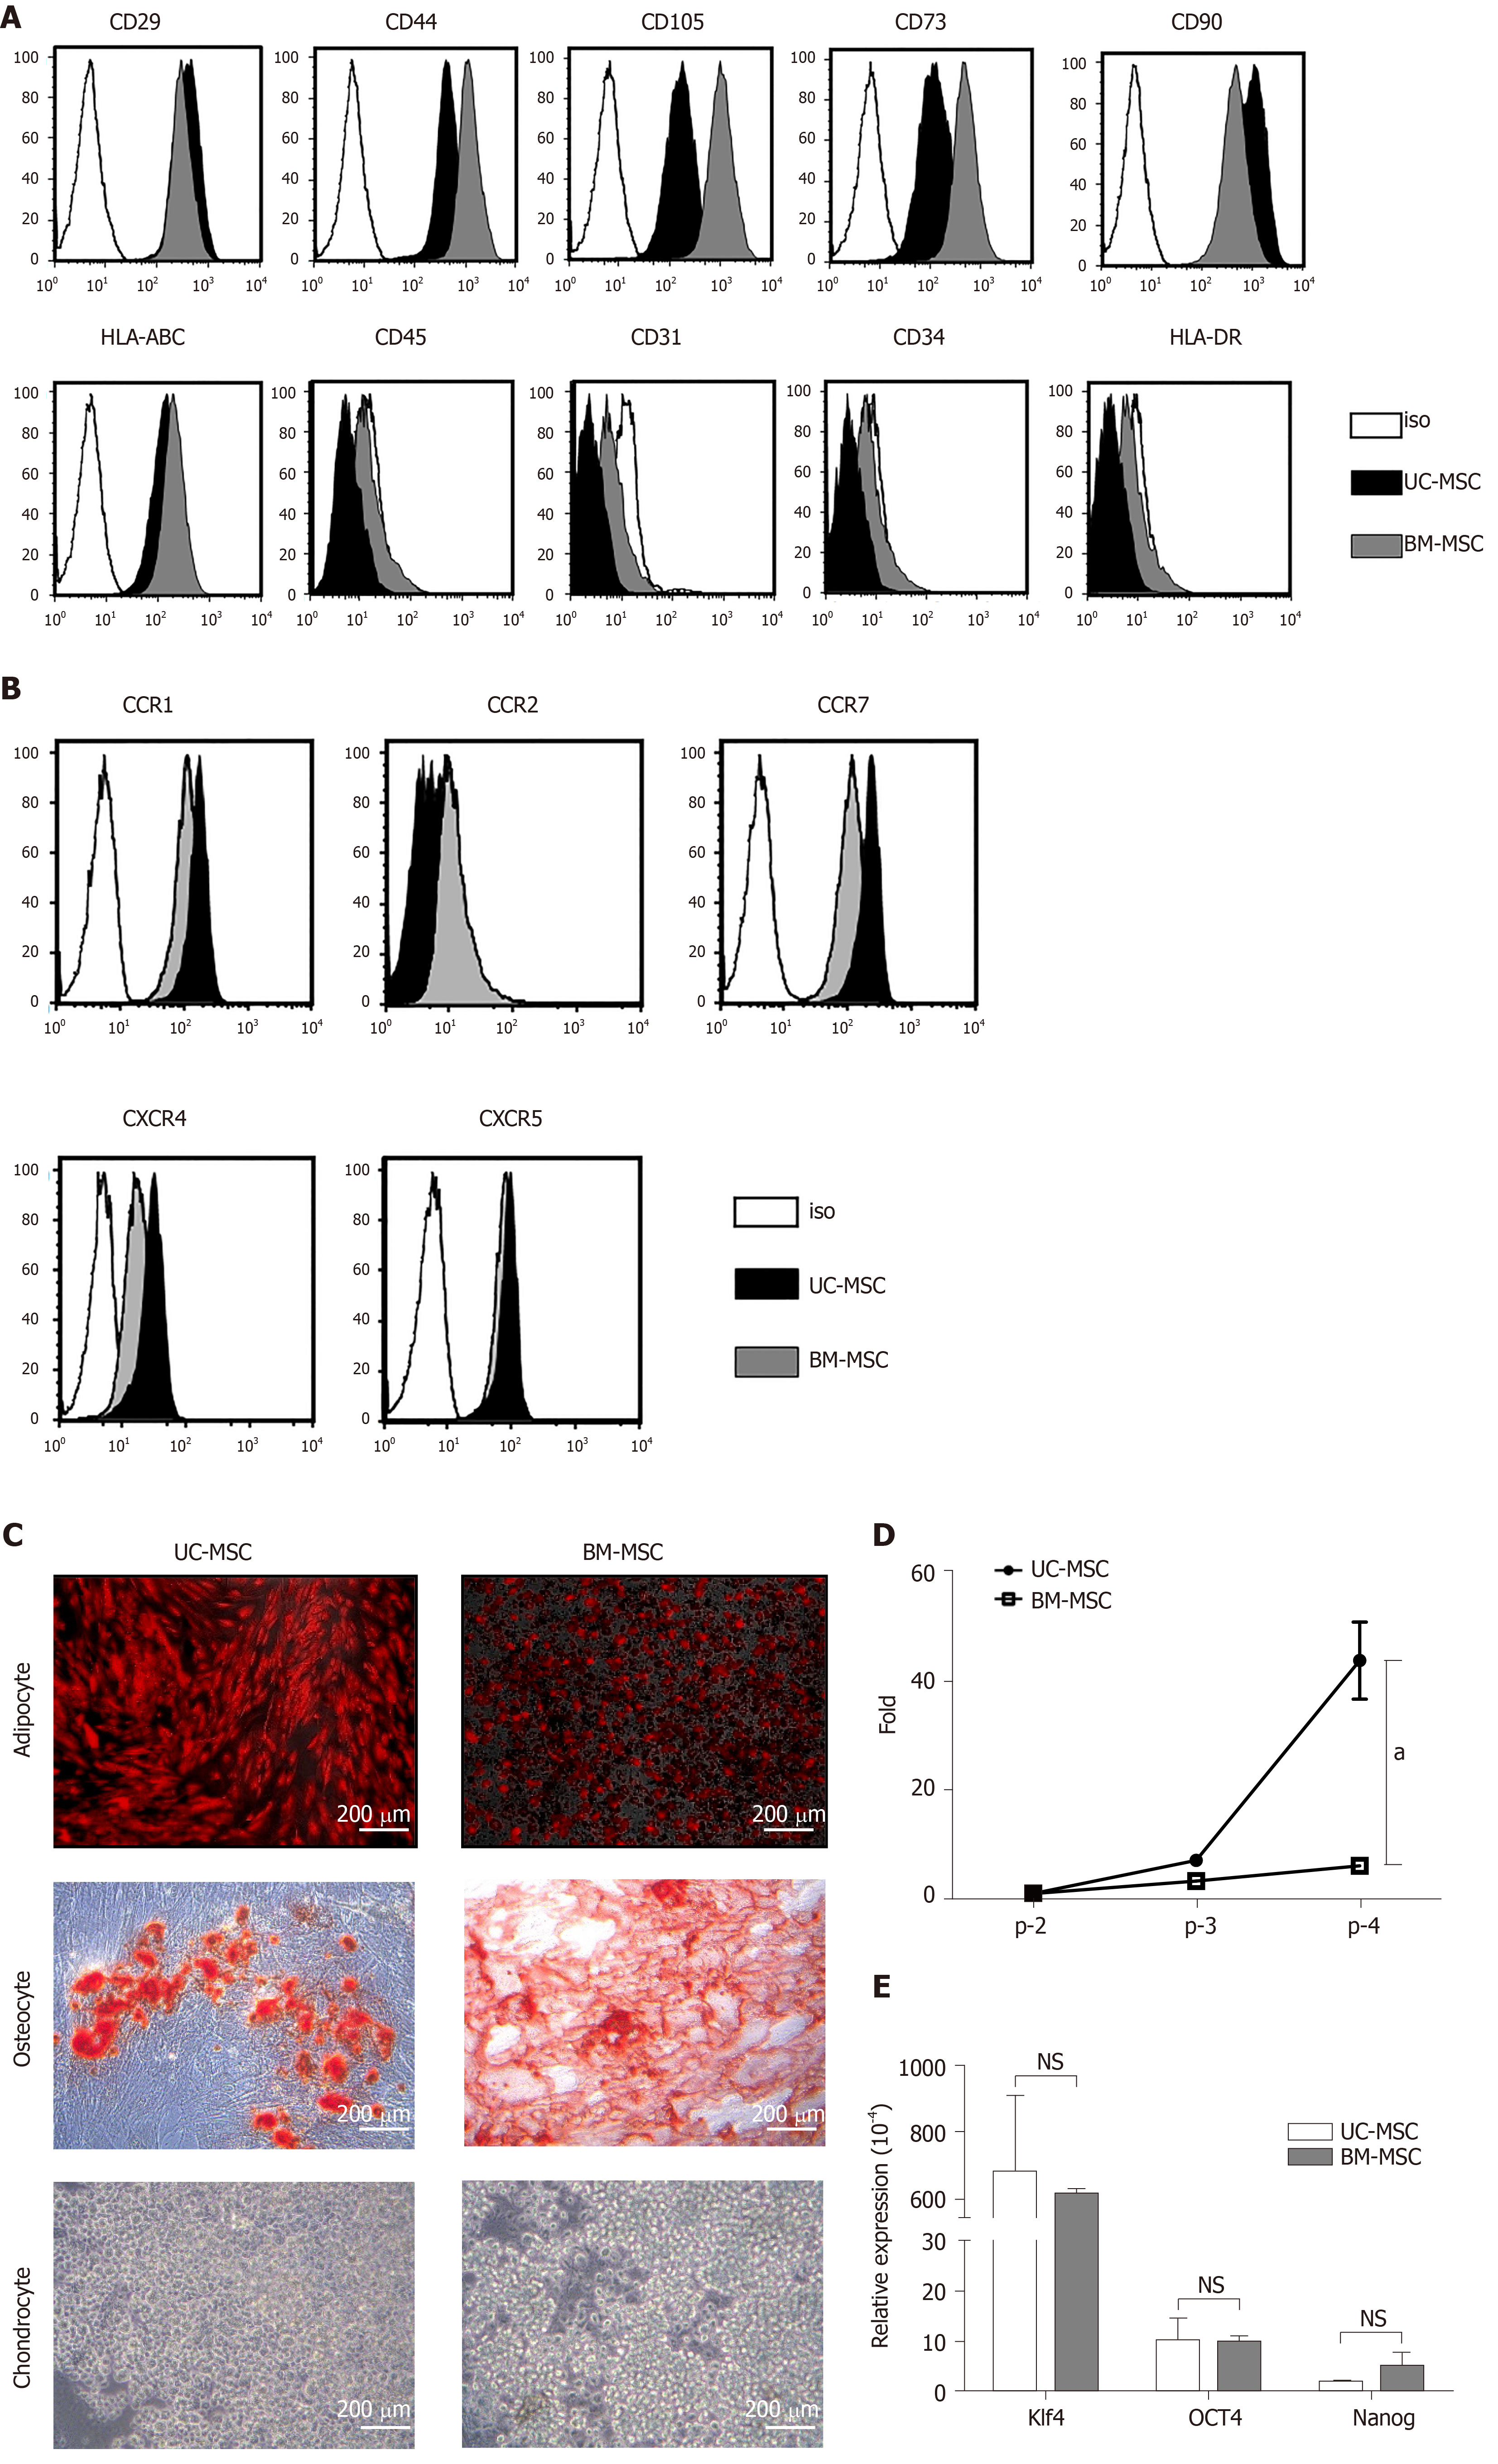
Figure 1 Characterization of umbilical cord-derived mesenchymal stem cells and bone marrow-derived mesenchymal stem cells.
A: Surface protein expression was analyzed using flow cytometry. Mesenchymal stem cells (MSCs) were assessed at the fourth passage; B: Chemokine receptor expression was analyzed at passages 3–7 by flow cytometry; C: Representative images of umbilical cord-derived MSCs and bone marrow-derived MSCs differentiation into adipocytes (bone marrow-derived MSCs: day 7; umbilical cord-derived MSCs: day 21), chondrocytes (day 21) and osteocytes (day 14). Scale bars: 200 μm. Adipocytes were detected by goat anti-mouse FABP4 polyclonal antibody under a fluorescence microscope. Osteoblasts and chondrocytes were stained with Alizarin Red S and Alcian Blue, respectively and observed under a light microscope; D: Growth rate of MSCs at different passages; and E: Pluripotency transcription factor expression levels of cultured MSCs measured by quantitative real-time polymerase chain reaction (target, GAPDH), D and E: Bone marrow-derived MSCs. Statistical analysis was performed by Student’s t-tests, aP < 0.05 vs indicated group. iso: Isotype; Klf4: Kruppel‐like factor 4; Nanog: Nanog homeobox; NS: No significance; OCT4: Octamer-binding transcription factor 4; UC-MSC: Umbilical cord-derived mesenchymal stem cells; BM-MSCs: Bone marrow-derived mesenchymal stem cells.
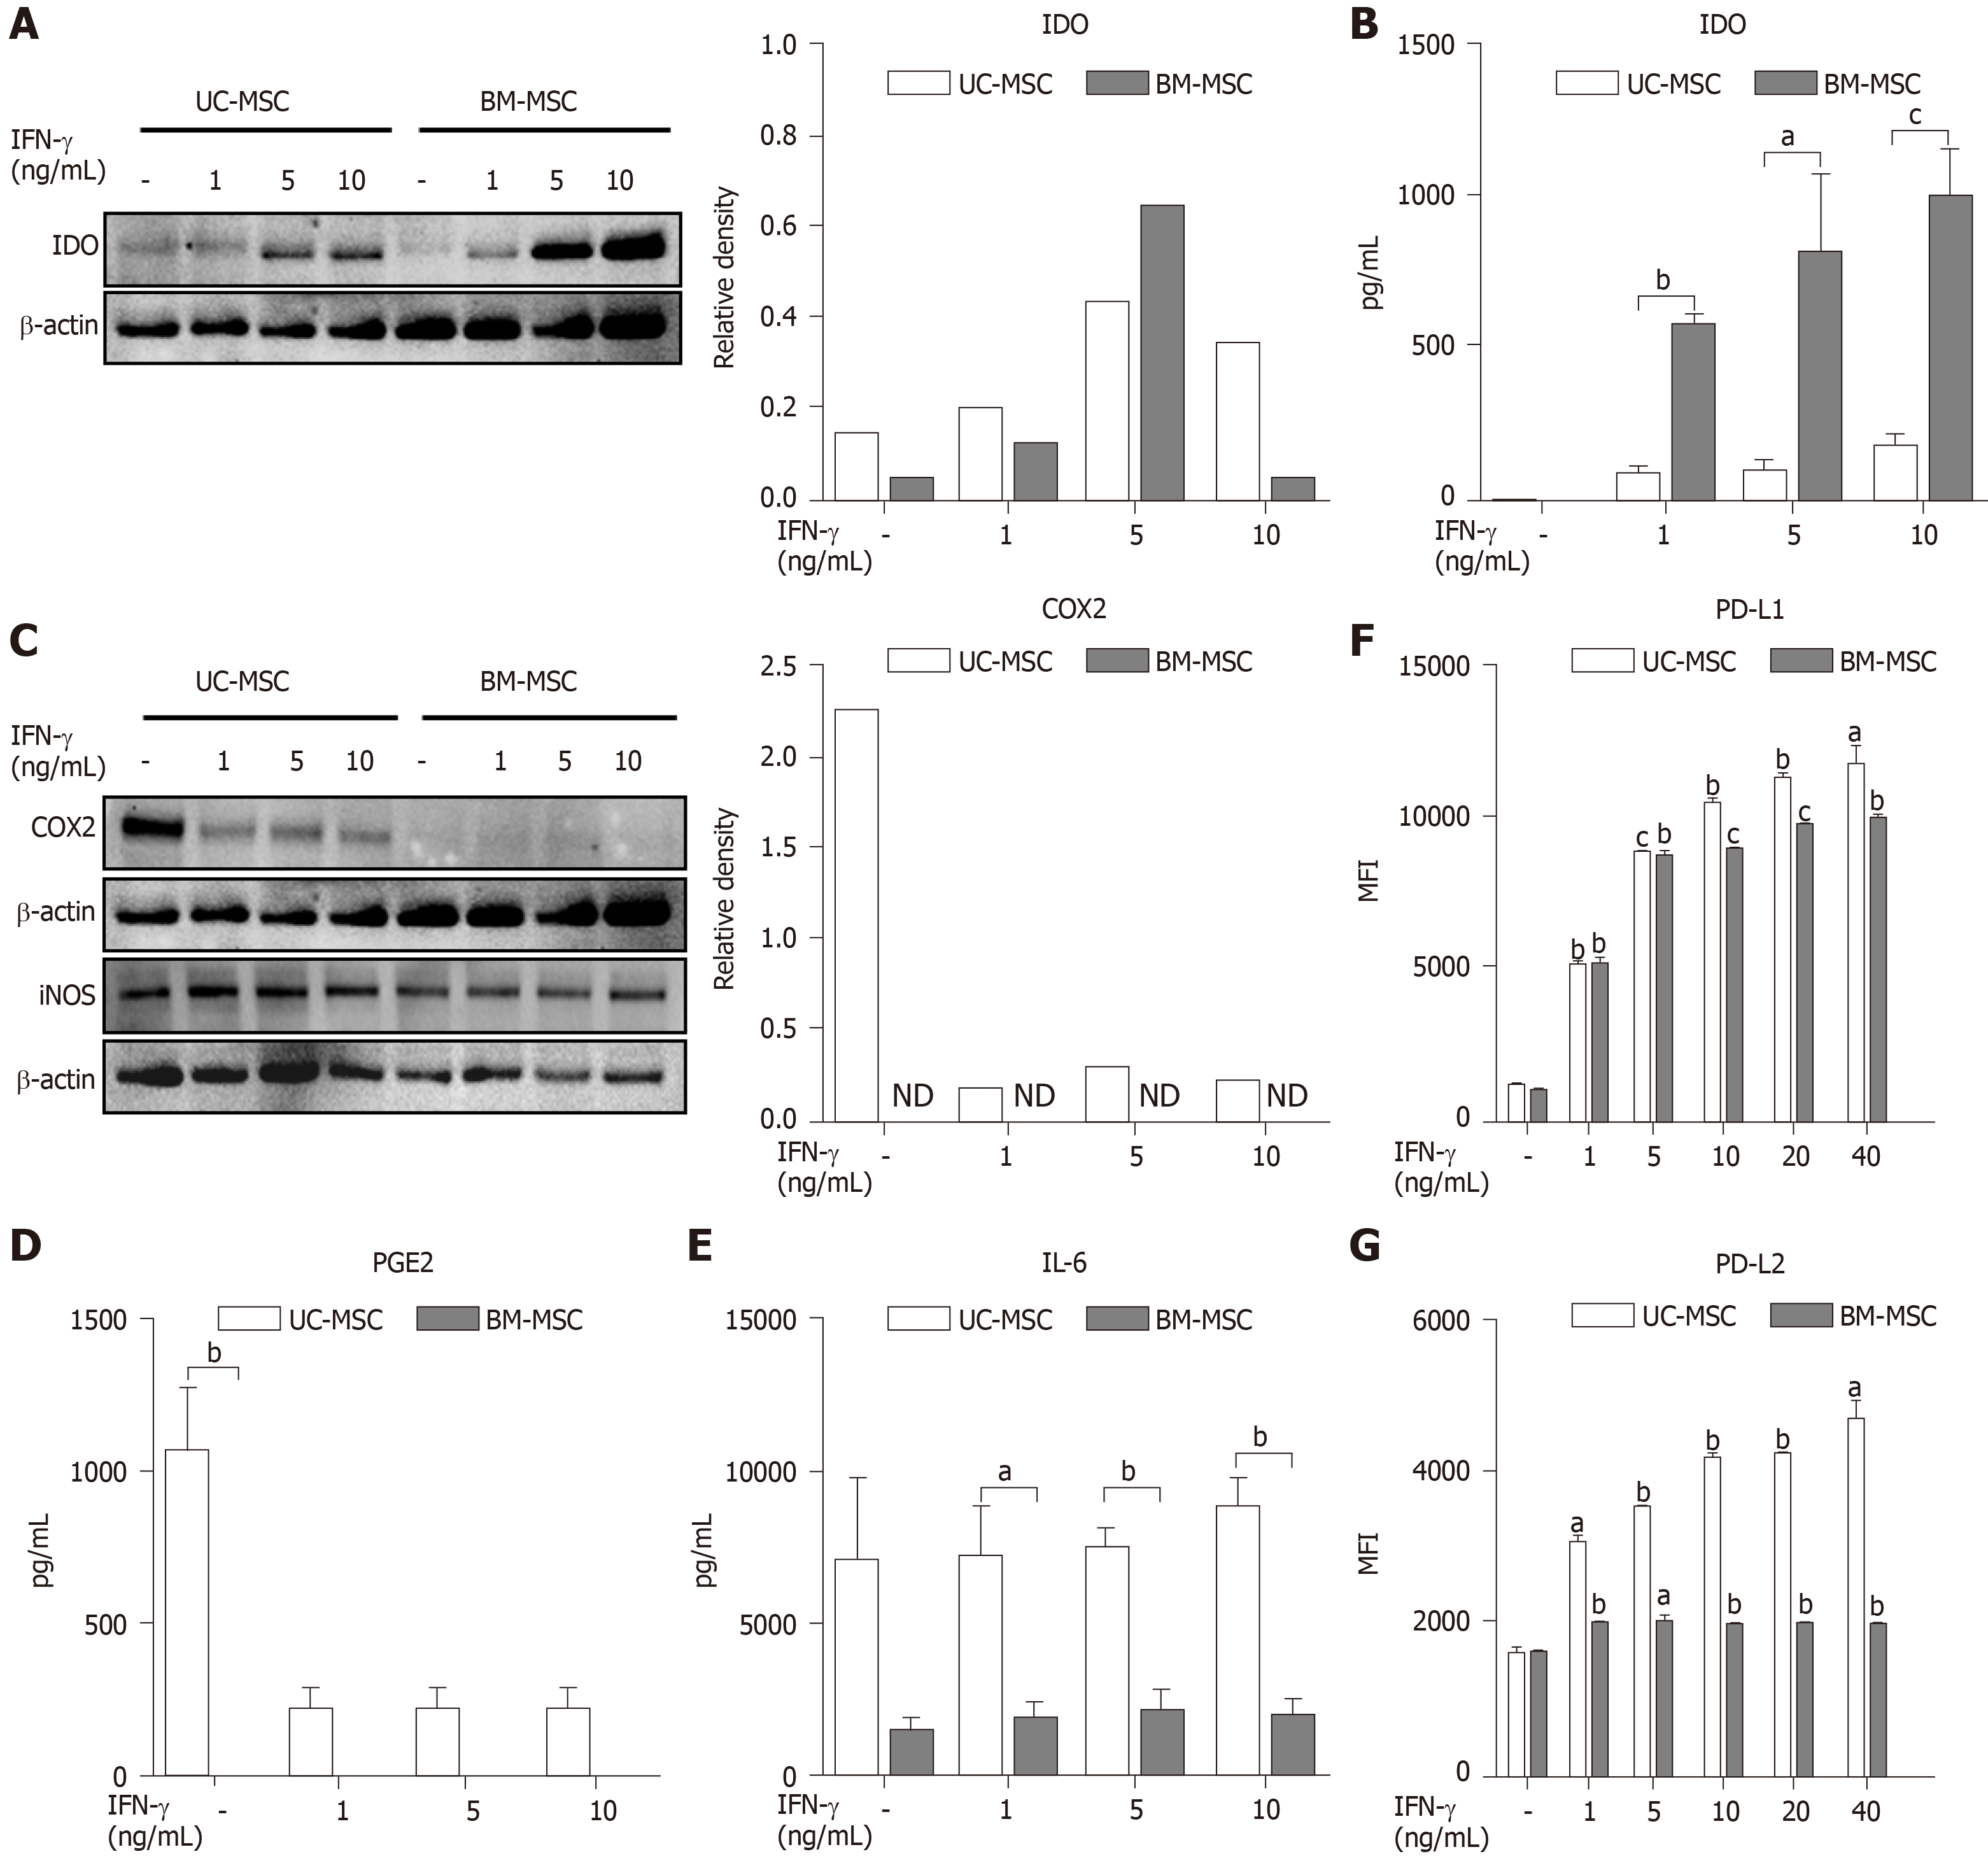
Figure 2 Immunomodulatory effects of interferon-gamma-stimulated mesenchymal stem cells.
Umbilical cord-derived mesenchymal stem cells and bone marrow-derived mesenchymal stem cells were stimulated with 0, 1, 5 or 10 ng/mL of interferon-gamma in culture for 72 h. A and C: Expression of indoleamine 2,3-dioxygenase (A) and cyclooxygenase-2 (C) of interferon-gamma-stimulated mesenchymal stem cells measured by western blotting; B, D and E: Expression of indoleamine 2,3-dioxygenase (B), prostaglandin E2 (D), and interleukin-6 (E) in cultured medium measured by ELISA; F and G: Expression of PD-L1 (F) and PD-L2 (G) after interferon-gamma stimulation analyzed by flow cytometry. Statistical analysis was performed by Student’s t-tests, aP < 0.05; bP < 0.01; cP < 0.0001 vs indicated group. B, D and E: aP < 0.05; bP < 0.01; cP < 0.0001 vs first bar of each group (F and G). BM-MSC: Bone marrow-derived mesenchymal stem cells; IDO: Indoleamine 2,3-dioxygenase; IFN-γ: Interferon-gamma; IL-6: Interleukin 6; iNOS: Inducible nitric oxide synthase; MFI: Mean fluorescence intensity; ND: Not detected; PGE2: Prostaglandin E2; UC-MSC: Umbilical cord-derived mesenchymal stem cells.
Figure 3 Immunomodulatory effects of mesenchymal stem cells treated with combinations of cytokines.
Umbilical cord-derived mesenchymal stem cells and bone marrow-derived mesenchymal stem cells were stimulated with different combinations of interferon-gamma (5 ng/mL), tumor necrosis factor alpha (5 ng/mL), and/or IL-1β (5 ng/mL) for 72 h. A: Expression levels of indoleamine 2,3-dioxygenase and cyclooxygenase-2 of cytokine-stimulated mesenchymal stem cells measured by western blotting; B and C: Expression levels of prostaglandin E2 (B) and interleukin-6 (C) in culture medium measured by ELISA. Statistical analysis was performed by Student’s t-tests, aP < 0.05; bP < 0.01; cP < 0.0001 vs first bar of each group. (B and C) BM-MSC: Bone marrow-derived mesenchymal stem cells; IDO: Indoleamine 2,3-dioxygenase; IFN-γ: Interferon-gamma; IL-1β: Interleukin 1 beta; IL-6: Interleukin 6; ND: Not detected; PGE2: Prostaglandin E2; TNF-α: Tumor necrosis factor alpha; UC-MSC: Umbilical cord-derived mesenchymal stem cells.
Figure 4 T cell inhibition by mesenchymal stem cells.
T cell proliferation was inhibited by either umbilical cord-derived mesenchymal stem cells (MSCs) or bone marrow-derived MSCs in coculture. A: Human peripheral blood mononuclear cells (1 × 10⁵/well) from heathy adult donors were stimulated with phytohemagglutinin (5 μg/mL) with or without MSCs (5 × 10³, 1 × 10⁴, 5 × 10⁴, 1 × 10⁵) for 72 h. In the final 18 h, 3H-thymidine was added to the cultures, aP < 0.05; bP < 0.01; cP <0.0001 vs control of each group, eP < 0.01; fP < 0.0001 vs control; and B: Human peripheral blood mononuclear cells were treated with L-NAME (iNOS inhibitor), indomethacin (cyclooxygenase-2 inhibitor), anti-IL-10, anti-transforming growth factor-β, hemin (heme oxygenase inducer), alloxazine (selective A2B adenosine receptor antagonist), or adenosine 5'-(α,β-methylene)diphosphate (CD73 inhibitor) with or without MSCs for 72 h. In the final 18 h, 3H-thymidine was added to the cultures. Statistical analysis was performed by Student’s t-tests aP < 0.05; bP < 0.01; cP < 0.0001 vs control. Anti-IL-10: Anti-interleukin 10 antibody; Anti-TGF-β: Anti-transforming growth factor β antibody; APCP: Adenosine 5'-(α,β-methylene)diphosphate; BM-MSC: Bone marrow-derived mesenchymal stem cells; cpm: Count per minute; L-NAME: N-nitro-L-arginine methyl ester; UC-MSC: Umbilical cord-derived mesenchymal stem cells.
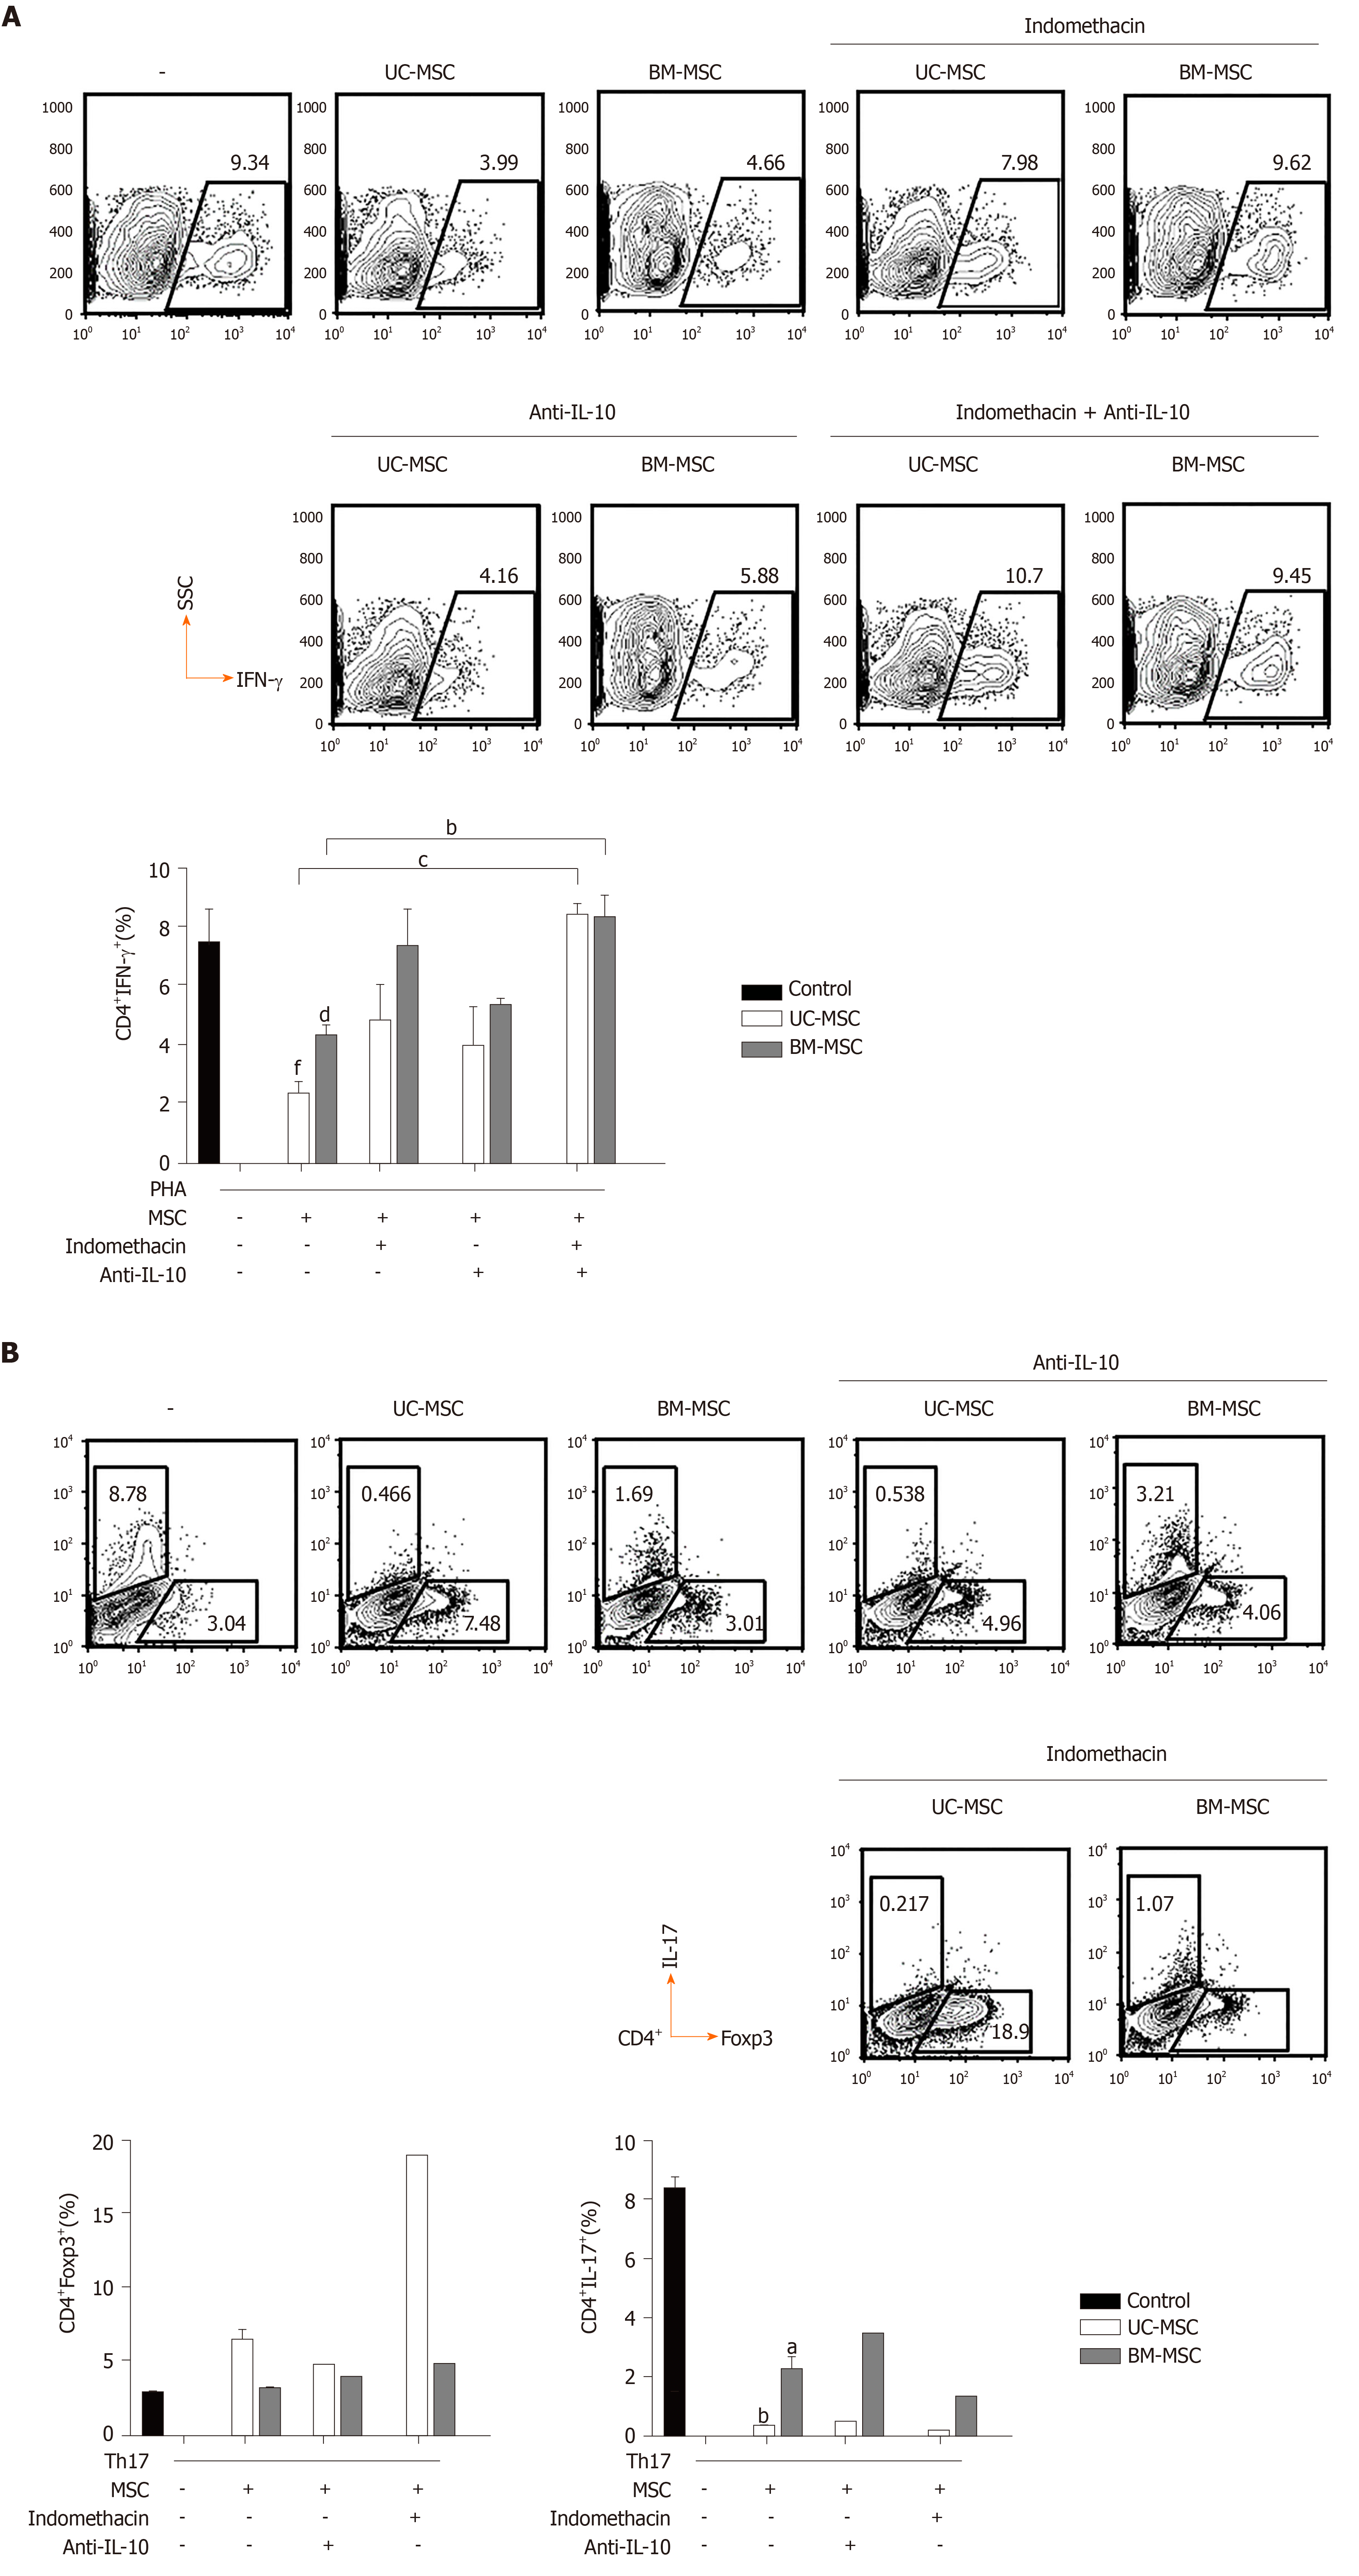
Figure 5 Roles of prostaglandin E2 and interleukin-10 in the immunomodulatory functions of mesenchymal stem cells.
A: Human peripheral blood mononuclear cells were stimulated with phytohemagglutinin (10 μg/mL) and cocultured with mesenchymal stem cells treated with indomethacin (20 μM) and/or anti- interleukin (IL)-10 (5 μg/mL). Then, interferon-gamma-producing CD4+ T cells were analyzed by flow cytometry, aP < 0.05; bP < 0.01 vs first bar; B: Human peripheral blood mononuclear cells were treated with anti-interferon-gamma (10 μg/mL), anti-IL-4 (10 μg/mL), IL-6 (10 ng/mL), IL-23 (5 ng/mL), IL-1β (10 ng/mL), tumor necrosis factor alpha-α (5 ng/mL) and transforming growth factor-β (2 ng/mL) to induce T helper 17 cells. Induced T helper 17 cells were cocultured with mesenchymal stem cells treated with indomethacin (20 μM) and/or anti-IL-10 (5 μg/mL). Populations of CD4+Foxp3+ T cells and CD4+IL-17+ T cells were analyzed by flow cytometry. Statistical analysis was performed by Student’s t-tests, aP < 0.05; bP < 0.01; cP < 0.0001 vs indicated group, dP < 0.05; fP < 0.0001 vs phytohemagglutinin control. Anti-IL-10: Anti-interleukin 10 antibody; BM-MSC: Bone marrow-derived mesenchymal stem cells; IFN-γ: Interferon-gamma; IL-17: Interleukin 17; MSC: Mesenchymal stem cells; PHA: Phytohemagglutinin; Th17: T helper 17; UC-MSC: Umbilical cord-derived mesenchymal stem cells.
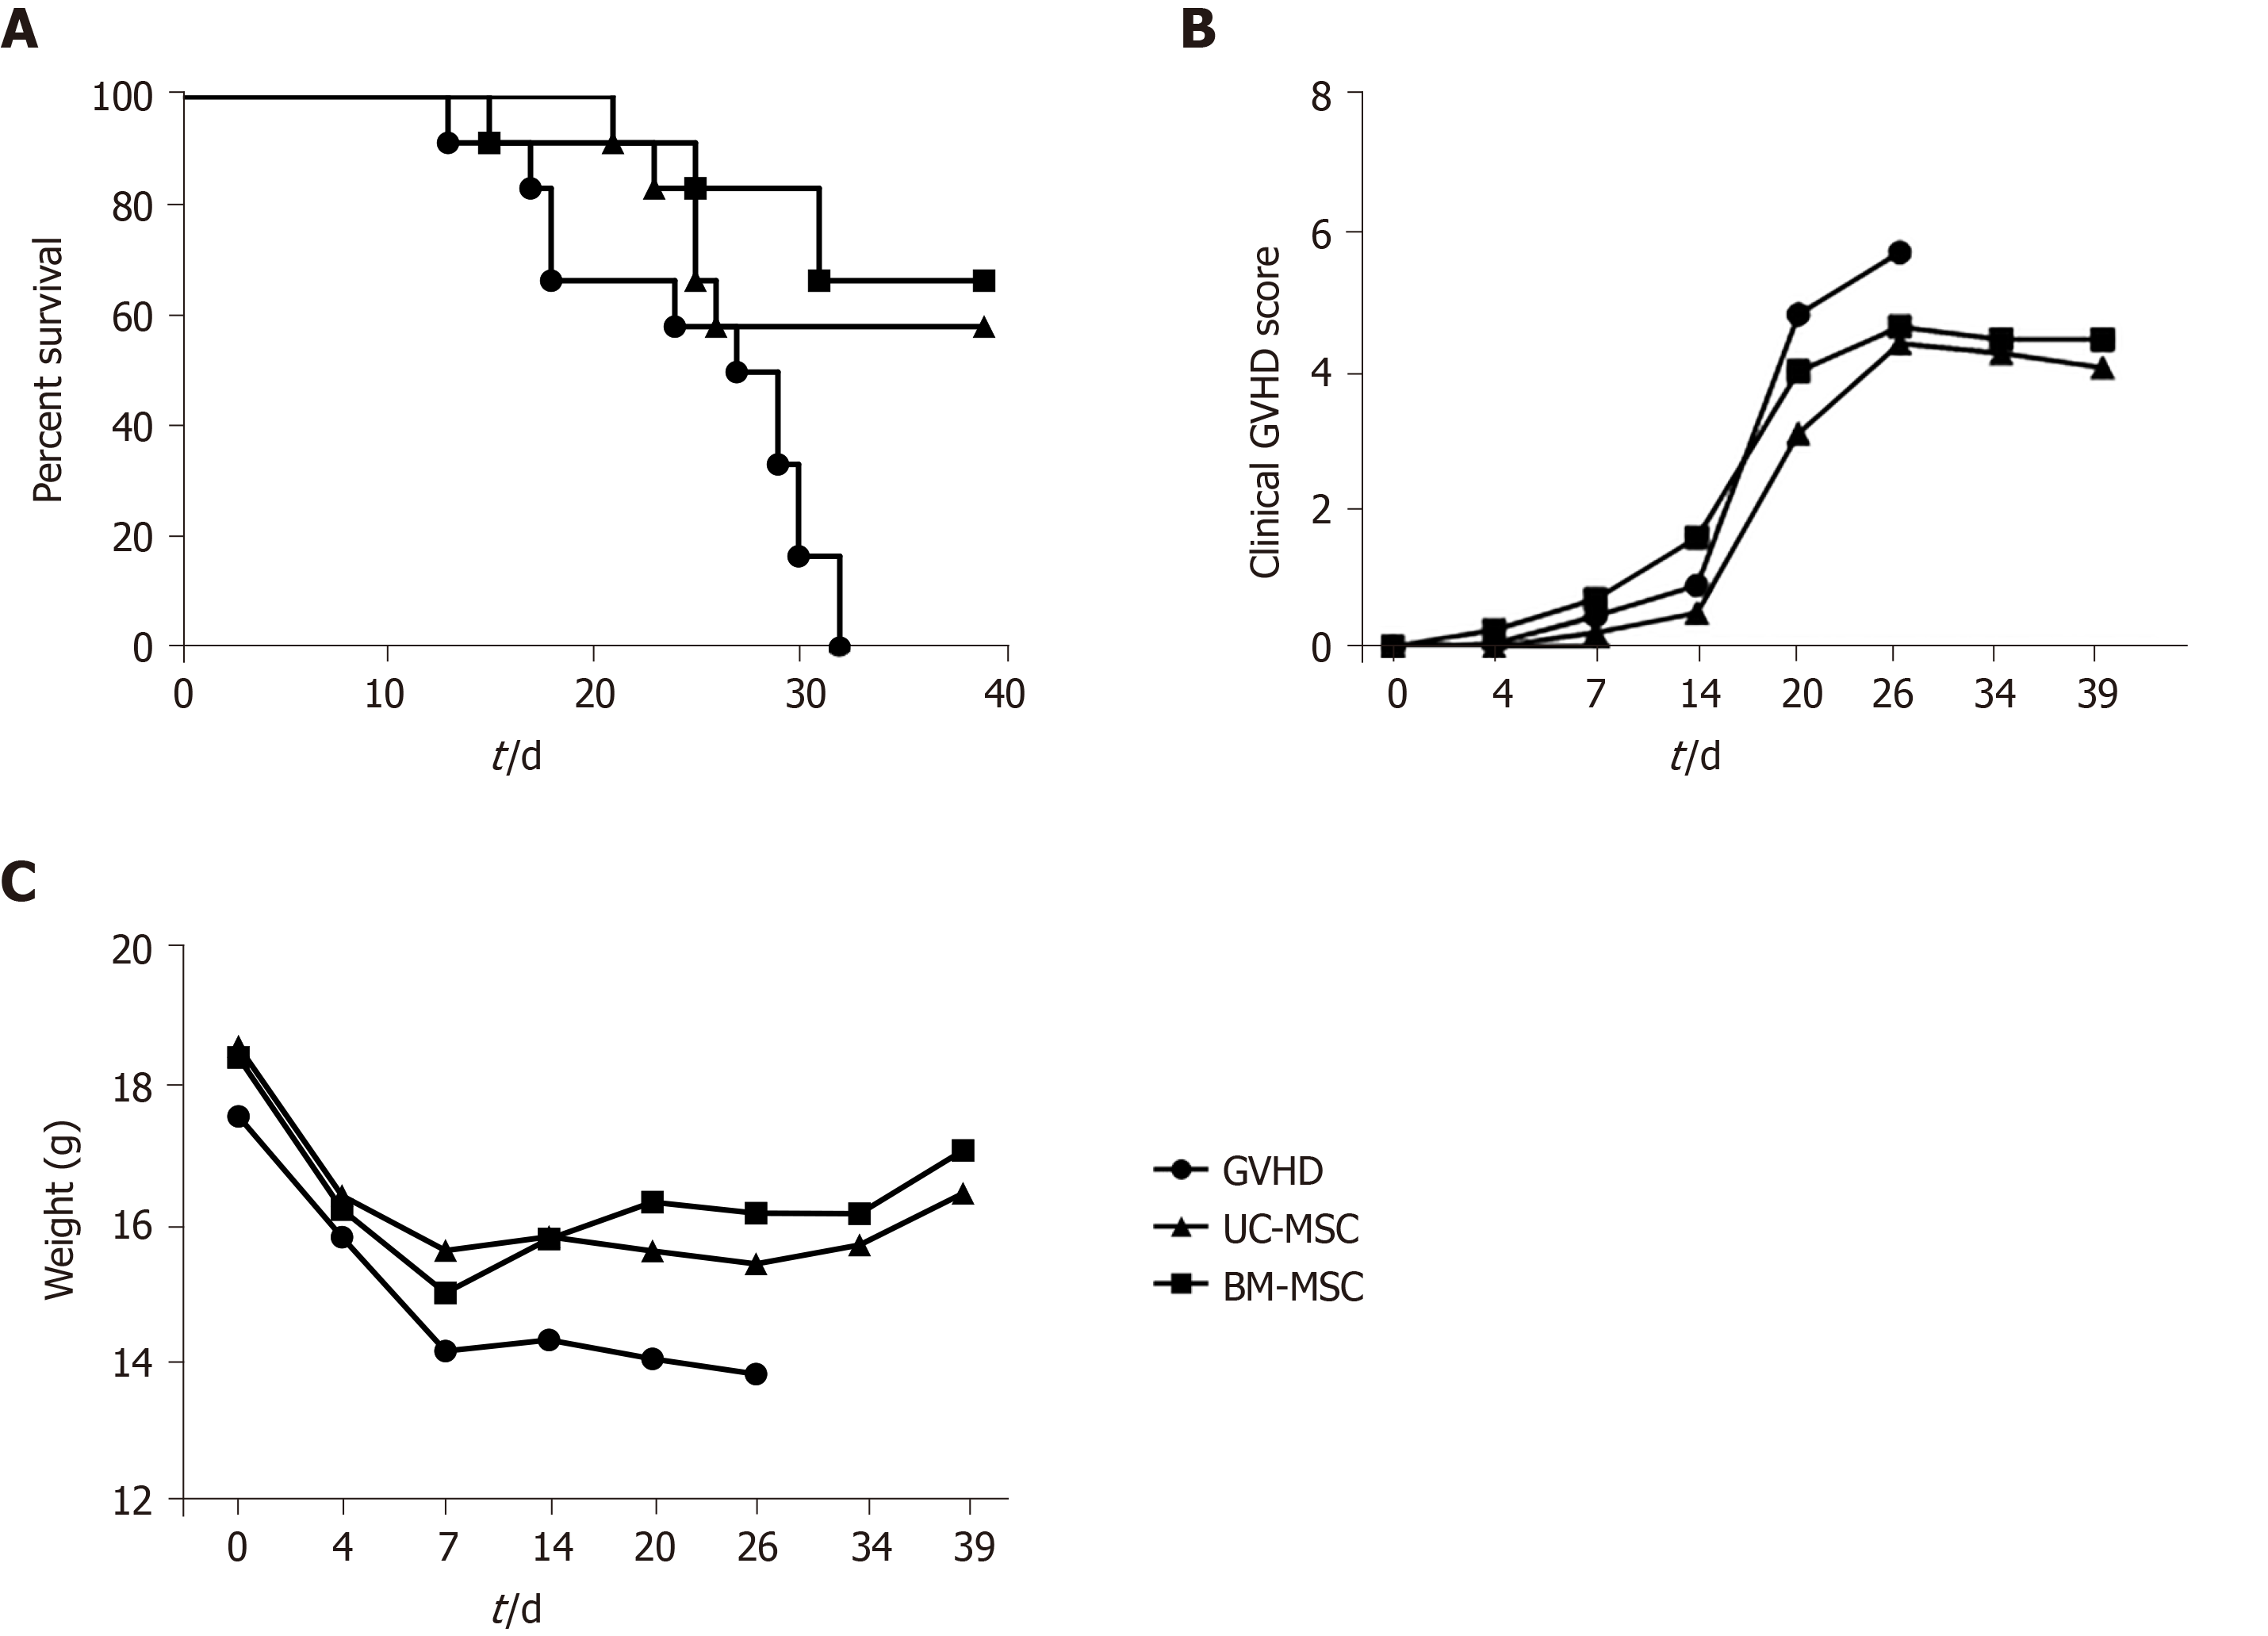
Figure 6 Inhibitory effects of mesenchymal stem cells therapy on graft-versus-host disease severity.
A-C: NOG mice were administered 200 cGy of total body irradiation before transplantation of human peripheral blood mononuclear cells (2 × 10⁷). At days 0, 7 and 14 after transplantation, mice were administered with umbilical cord-derived mesenchymal stem cells or bone marrow-derived mesenchymal stem cells (1 × 10⁵). All NOG mice were monitored for survival (A), clinical signs of graft-versus-host disease (B) and weight (C). BM-MSC: Bone marrow-derived mesenchymal stem cells; GVHD: Graft-versus-host disease; UC-MSC: Umbilical cord-derived mesenchymal stem cells.
- Citation: Song Y, Lim JY, Lim T, Im KI, Kim N, Nam YS, Jeon YW, Shin JC, Ko HS, Park IY, Cho SG. Human mesenchymal stem cells derived from umbilical cord and bone marrow exert immunomodulatory effects in different mechanisms. World J Stem Cells 2020; 12(9): 1032-1049
- URL: https://www.wjgnet.com/1948-0210/full/v12/i9/1032.htm
- DOI: https://dx.doi.org/10.4252/wjsc.v12.i9.1032


