Copyright
©The Author(s) 2020.
World J Stem Cells. Nov 26, 2020; 12(11): 1410-1428
Published online Nov 26, 2020. doi: 10.4252/wjsc.v12.i11.1410
Published online Nov 26, 2020. doi: 10.4252/wjsc.v12.i11.1410
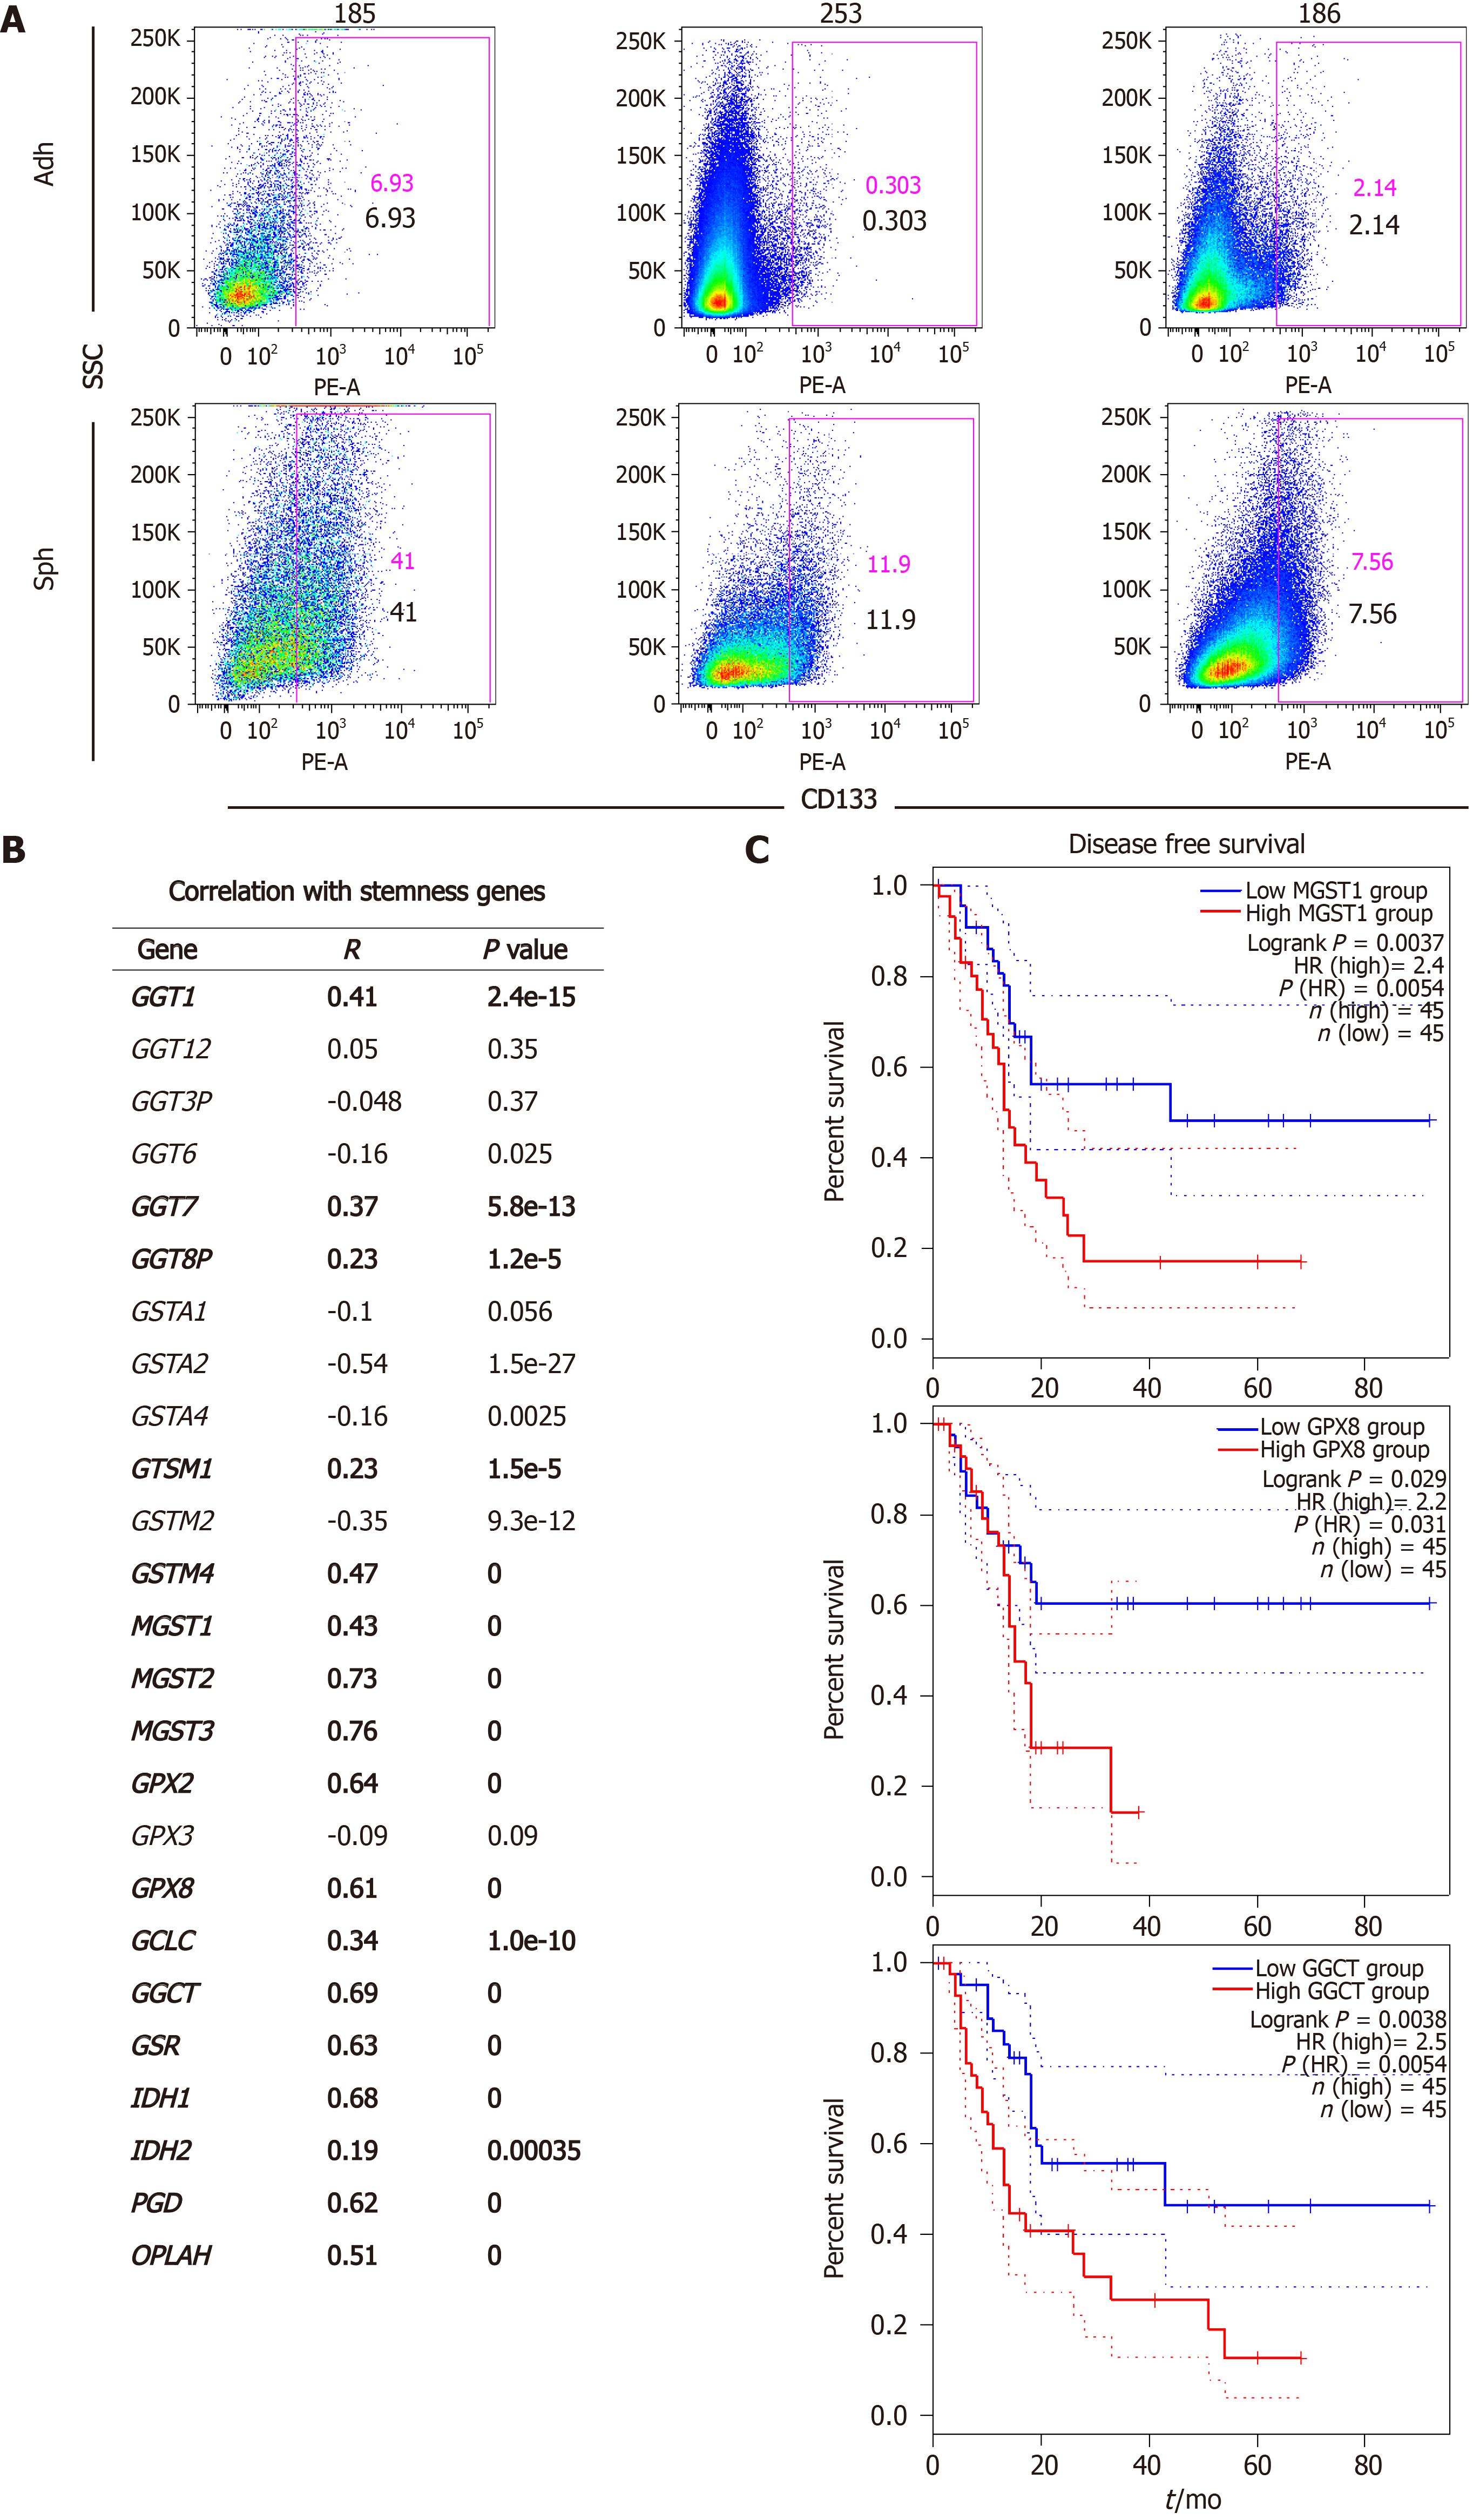
Figure 1 Expression of glutathione metabolism genes positively correlates with a stemness signature in human pancreatic cancer samples and predicts poor outcome.
A: Enrichment in CD133+ cells in sphere cultures vs adherent cultures, as determined by flow cytometry. Representative flow cytometry histograms of the indicated patient-derived xenograft models; B: Correlation of genes that were up-regulated in cancer stem cell-enriched cultures with a stemness signature defined by combined expression of the pluripotency-related genes NANOG, KLF4, SOX2 and OCT4. Pearson´s r and corresponding P values for individual correlations are shown; C: Disease-free survival in pancreatic cancer patients from upper and lower quartiles of expression of the indicated genes. Hazard ratio was calculated using the Cox Proportional Hazards model. Dotted lines represent the 95% confidence interval. Data in A and B were calculated using GEPIA2 (http://gepia2.cancer-pku.cn), using public data compiled in TCGA and GTEx. Sph: Sphere culture; Adh: adherent culture; HR: Hazard ratio.
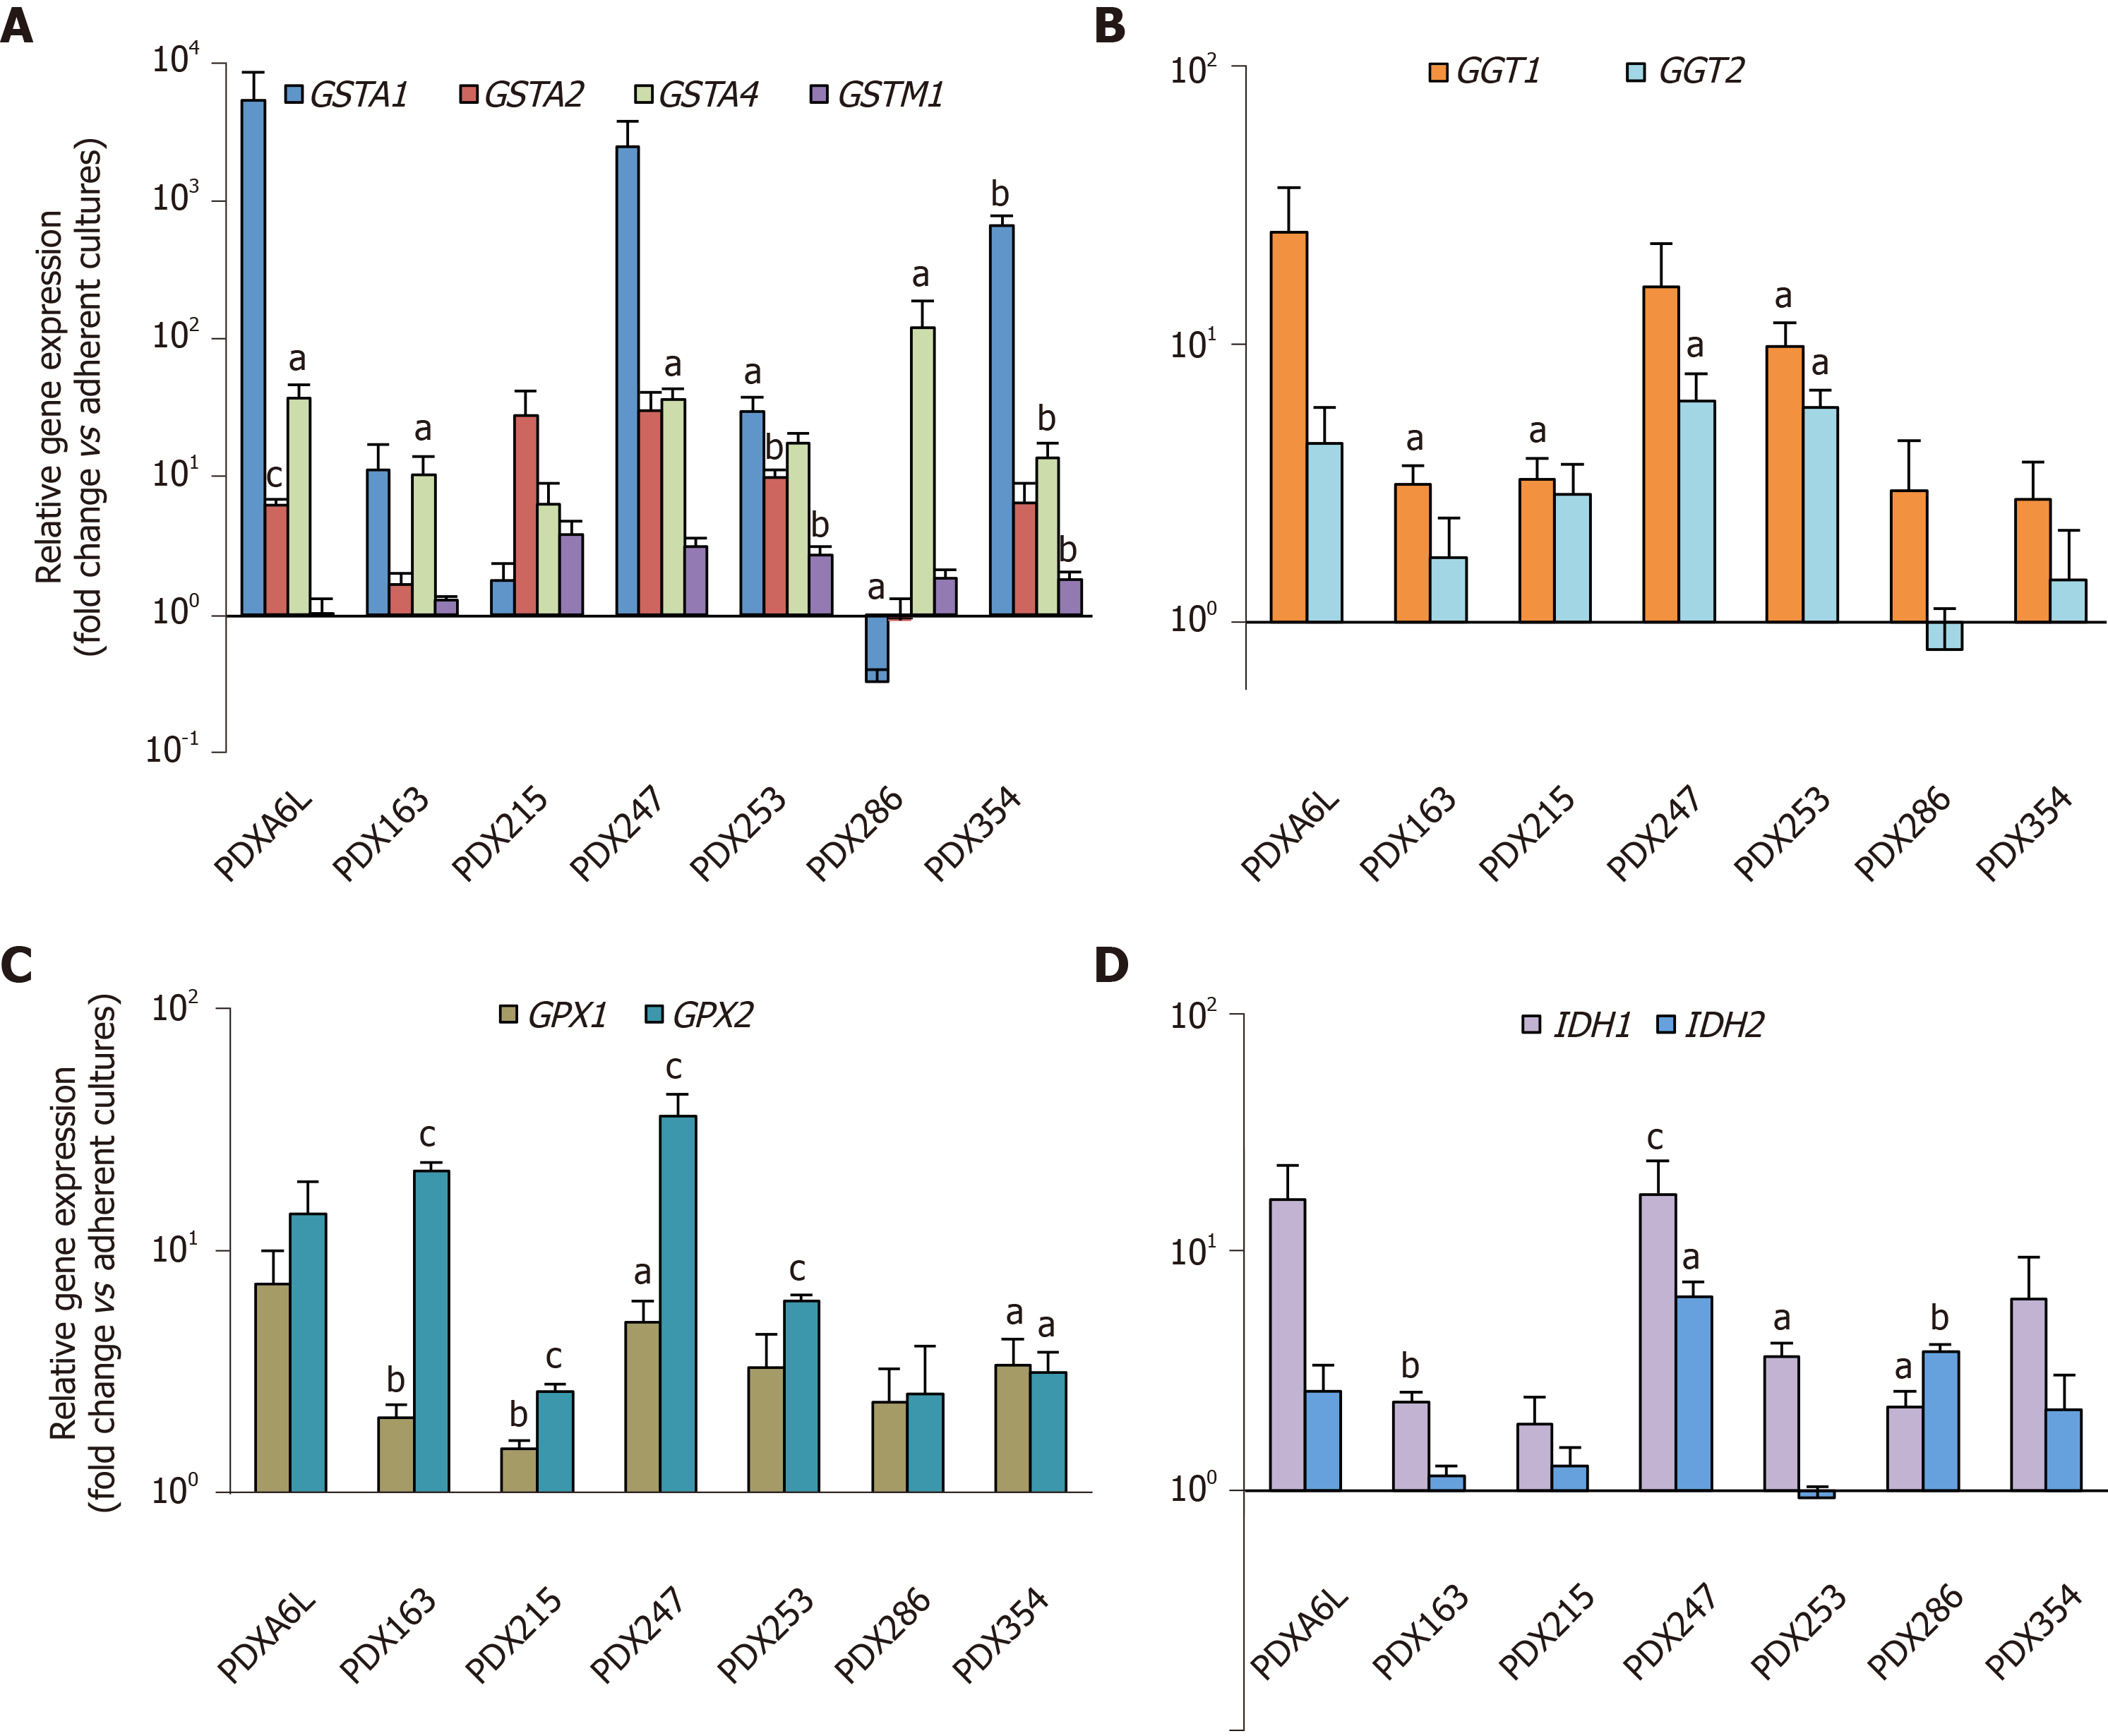
Figure 2 Glutathione metabolism-related genes are up-regulated in cancer stem cell-enriched conditions.
Primary cells from different patient-derived xenograft models as indicated in the figure were cultured in adherent or low-attachment cancer stem cell-enriching conditions. On day 7 the expression of several glutathione (GSH)-related genes was evaluated by real-time polymerase chain reaction (PCR). A: Glutathione-S-Transferases A1, A2, A4, M1; B: Gamma-glutamyltransferases 1 and 2; C: Glutathione Peroxidases 1 and 2; D: Isocitrate Dehydrogenases 1 and 2. Data were normalized to HPRT and are shown as mean ± SE fold change expression levels of sphere vs adherent cultures in logarithmic scale. aP < 0.05; bP < 0.01; cP < 0.001. PDX: Patient-derived xenograft; GGT: Gamma-glutamyltransferase; GST: Glutathione-s-transferase; GPX: Glutathione peroxidase.
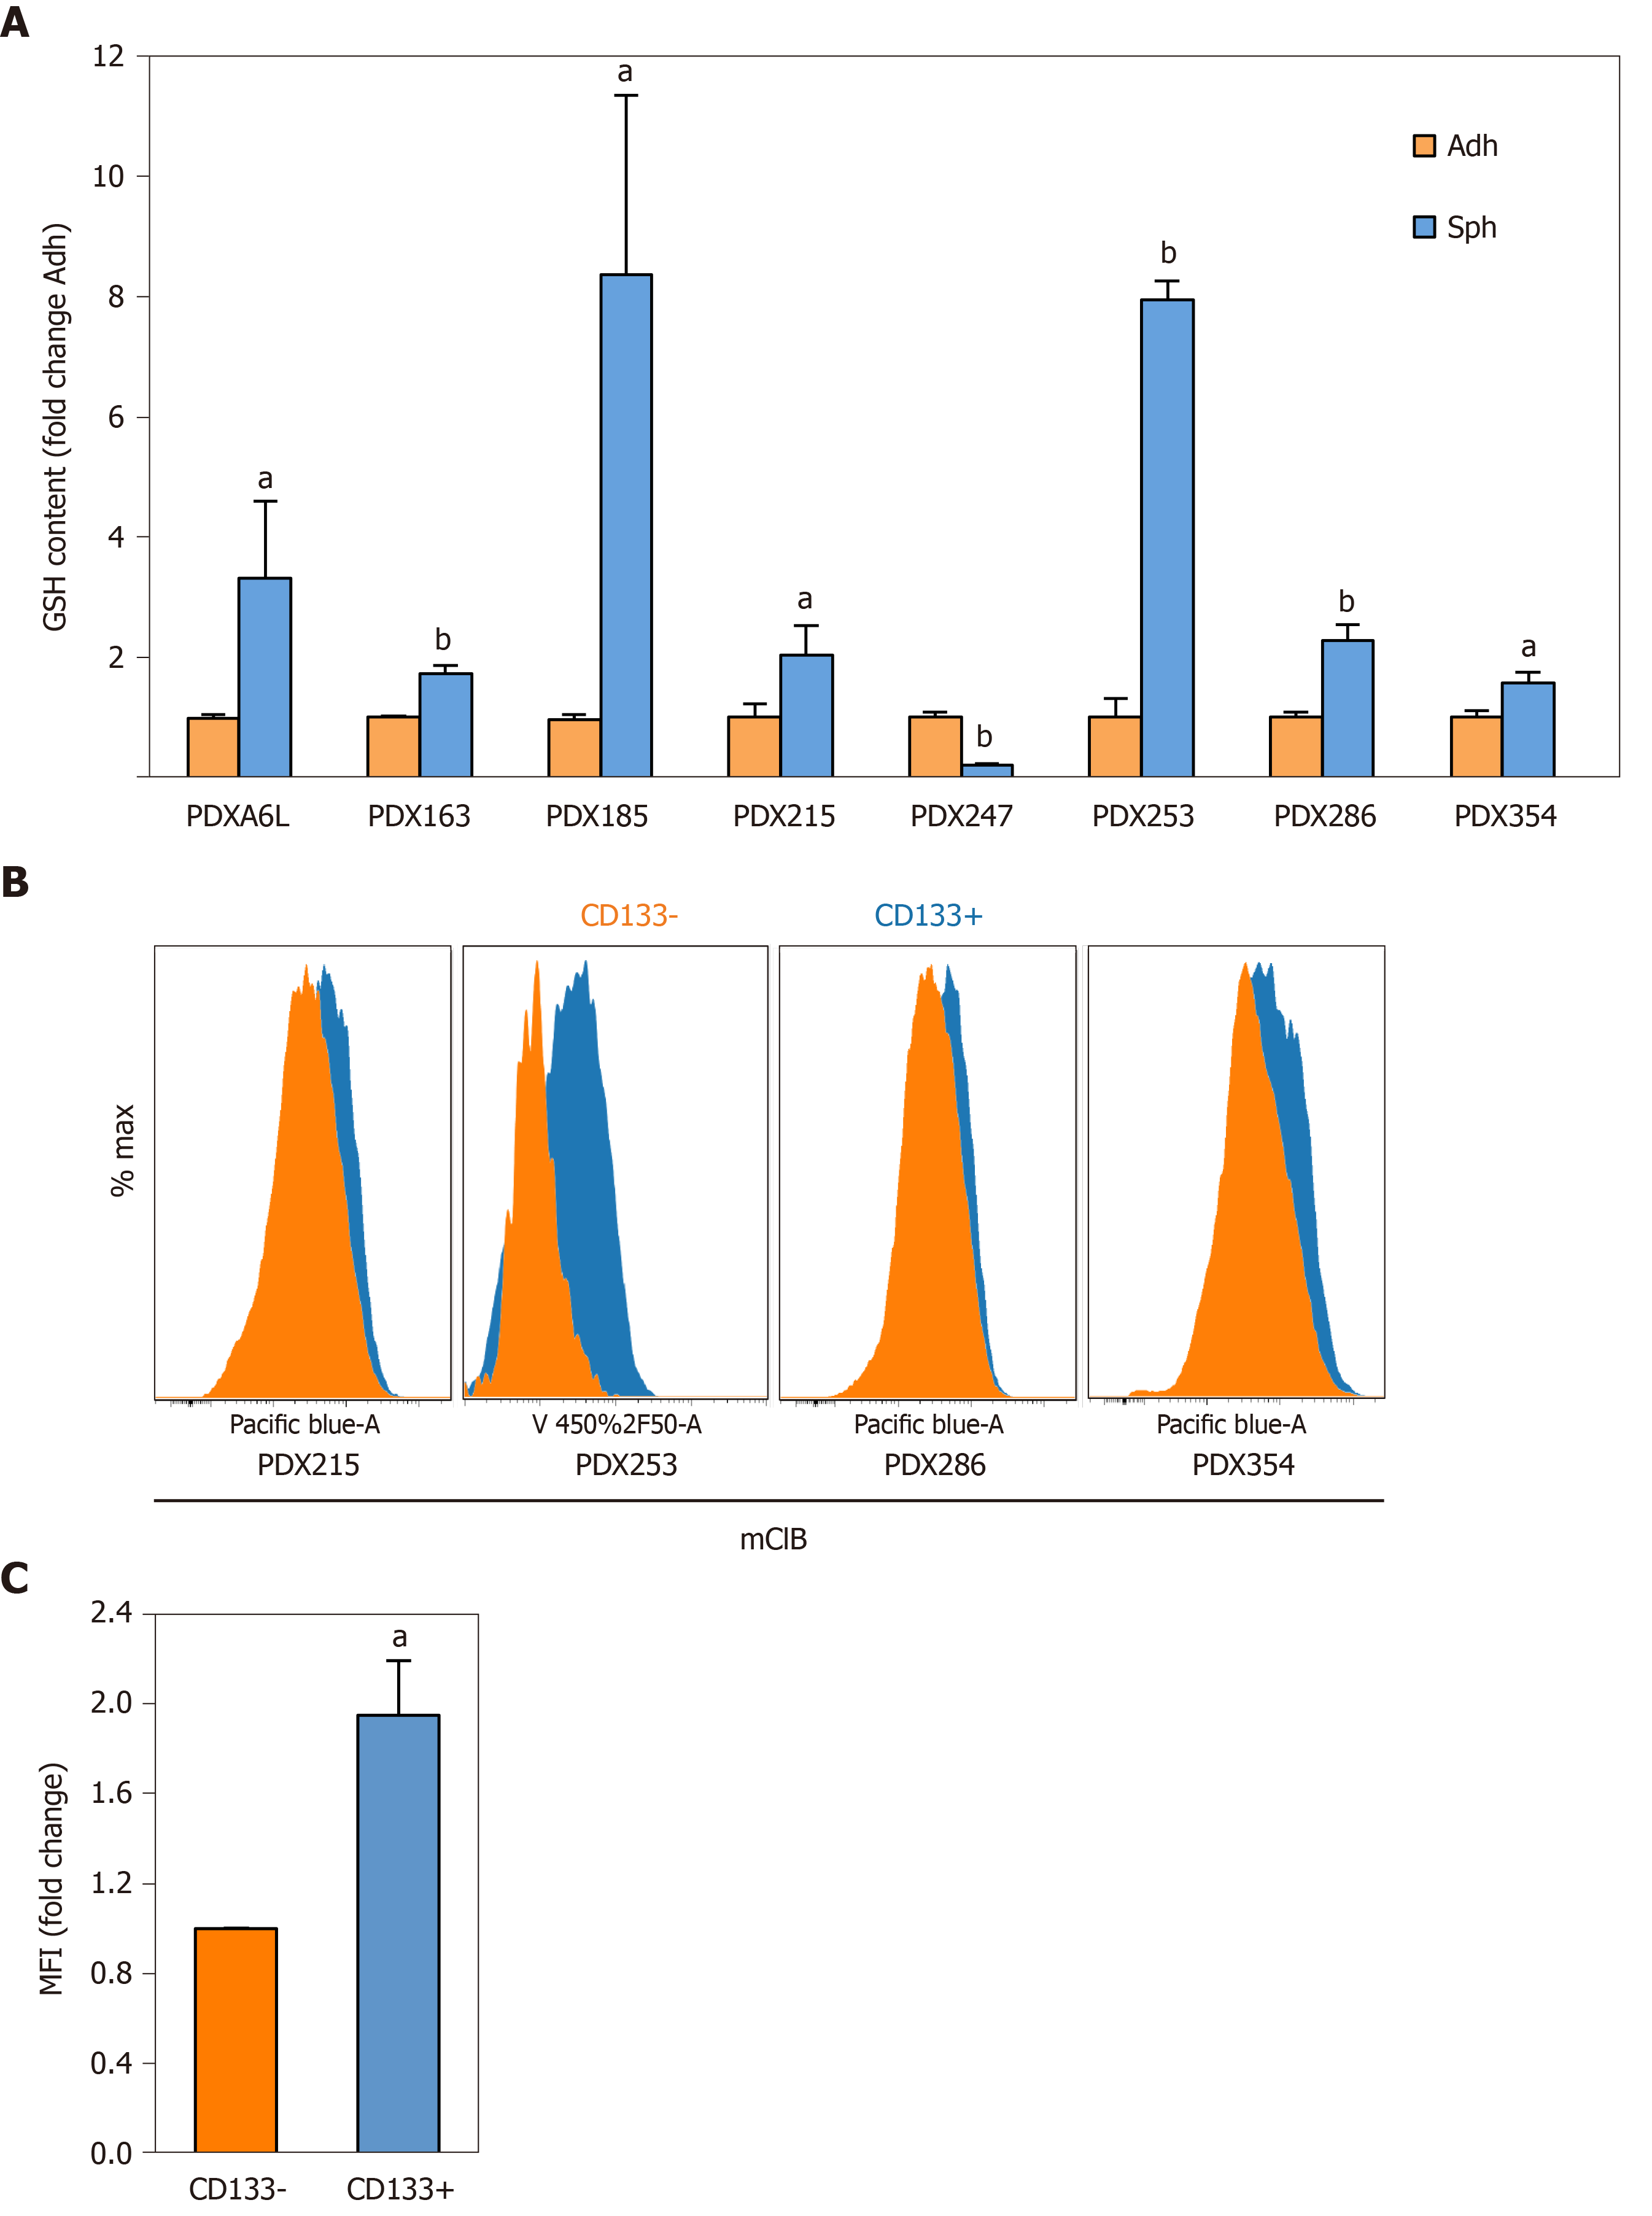
Figure 3 Reduced glutathione content is increased in cancer stem cell-enriching conditions.
Reduced glutathione (GSH) content was measured using the fluorescent thiol-reactive probe monochlorobimane (mClB). A: GSH content in cellular lysates was assessed by fluorimetry. Primary cells from different patient-derived xenograft (PDX) models as indicated in the figure were cultured in adherent or low-attachment cancer stem cell-enriching conditions for 7 d. Data were normalized for protein content; B: GSH content in CD133 positive and negative subpopulations as determined by flow cytometry. Representative flow cytometry histograms of the indicated PDX models are shown, with the following mean fluorescence intensities (MFI) for CD133– and CD133+ populations, respectively: PDX215 (2787 vs 4880), PDX286 (2748 vs 4364), PDX354 (4138 vs 6988); C: Pooled MFI data from PDX215, 286 and 354. Data in A and C are shown as mean ± SE fold change for sphere vs adherent cultures (A) or CD133+ vs CD133–. aP < 0.05; bP < 0.01. GSH: Glutathione content in its reduced form; PDX: Patient-derived xenograft; Sph: Sphere culture; Adh: adherent culture; MFI: Mean fluorescence intensities.
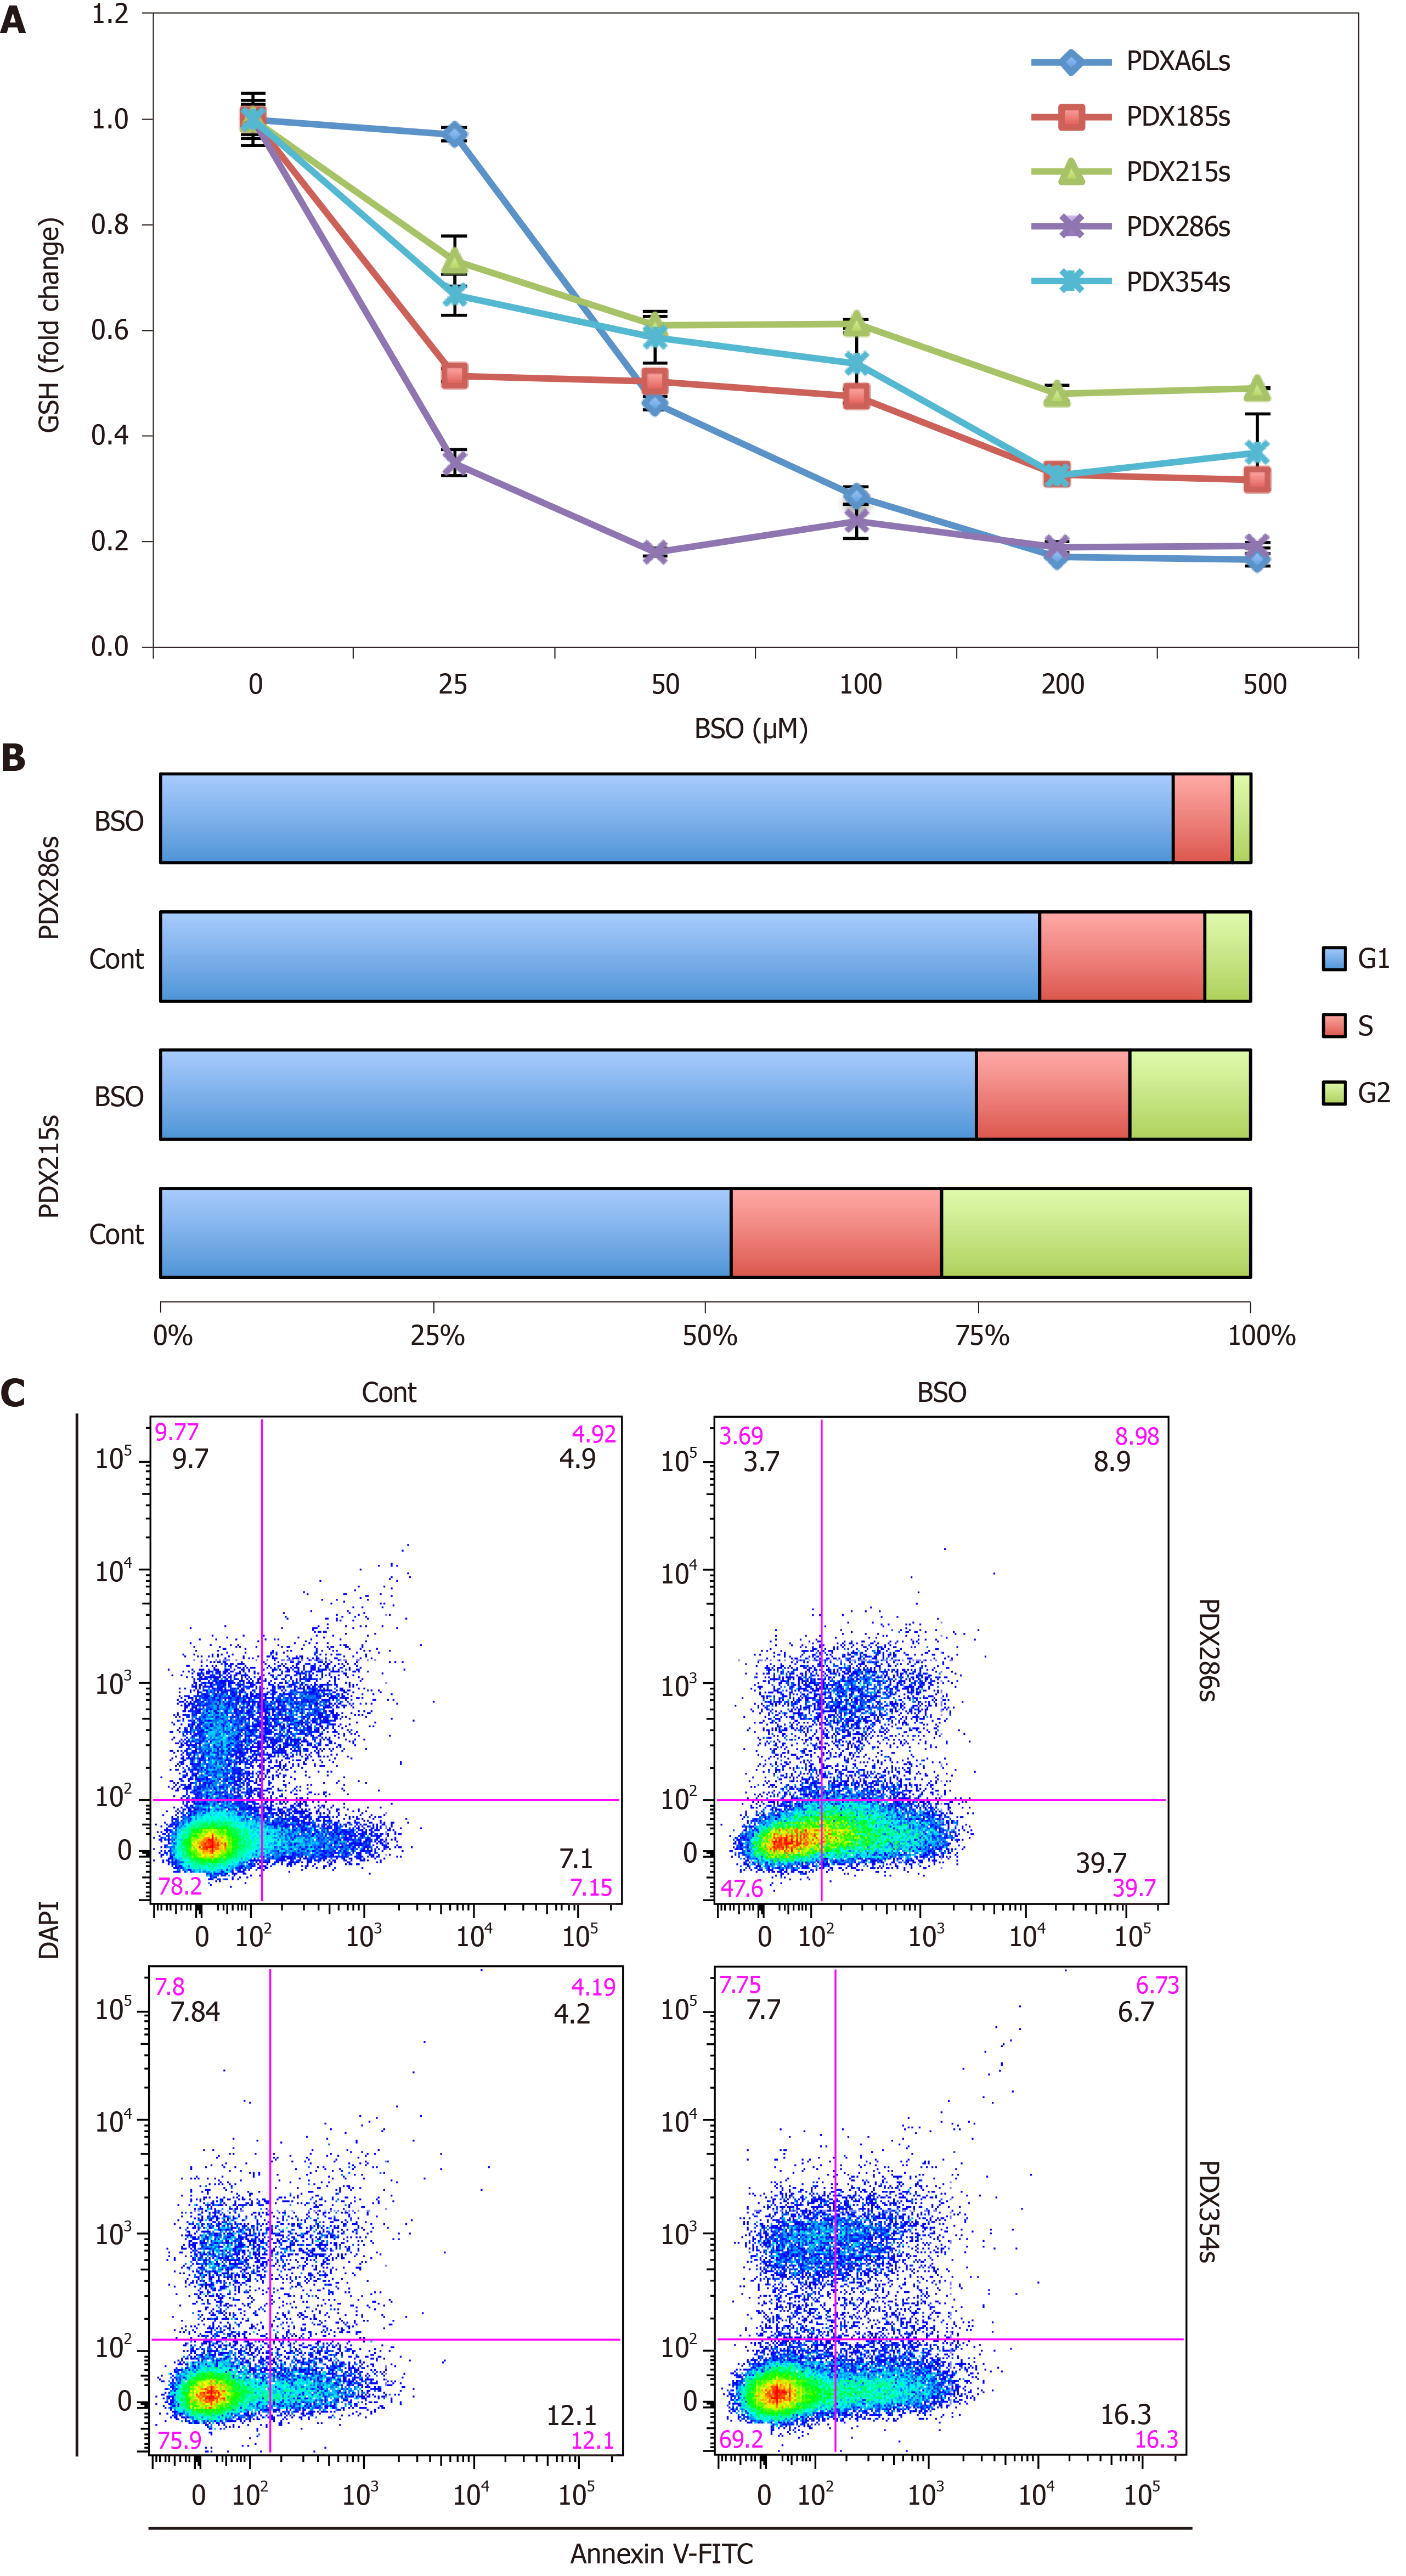
Figure 4 Inhibition of glutathione synthesis blocks cell cycle progression and induces apoptosis in cancer stem cell-enriched cultures.
Cells from the indicated patient-derived xenograft models were grown in cancer stem cell-enriching conditions as spheres for 5 d and then treated for 48 h with 100 µmol/L buthionine-sulfoximine (BSO), unless indicated otherwise. A: Dose-dependent inhibition of glutathione (GSH) content by BSO measured by fluorimetry after staining with monochlorobimane (mClB); B: Percentage of cells in the different phases of the cell cycle as assessed by flow cytometry; C: Representative FACS plots of an Annexin-V/DAPI staining to detect apoptosis under the indicated conditions. GSH: Glutathione content in its reduced form; BSO: Buthionine-sulfoximine; PDX: Patient-derived xenograft.
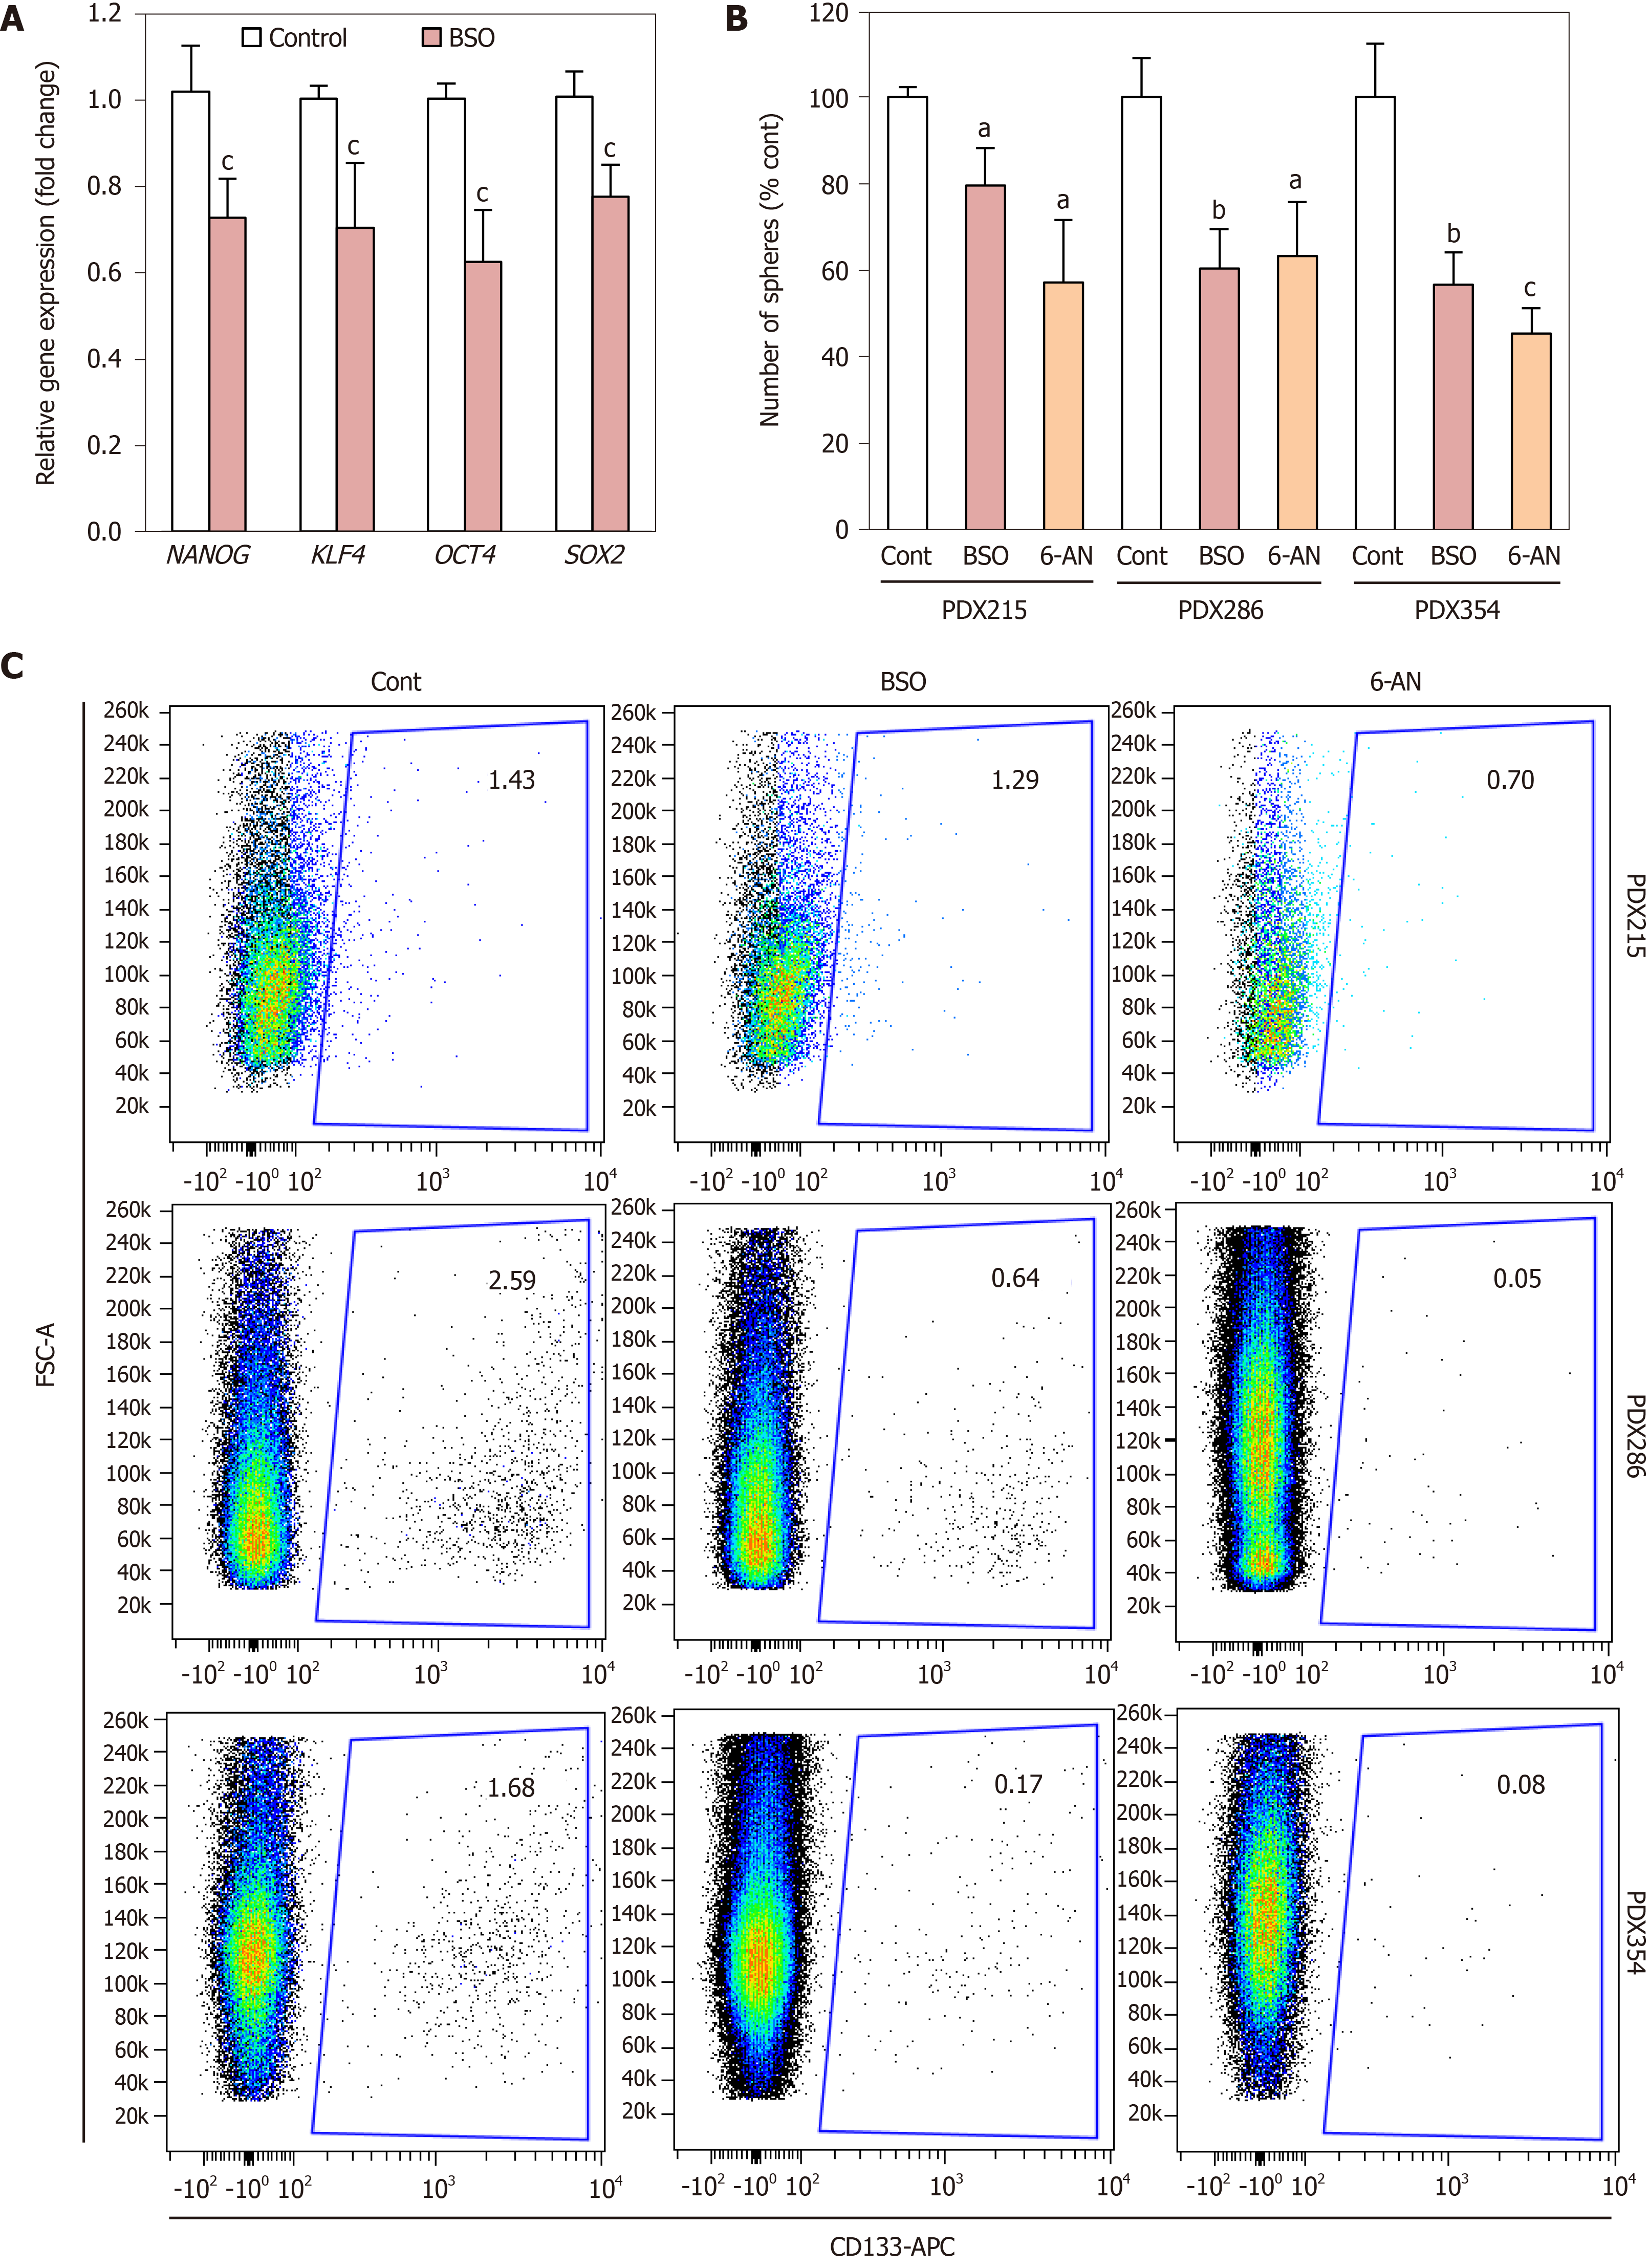
Figure 5 Inhibition of glutathione synthesis and recycling decreases self-renewal and CD133 expression.
Cells from the indicated patient-derived xenografts (PDXs) were treated with 100 µmol/L buthionine-sulfoximine or 1 µmol/L 6-Aminonicotinamide as indicated. A: Expression of stemness gene expression following 72 h of treatment; B: Sphere formation ability after 7 d of treatment, replenished every other day. Data are shown as fold change vs untreated conditions (Cont) for each PDX model, mean ± SE; C: Representative flow cytometry plots for CD133 expression after 48 h of treatment. aP < 0.05; bP < 0.01; cP < 0.001. BSO: Buthionine-sulfoximine; PDX: Patient-derived xenograft; 6-AN: 6-Aminonicotinamide.
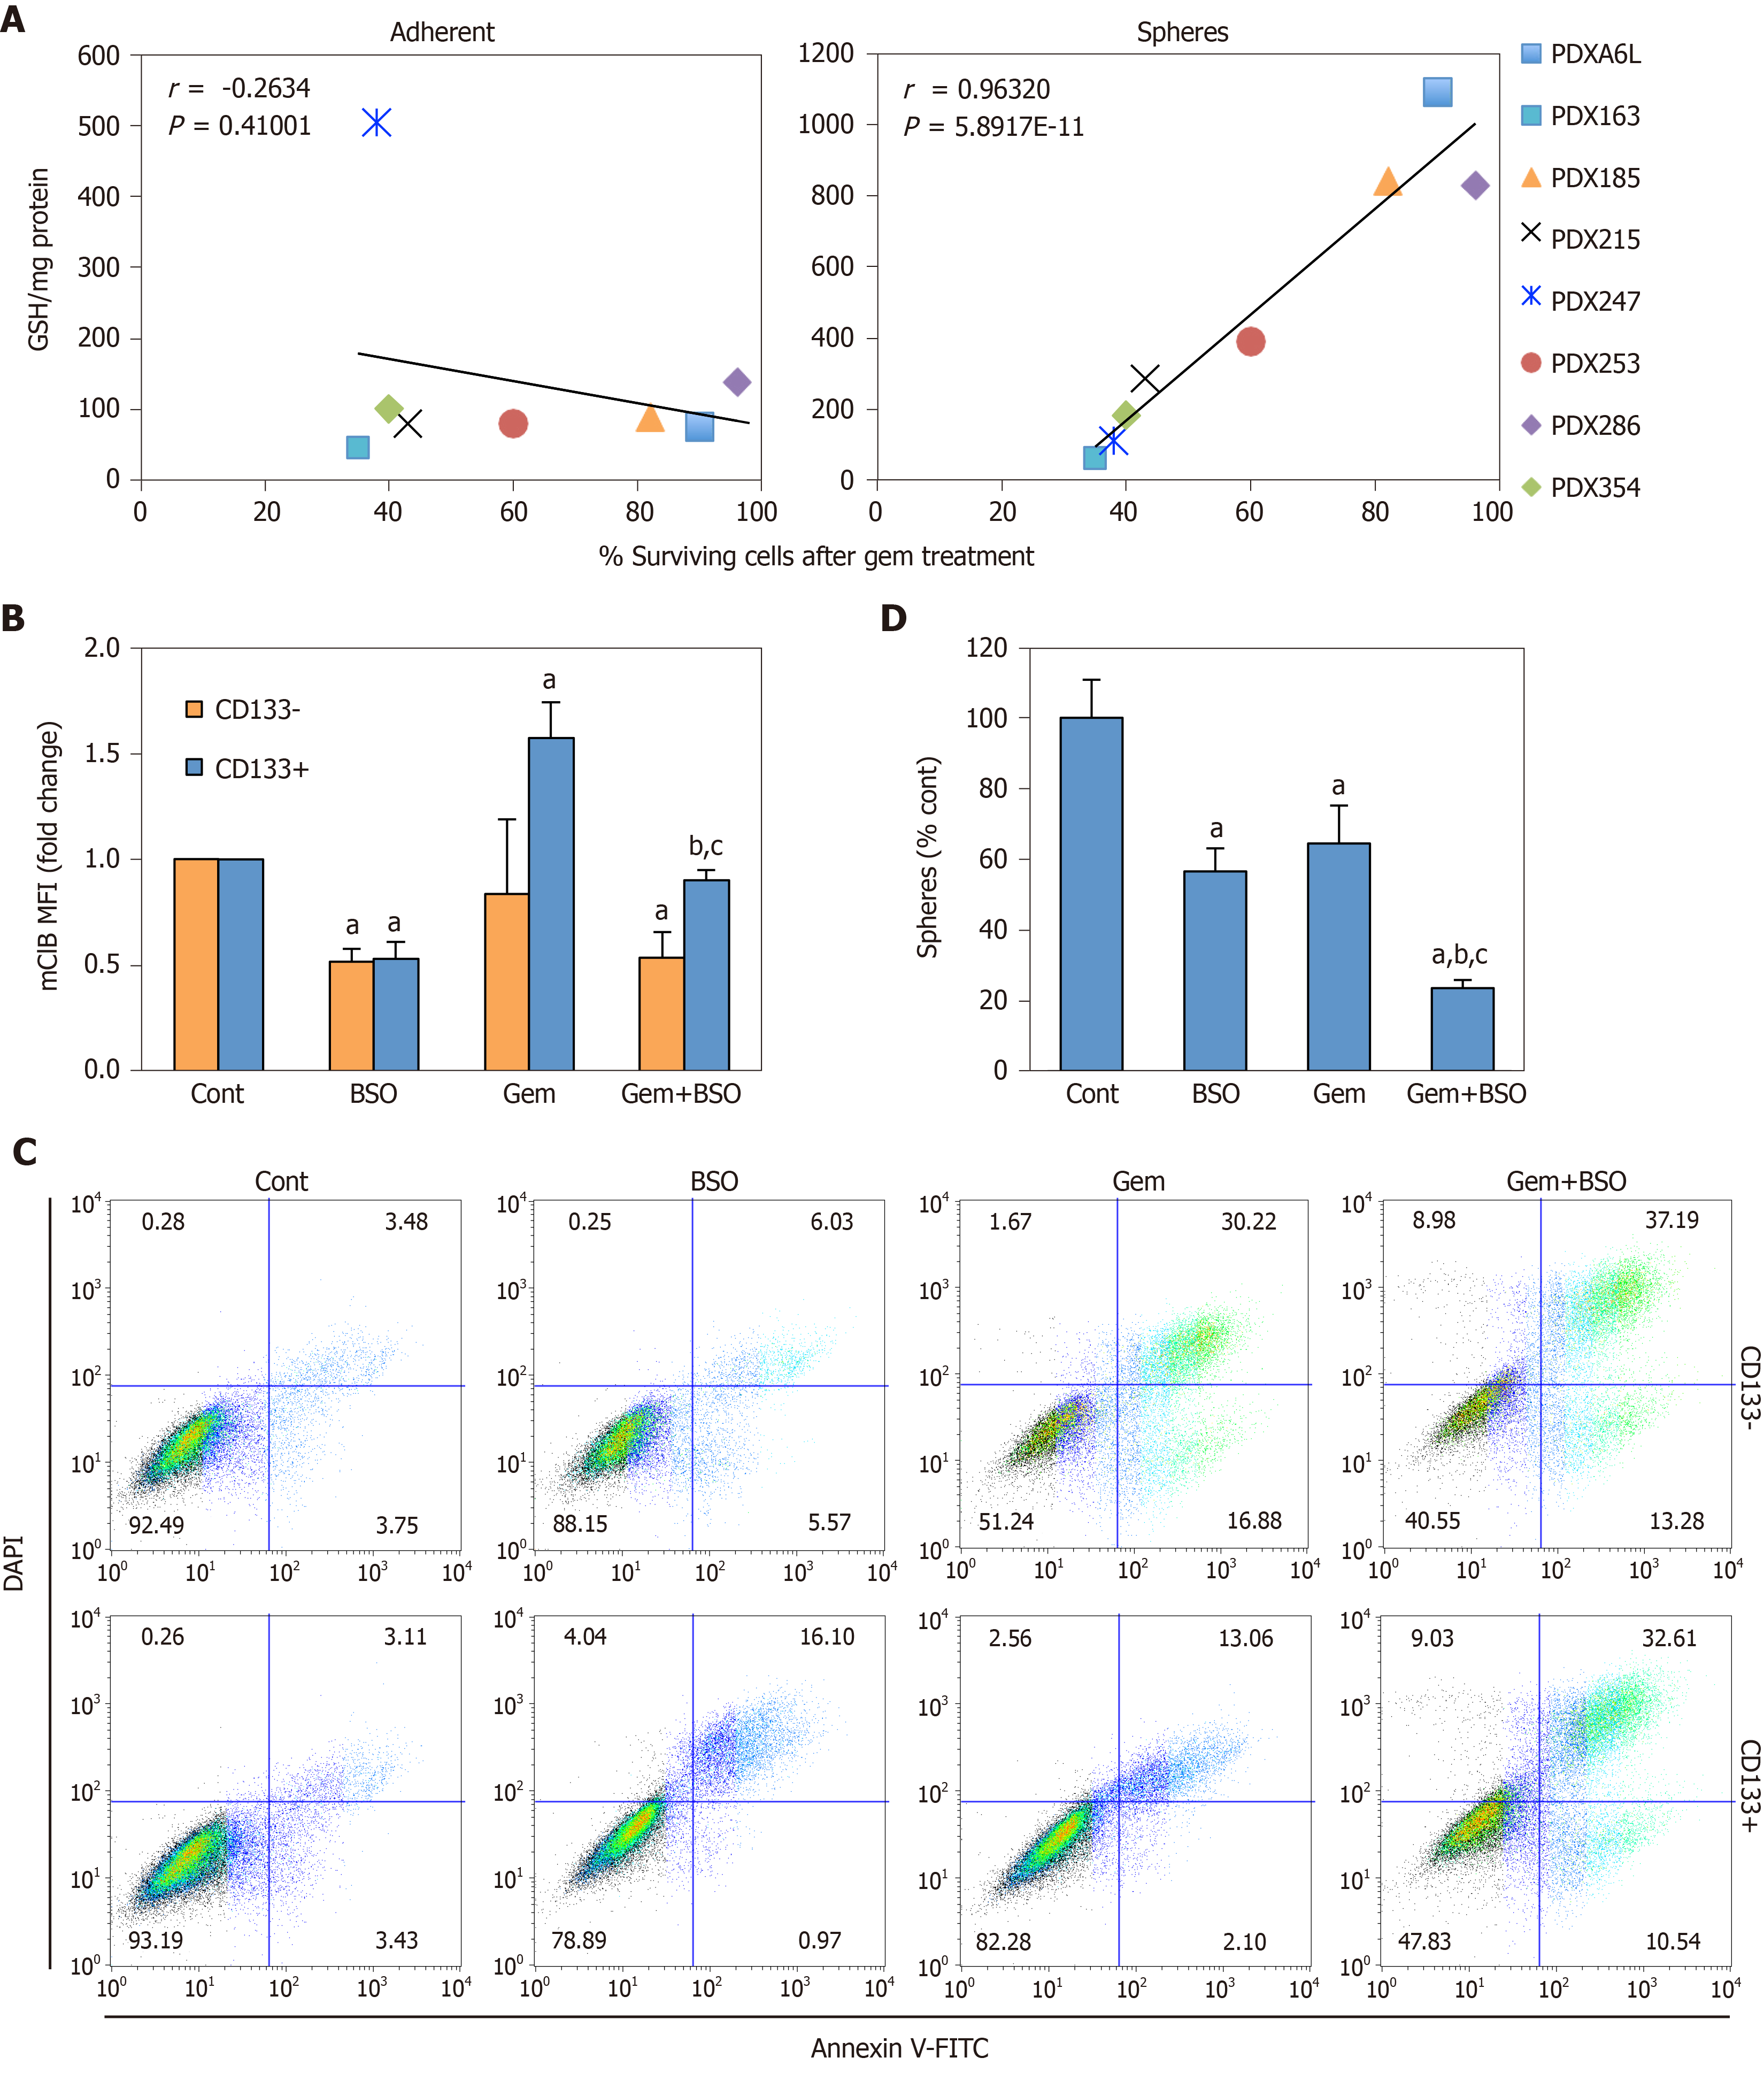
Figure 6 Depletion of glutathione (GSH) content in cancer stem cells enhances response to Gemcitabine.
A: Correlation of the absolute glutathione (GSH) content per milligram of protein in lysates from adherent (left panel) or sphere (right panel) cultures vs the percentage of surviving cells following gemcitabine treatment (300 nM, 48 h). Values for Pearson´s r and corresponding P values are shown; B-D: Patient-derived xenograft 354 cells were treated with 100 µmol/L buthionine-sulfoximine (BSO) alone or in combination with 1 µmol/L Gemcitabine; B: mClB staining for GSH content in CD133– vs CD133+ cells after 48 h of treatment; C: Representative flow cytometry plots for Annexin V/DAPI staining for samples shown in B; D: Number of spheres following 7 d of treatment. Data in B and D are shown as mean fold change or mean percentage ± SE, with untreated conditions (Cont) set as 1.0 or 100%, respectively. aP < 0.001 vs Cont; bP < 0.001 vs BSO; cP < 0.001 vs Gemcitabine. GSH: Glutathione content in its reduced form; PDX: Patient-derived xenograft; MFI: Mean fluorescence intensities; BSO: Buthionine-sulfoximine.
- Citation: Jagust P, Alcalá S, Sainz Jr B, Heeschen C, Sancho P. Glutathione metabolism is essential for self-renewal and chemoresistance of pancreatic cancer stem cells. World J Stem Cells 2020; 12(11): 1410-1428
- URL: https://www.wjgnet.com/1948-0210/full/v12/i11/1410.htm
- DOI: https://dx.doi.org/10.4252/wjsc.v12.i11.1410


