Copyright
©The Author(s) 2019.
World J Stem Cells. Nov 26, 2019; 11(11): 920-936
Published online Nov 26, 2019. doi: 10.4252/wjsc.v11.i11.920
Published online Nov 26, 2019. doi: 10.4252/wjsc.v11.i11.920
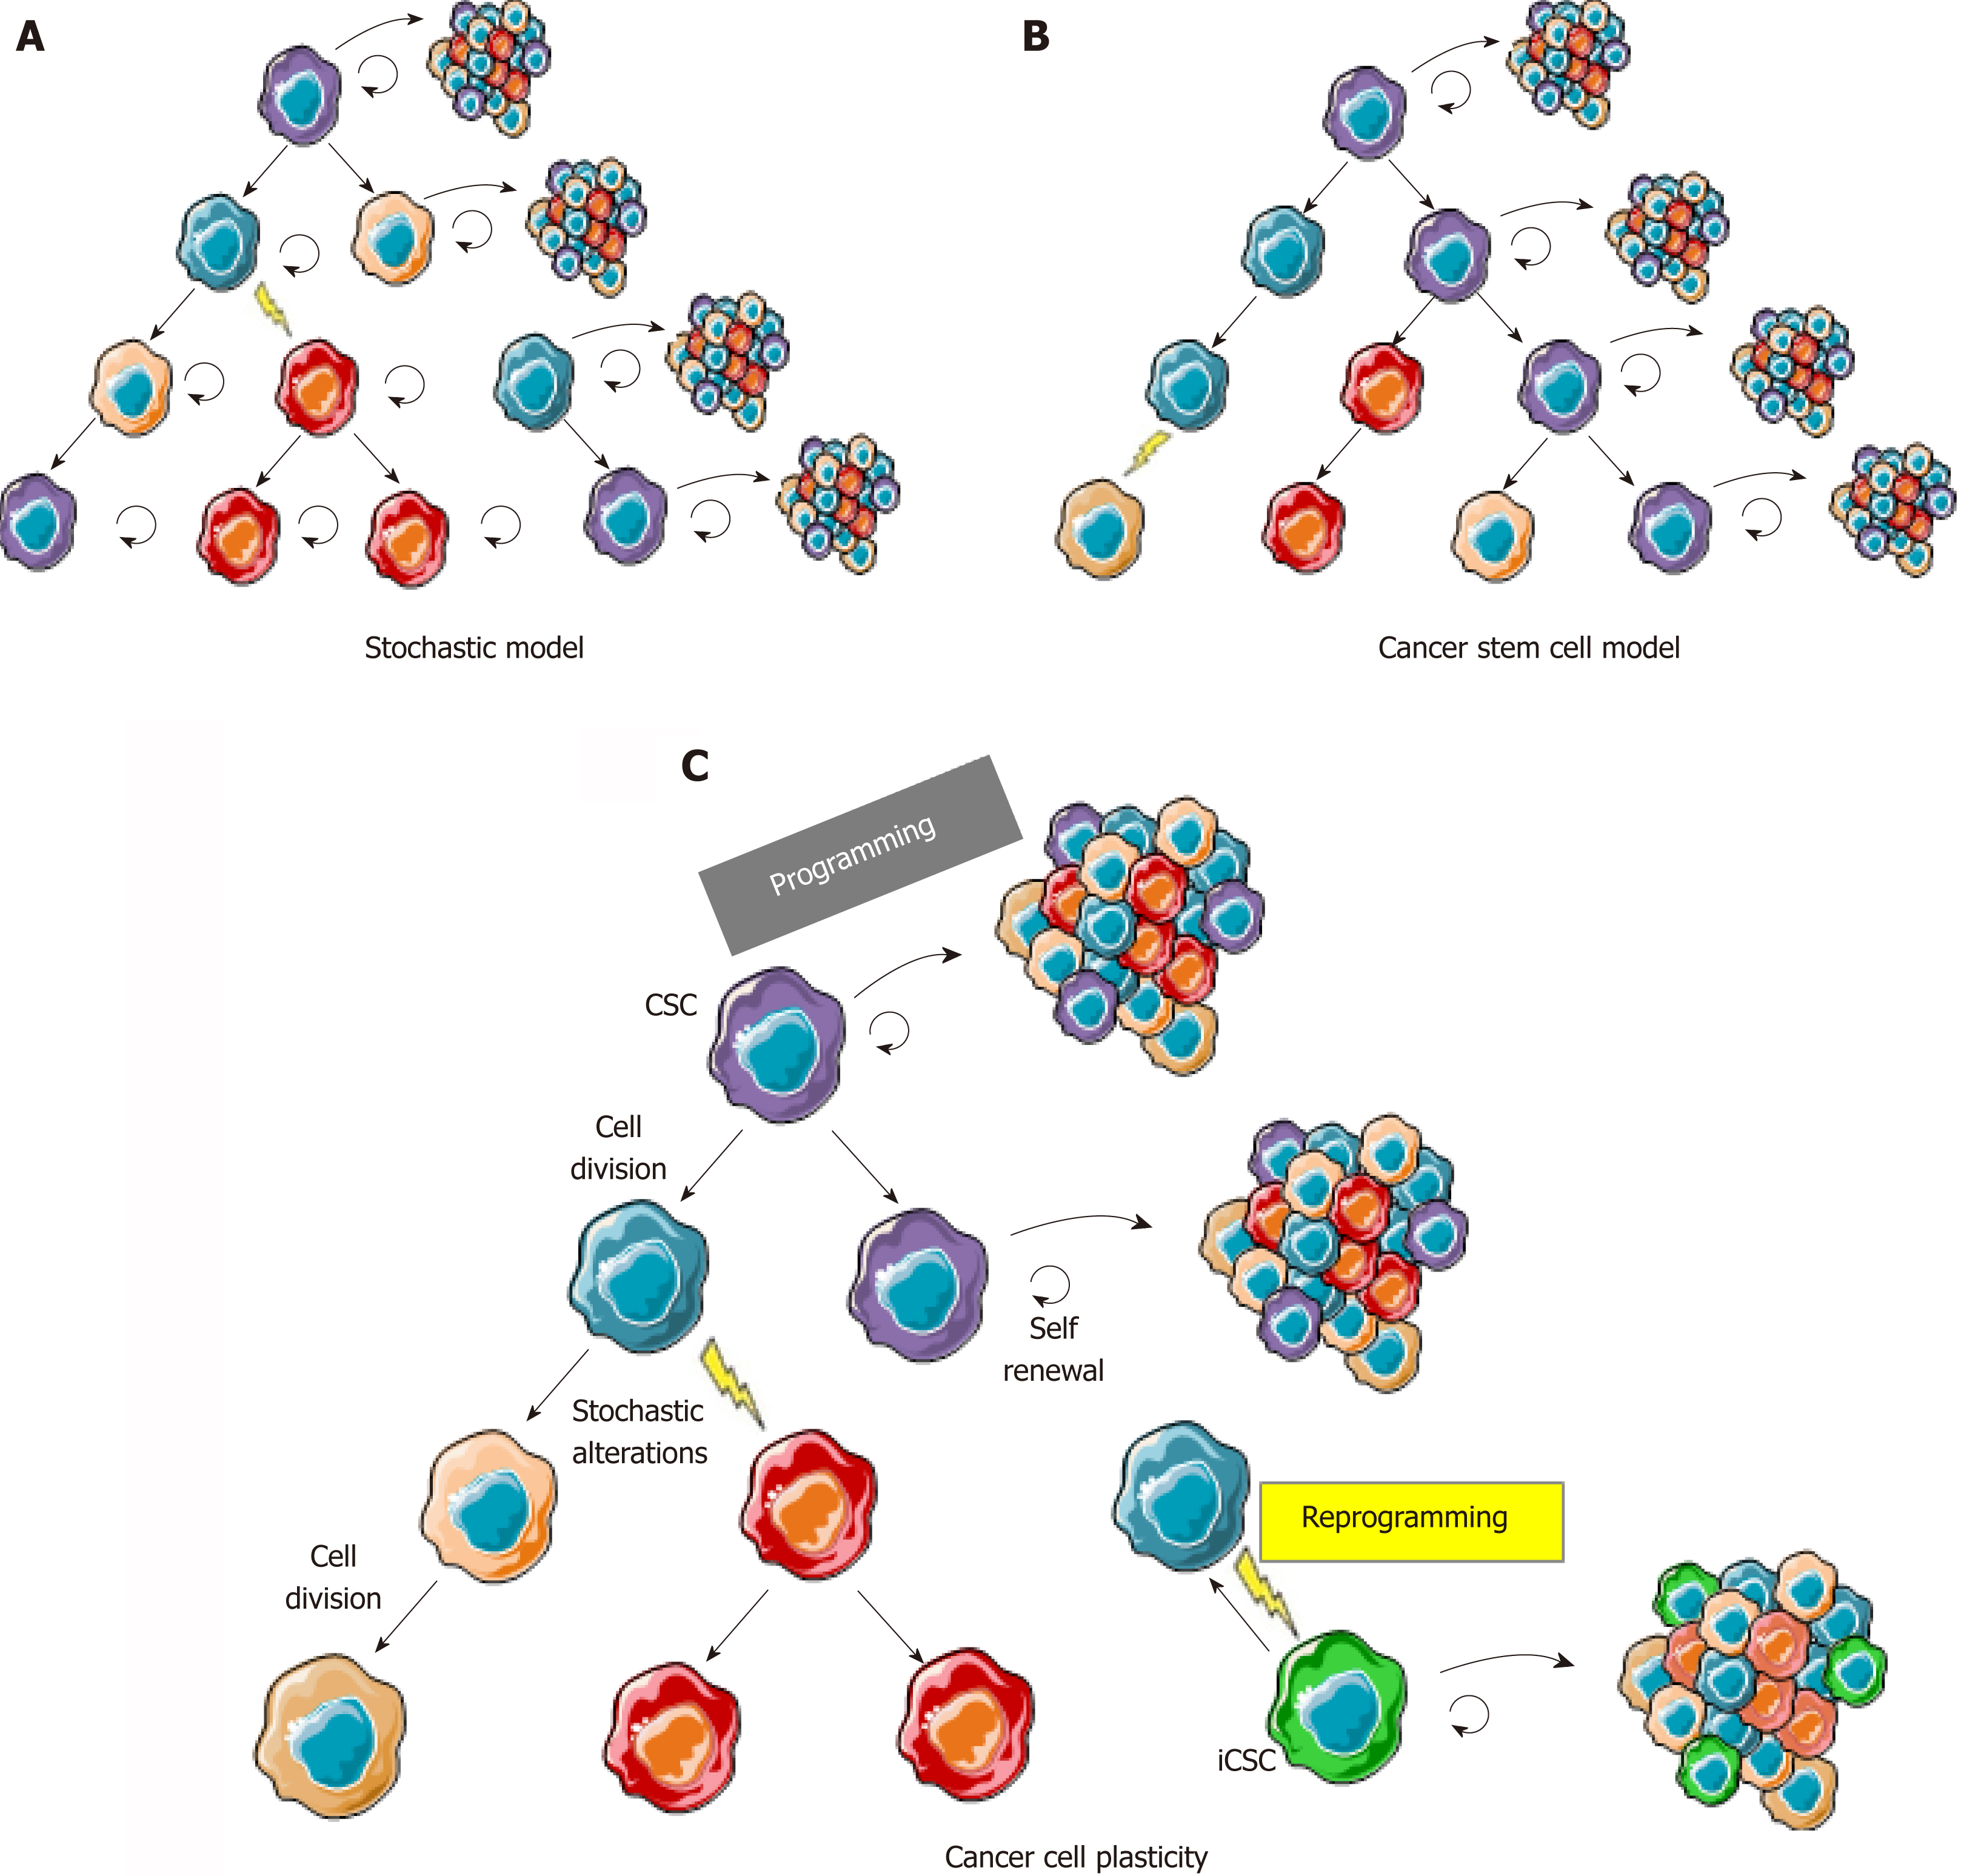
Figure 1 The cancer cell plasticity model reconciles cancer stem cell and stochastic models.
A: In the stochastic model, cancer cells are heterogeneous because of accumulation of genetic and epigenetic alterations acquired through excessive proliferation, but most cells are able to proliferate and initiate new tumors; B: In the cancer stem cell model, cancer cells are organized in a hierarchy comparable to normal tissues where CSCs (in purple) are the only cells able to regenerate a tumor with its whole heterogeneity; C: In the cancer plasticity model, cancer cells are able to rapidly switch back and forth between a stem and a non-stem state. CSCs change to non-stem cell most likely occurs through epigenetic programming and silencing of cancer stem cell/pluripotency markers. Reprogramming, leading to induced CSCs (in green) from non-stem cancer cells, can either occur through reversible epigenetic modifications or genetic alterations, hence leading to a new clonal population of cancer cells in the tumor. CSC: Cancer stem cell; iCSC: Induced CSC.
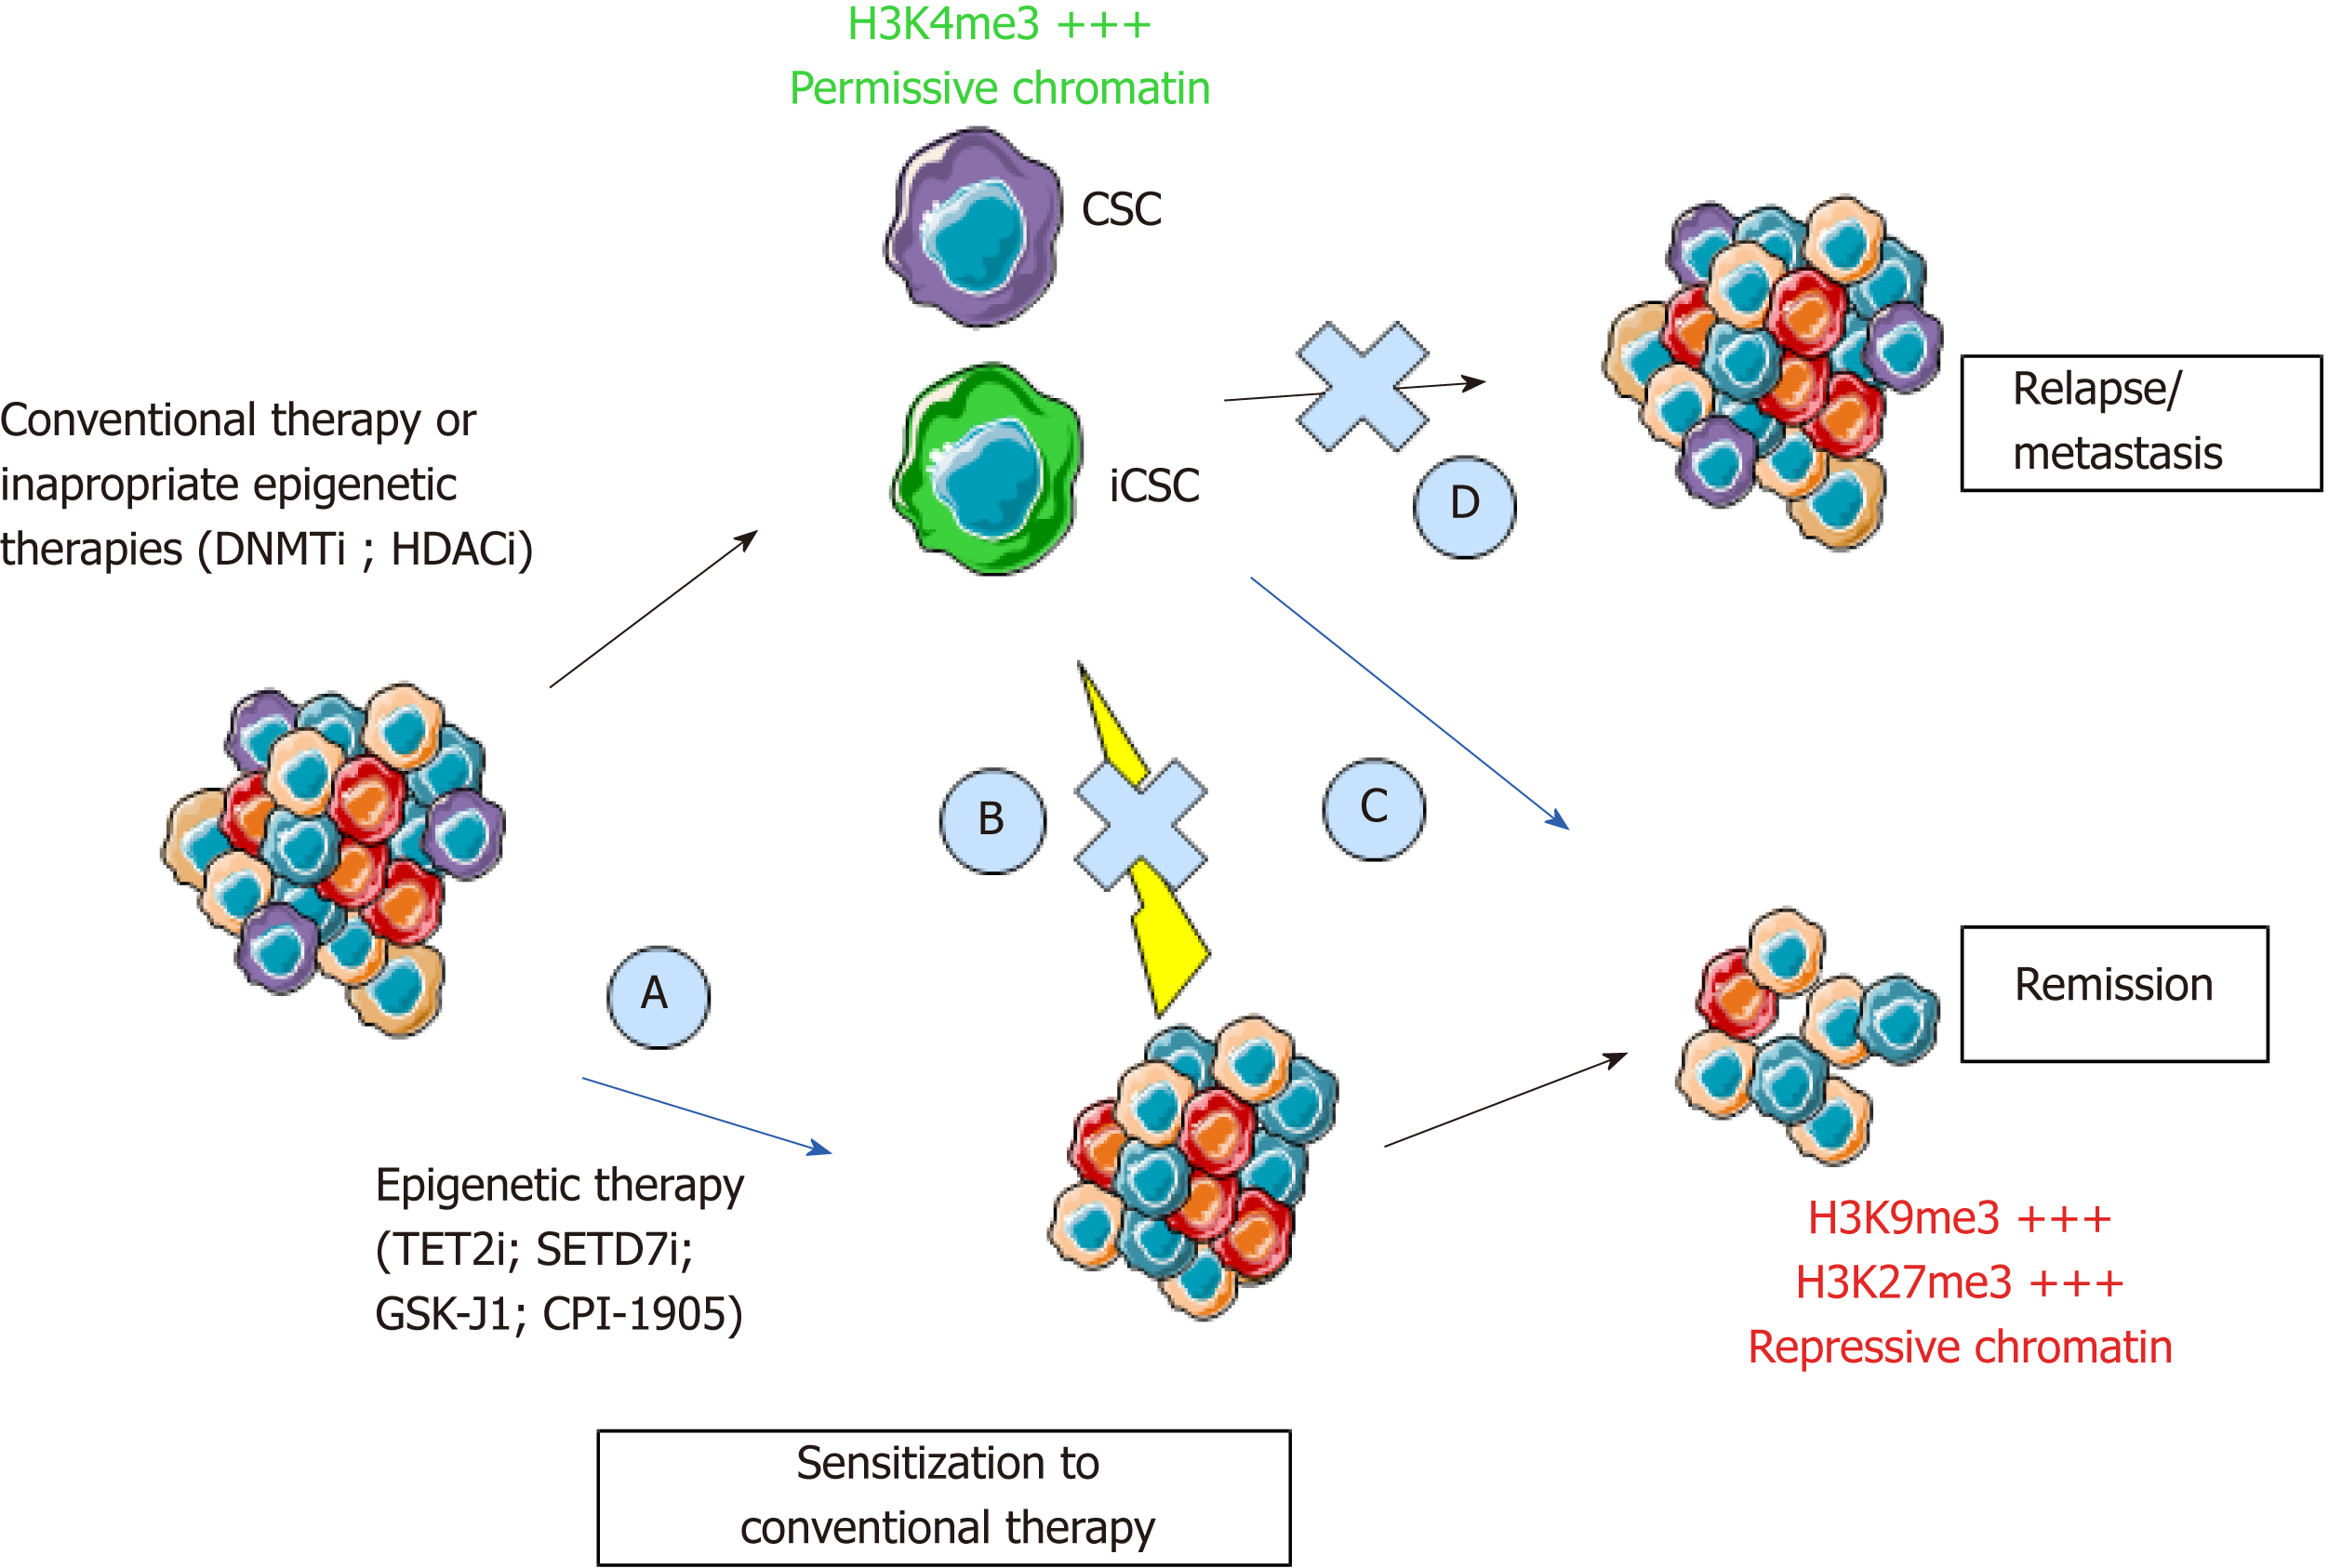
Figure 2 Epigenetic programming and reprogramming of cancer cells and consequences for therapeutic strategies.
New therapeutics will have to combine the targeting of the bulk of the tumor, pre-existing CSCs, and iCSCs through inhibition of cancer cell reprogramming. Epigenetic therapies could inhibit CSCs to sensitize cancer cells to conventional therapies (A, C), inhibit cancer cells reprogramming (B), and inhibit relapse through inhibition of self-renewal (D). CSC: Cancer stem cell; iCSC: Induced CSCs; DNMTi: DNA methyltransferase inhibitor; HDACi: Histone deacetylase inhibitor; TET2i: Ten-eleven-translocation 2 inhibitor; SETD7i: SET domain containing 7 inhibitor; H3K4me3: Trimethylation of lysine 4 on histone 3; H3K9me3: Trimethylation of lysine 9 on Histone 3; H3K27me3: Trimethylation of lysine 27 on histone 3.
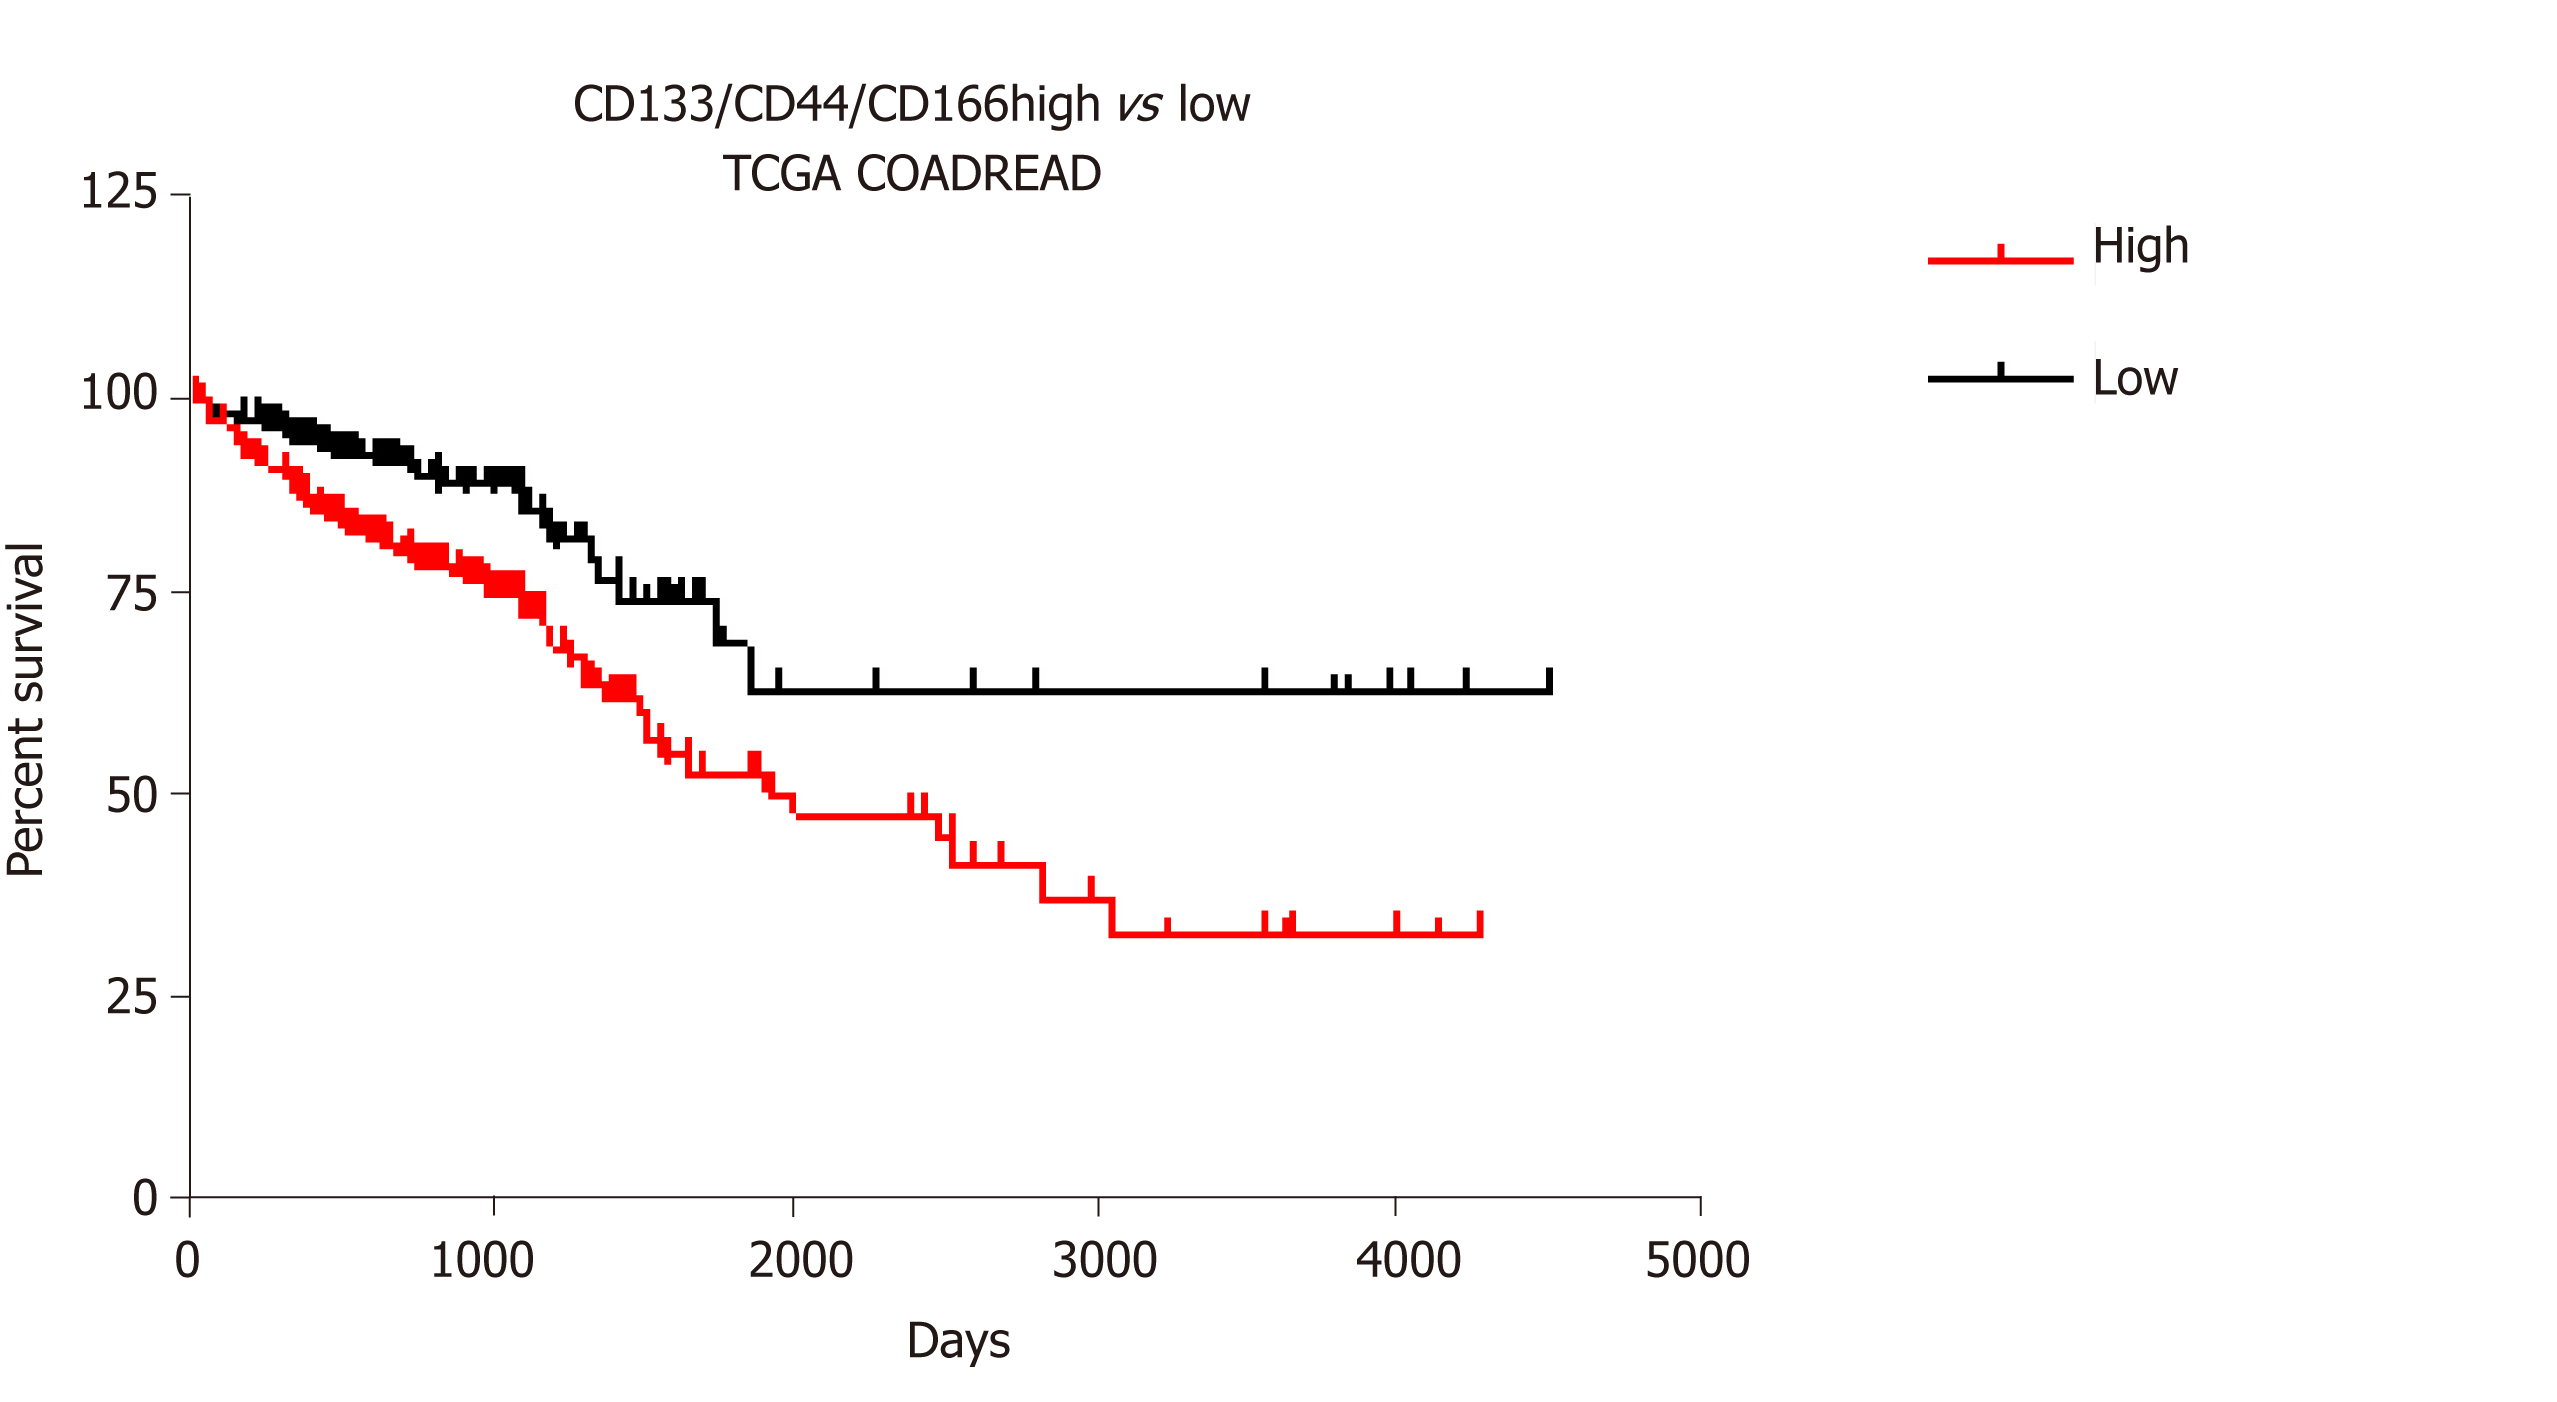
Figure 3 Survival analysis for CD133/CD44/CD166 expression profiles in colorectal cancer.
The association of CD133/CD44/CD166 transcript expression with cancer survival in the COADREAD Cancer Genome Atlas dataset was analyzed using the SurvExpress portal[62]. Kaplan-Meier plot and Cox survival statistics were established with maximized risk group assessment (466 patients with 255 in low vs 211 in high risk profile). The log rank for equal curves indicated a significant difference (P value = 0.0007) with a hazard ratio of 2.12 (95%CI: 1.35-3.31, P value = 0.0009).
- Citation: Vincent A, Ouelkdite-Oumouchal A, Souidi M, Leclerc J, Neve B, Van Seuningen I. Colon cancer stemness as a reversible epigenetic state: Implications for anticancer therapies. World J Stem Cells 2019; 11(11): 920-936
- URL: https://www.wjgnet.com/1948-0210/full/v11/i11/920.htm
- DOI: https://dx.doi.org/10.4252/wjsc.v11.i11.920


