Copyright
©The Author(s) 2024.
World J Gastroenterol. Jan 14, 2024; 30(2): 170-183
Published online Jan 14, 2024. doi: 10.3748/wjg.v30.i2.170
Published online Jan 14, 2024. doi: 10.3748/wjg.v30.i2.170
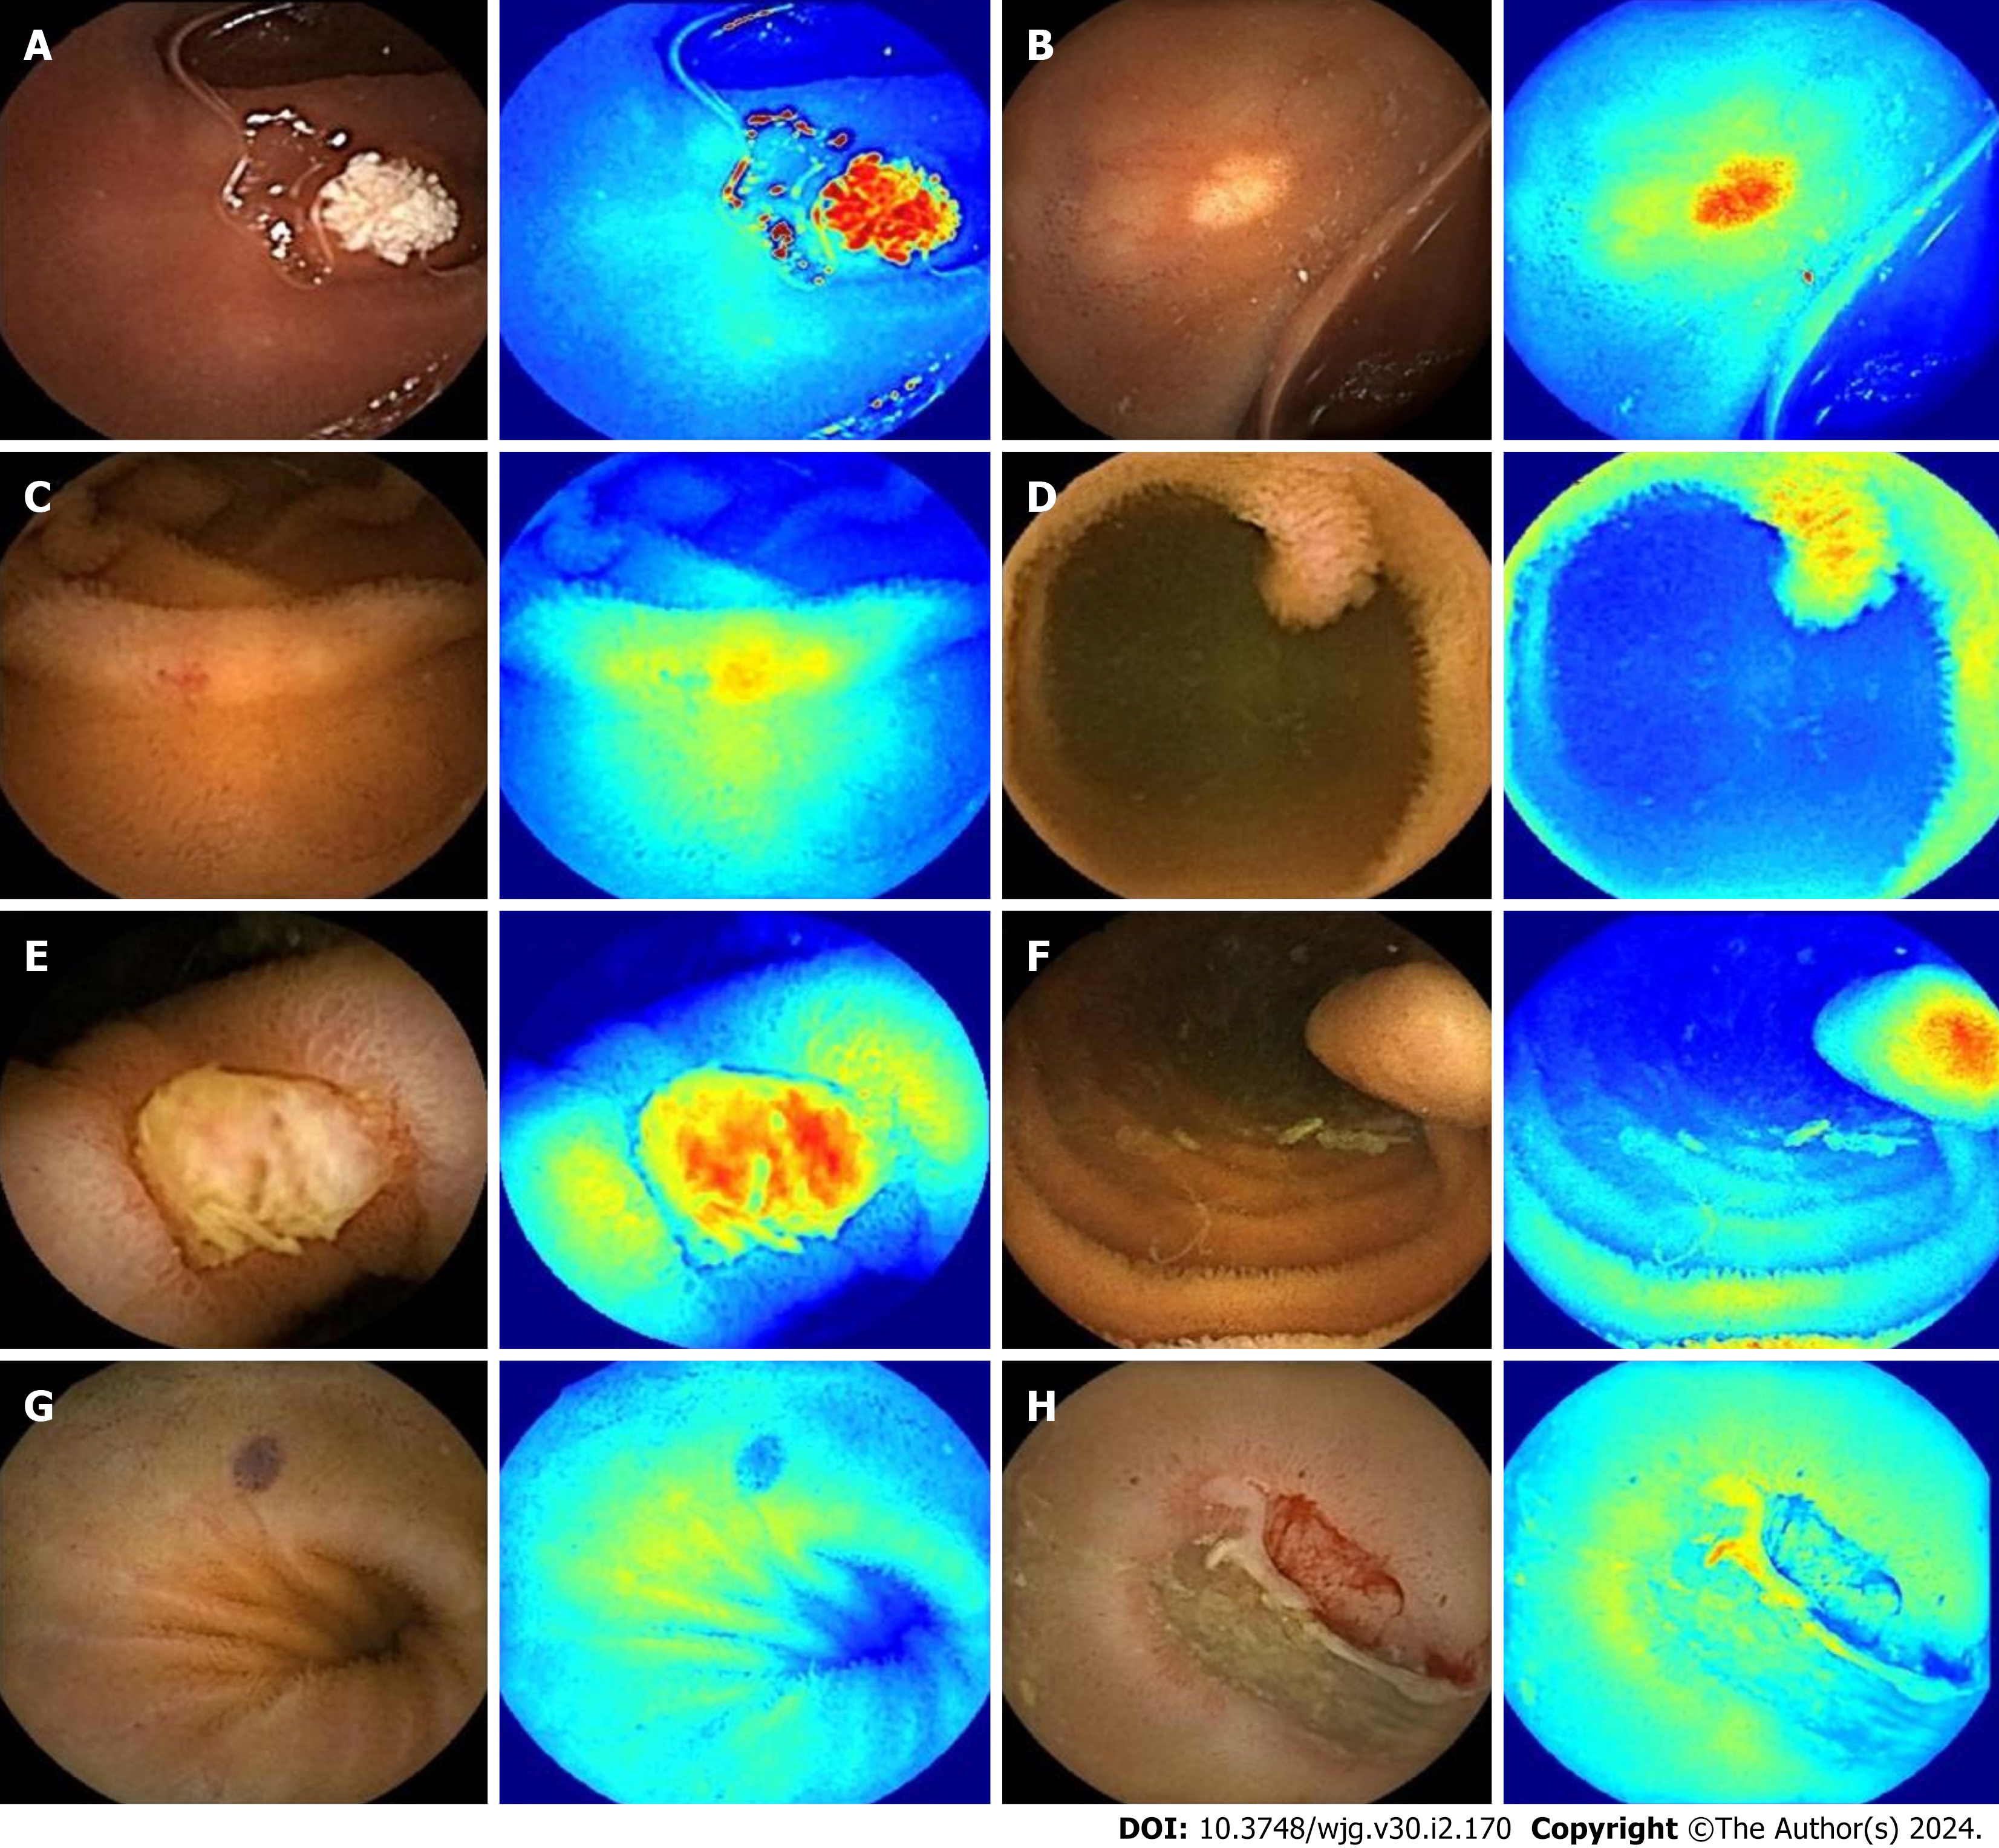
Figure 5 Software-generated image representation of the heat map.
A: P0Lk (lymphangiectasia); B: P0X (xanthoma); C: P1E (erosion); D: P1P (protruding lesion smaller than 1 cm); E: P2U (ulcer larger than 2 cm); F: P2P (protruding lesion larger than 1 cm); G: P2V (vascular lesion); H: B (bleeding).
- Citation: Zhang RY, Qiang PP, Cai LJ, Li T, Qin Y, Zhang Y, Zhao YQ, Wang JP. Automatic detection of small bowel lesions with different bleeding risks based on deep learning models. World J Gastroenterol 2024; 30(2): 170-183
- URL: https://www.wjgnet.com/1007-9327/full/v30/i2/170.htm
- DOI: https://dx.doi.org/10.3748/wjg.v30.i2.170


