Copyright
©The Author(s) 2023.
World J Gastroenterol. Jul 14, 2023; 29(26): 4200-4213
Published online Jul 14, 2023. doi: 10.3748/wjg.v29.i26.4200
Published online Jul 14, 2023. doi: 10.3748/wjg.v29.i26.4200
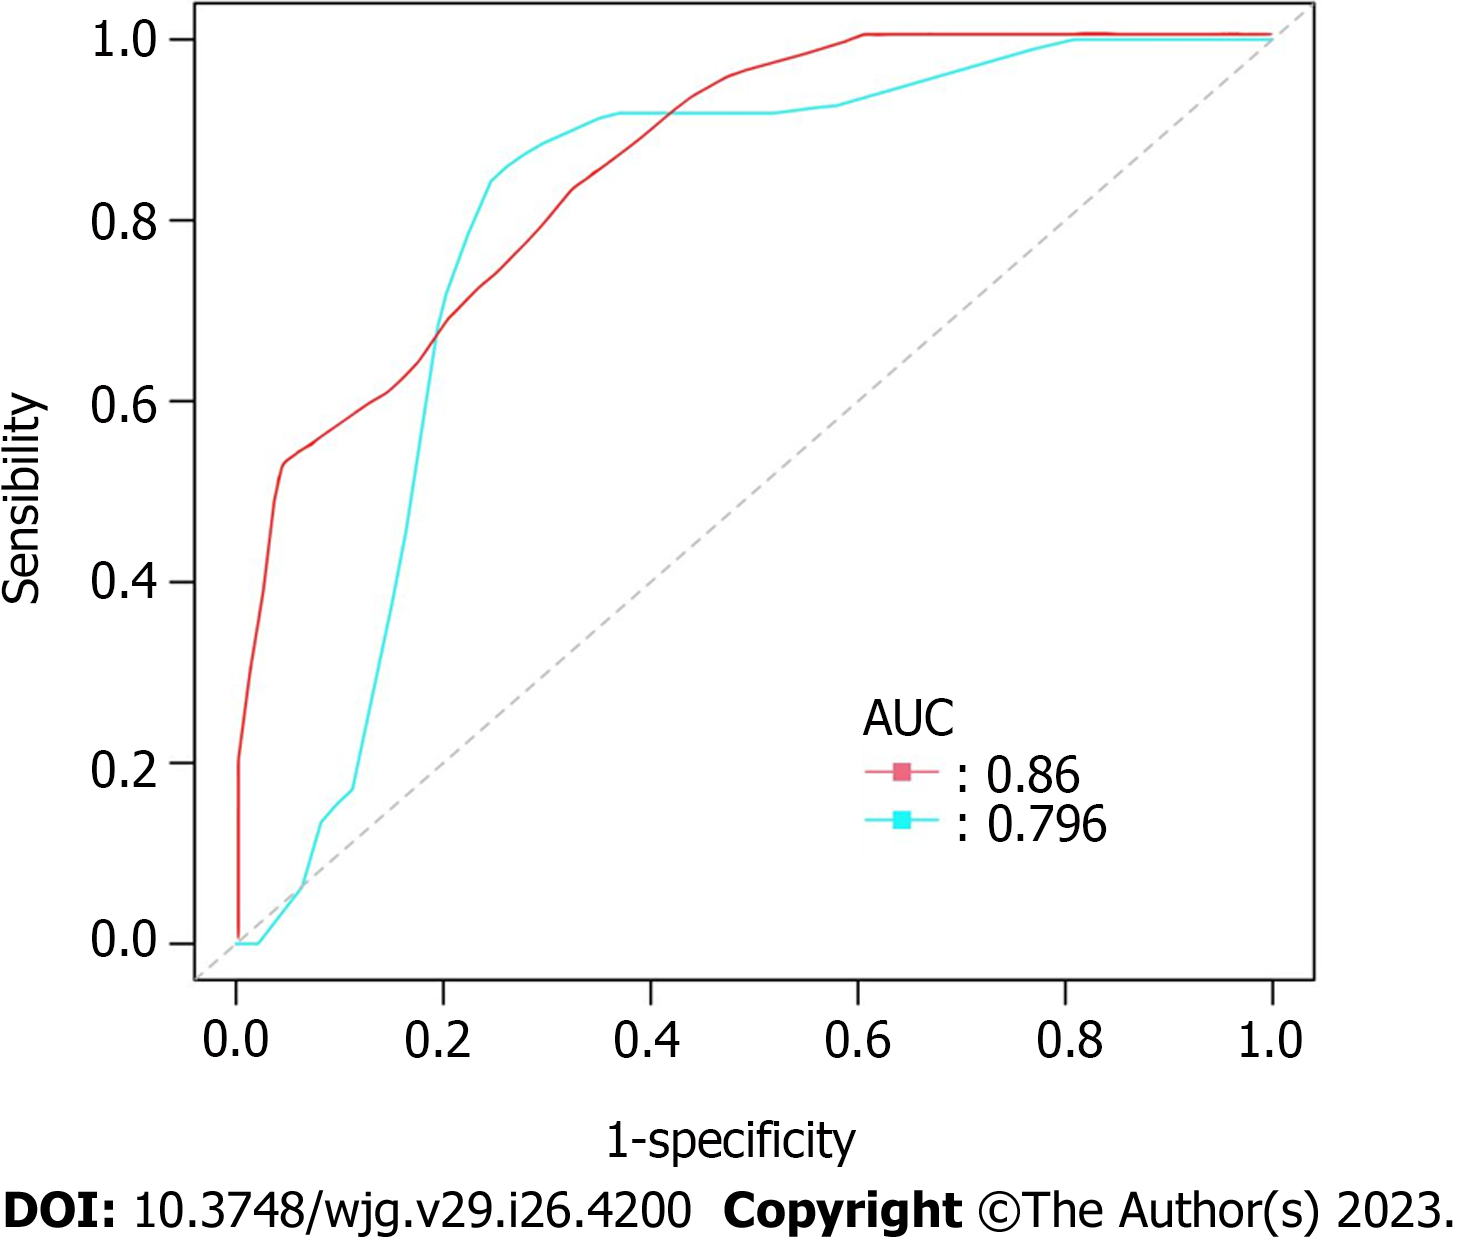
Figure 4 Receiver operating characteristic curves for two risk grade system in predicting overall survival of gastrointestinal stromal tumors.
The red curve represents for the new risk grade model and the blue one represents for National Institutes of Health (NIH) 2008 Risk Grade System. The area under the curve was 0.860 for the new risk grade model, while 0.796 for NIH 2008 Risk Grade System. Compared with the traditional NIH 2008 system, the new model which is with consideration of raf kinase inhibitory protein and phosphorylated-extracellular-signal regulated kinase is correlated with a better prediction efficiency for overall survival of gastrointestinal stromal tumors, the difference was significant. Log-rank analysis, P = 0.0312. AUC: Area under curve.
- Citation: Qu WZ, Wang L, Chen JJ, Wang Y. Raf kinase inhibitor protein combined with phosphorylated extracellular signal-regulated kinase offers valuable prognosis in gastrointestinal stromal tumor. World J Gastroenterol 2023; 29(26): 4200-4213
- URL: https://www.wjgnet.com/1007-9327/full/v29/i26/4200.htm
- DOI: https://dx.doi.org/10.3748/wjg.v29.i26.4200


