Copyright
©The Author(s) 2022.
World J Gastroenterol. Sep 14, 2022; 28(34): 4993-5006
Published online Sep 14, 2022. doi: 10.3748/wjg.v28.i34.4993
Published online Sep 14, 2022. doi: 10.3748/wjg.v28.i34.4993
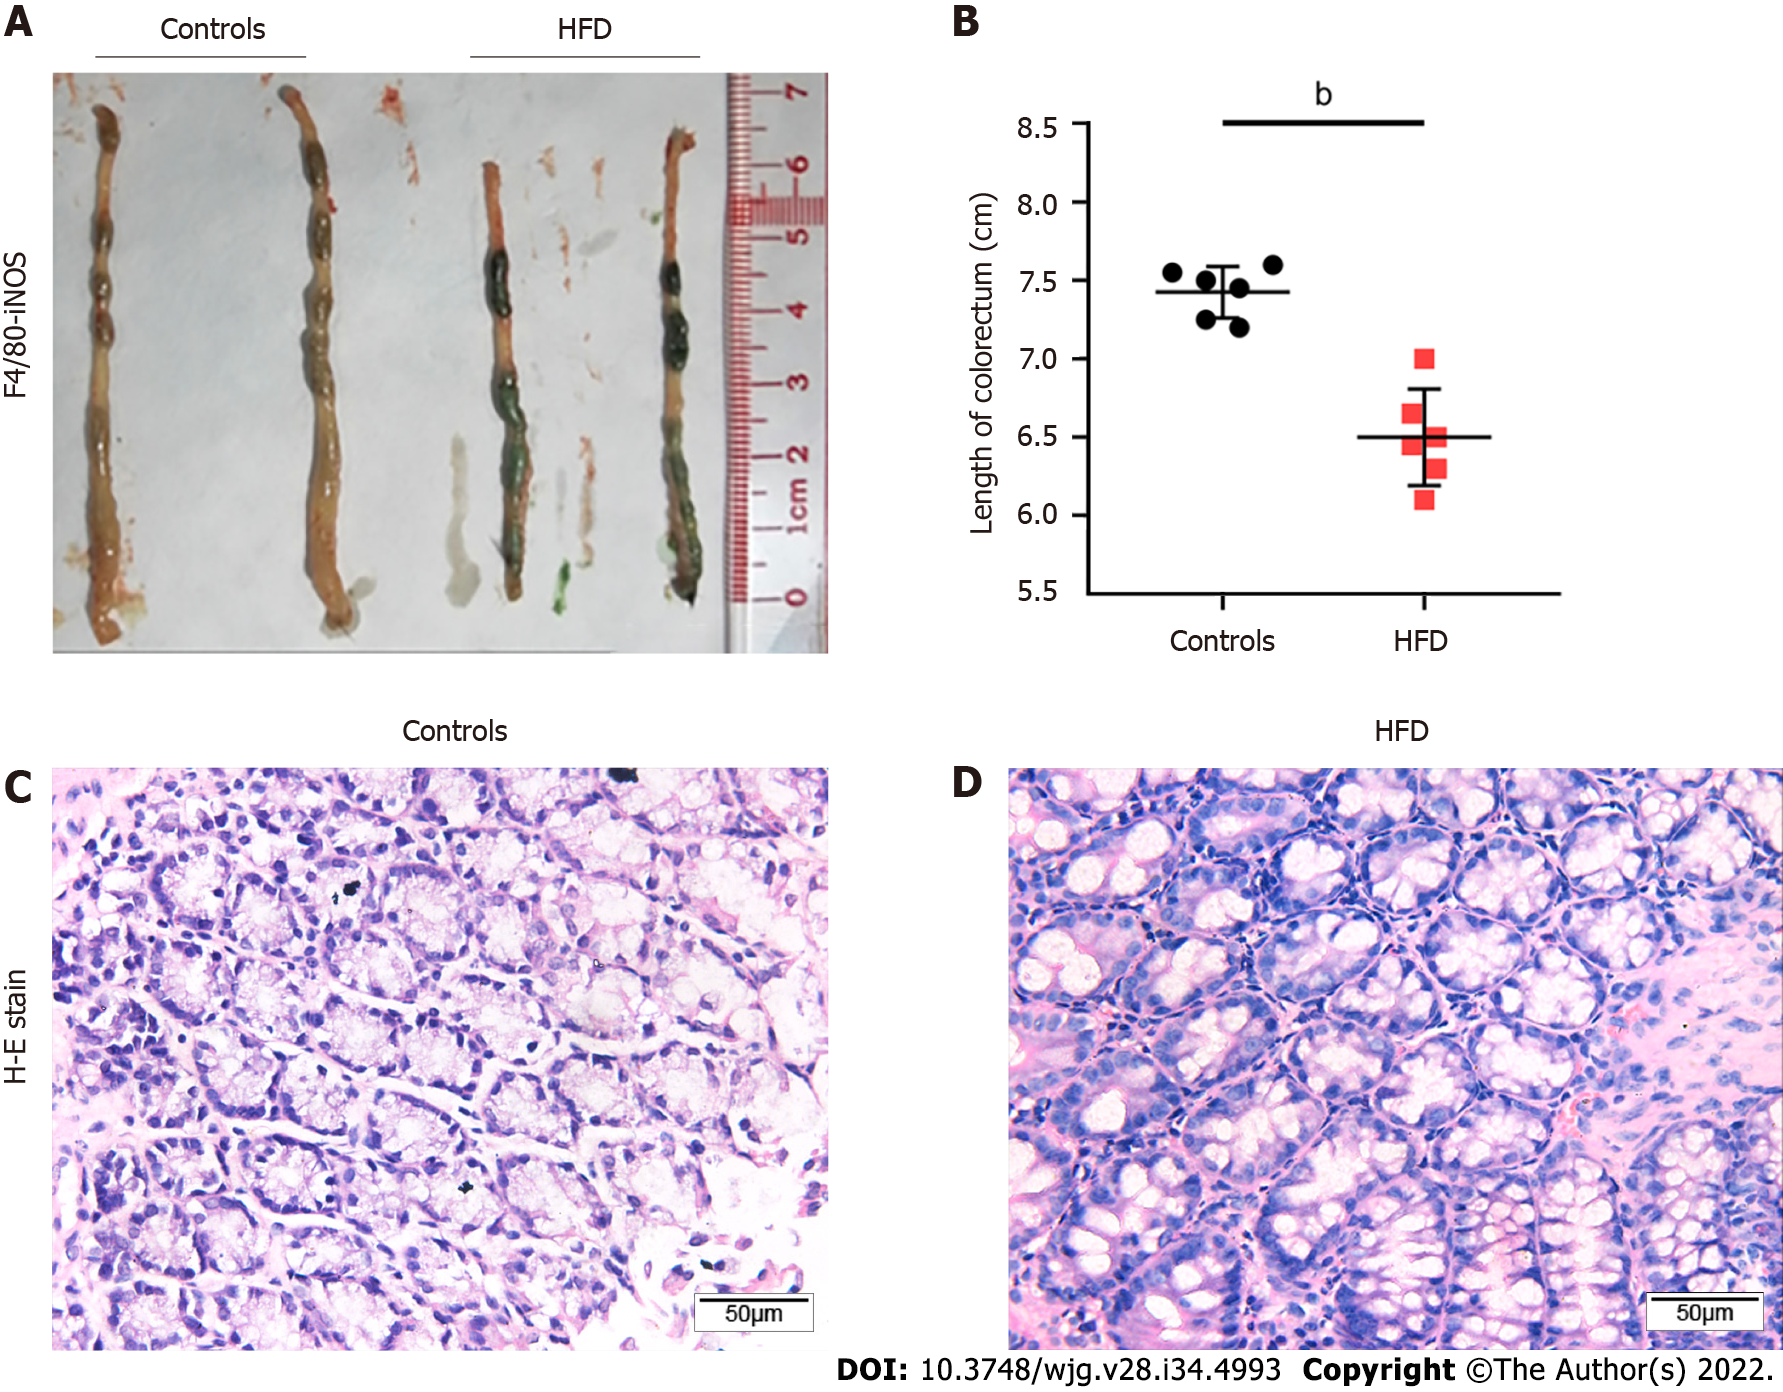
Figure 2 Establishment of a high-fat diet mouse model.
A: Length of colorectal segment of controls and high-fat diet (HFD) mice; B: Quantification of the length of colorectal segment of controls and HFD mice; C: Histopathological colorectal tissue sections of controls and HFD mice (scale bars represent 50 μm). Data are shown as the mean ± SD. Statistical analyses were conducted using an unpaired t-test. bP < 0.01. HFD: High-fat diet; H-E stain: Hematoxylin-eosin staining; iNOS: Inducible nitric oxide synthase.
- Citation: Zheng SM, Chen H, Sha WH, Chen XF, Yin JB, Zhu XB, Zheng ZW, Ma J. Oxidized low-density lipoprotein stimulates CD206 positive macrophages upregulating CD44 and CD133 expression in colorectal cancer with high-fat diet. World J Gastroenterol 2022; 28(34): 4993-5006
- URL: https://www.wjgnet.com/1007-9327/full/v28/i34/4993.htm
- DOI: https://dx.doi.org/10.3748/wjg.v28.i34.4993


