Copyright
©The Author(s) 2020.
World J Gastroenterol. Jun 7, 2020; 26(21): 2839-2851
Published online Jun 7, 2020. doi: 10.3748/wjg.v26.i21.2839
Published online Jun 7, 2020. doi: 10.3748/wjg.v26.i21.2839
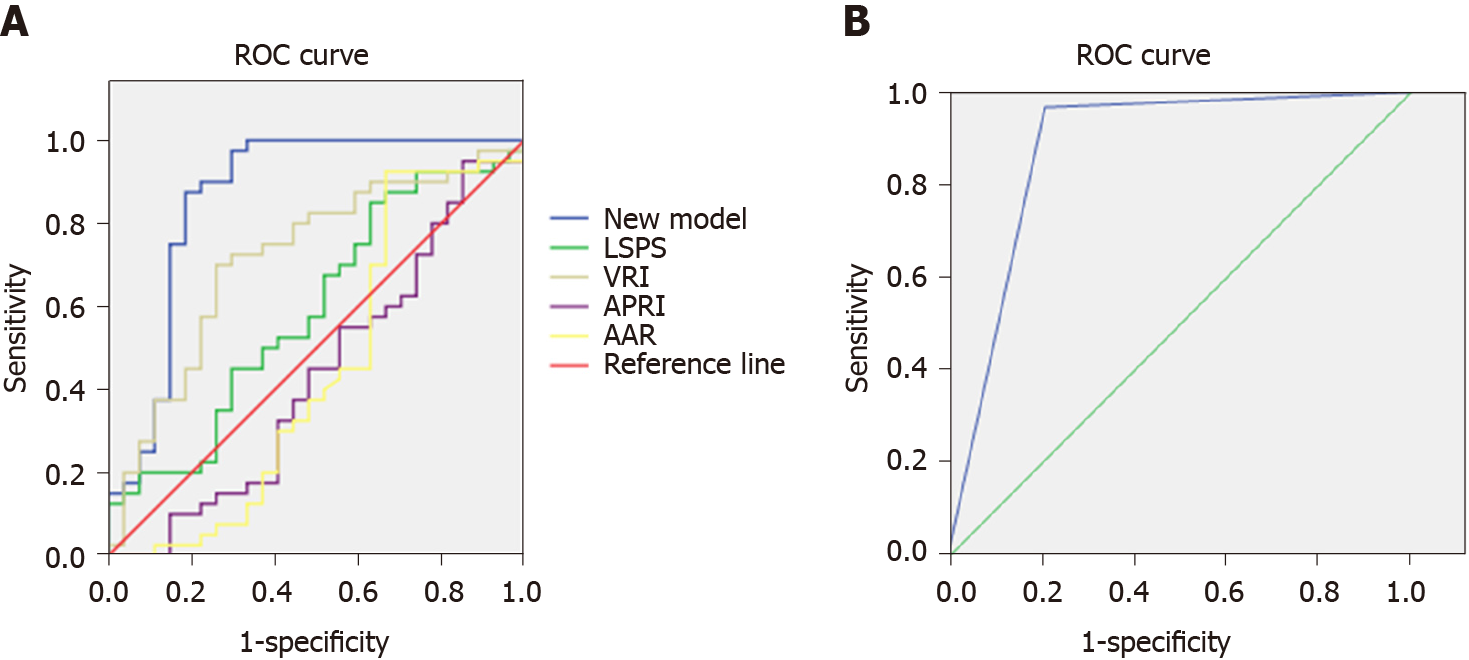
Figure 1 Area under the curve of various models in predicting high-risk esophageal varices of patients.
A: Modeling group; B: External validation group. The area under the curve of the new model in predicting high-risk esophageal varices of patients was 0.865 in the modeling group, which was higher than that of liver stiffness-spleen diameter to platelet ratio score, variceal risk index, aspartate transaminase to platelet ratio index, and aspartate transaminase /alanine aminotransferase ratio; and it was 0.879 in the external validation group. ROC: Receiver operating characteristic.
- Citation: Yang LB, Xu JY, Tantai XX, Li H, Xiao CL, Yang CF, Zhang H, Dong L, Zhao G. Non-invasive prediction model for high-risk esophageal varices in the Chinese population. World J Gastroenterol 2020; 26(21): 2839-2851
- URL: https://www.wjgnet.com/1007-9327/full/v26/i21/2839.htm
- DOI: https://dx.doi.org/10.3748/wjg.v26.i21.2839


