Copyright
©The Author(s) 2020.
World J Gastroenterol. Jun 7, 2020; 26(21): 2792-2809
Published online Jun 7, 2020. doi: 10.3748/wjg.v26.i21.2792
Published online Jun 7, 2020. doi: 10.3748/wjg.v26.i21.2792
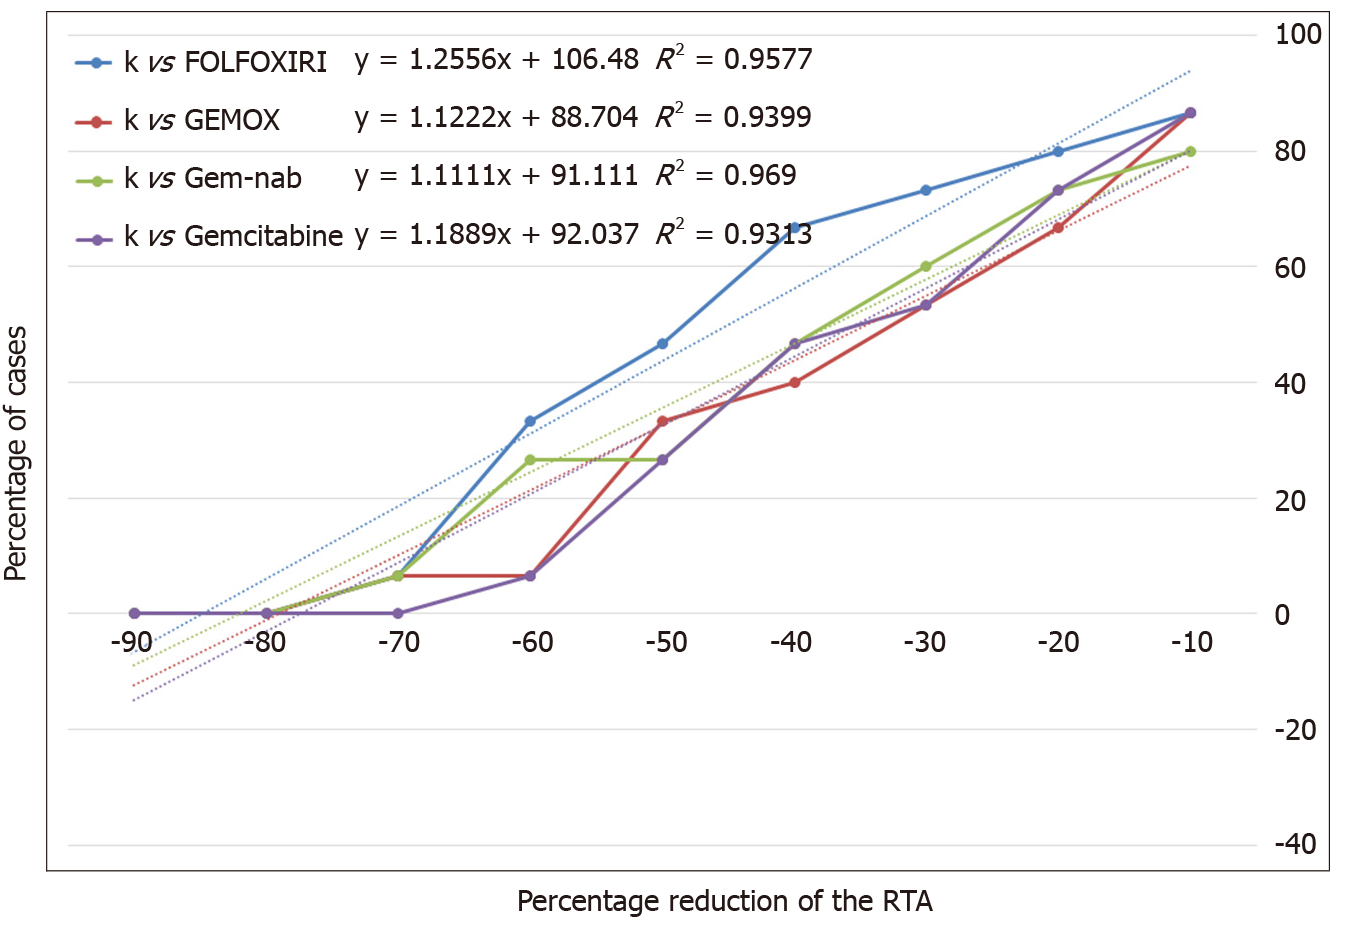
Figure 5 Percentage of cases with a percentage reduction of mean relative tumor area equal or greater to each threshold value.
RTA: relative tumor area; Control group shows normal nuclei (black arrows). k: Control group; GEM: Gemcitabine; GEMOX: Gemcitabine + Oxaliplatin; GEM/nab-P: Gemcitabine + nab-Paclitaxel; FOLFOXIRI: 5-Fluorouracil + Folinic acid + Oxaliplatin + Irinotecan.
- Citation: Di Franco G, Usai A, Funel N, Palmeri M, Montesanti IER, Bianchini M, Gianardi D, Furbetta N, Guadagni S, Vasile E, Falcone A, Pollina LE, Raffa V, Morelli L. Use of zebrafish embryos as avatar of patients with pancreatic cancer: A new xenotransplantation model towards personalized medicine. World J Gastroenterol 2020; 26(21): 2792-2809
- URL: https://www.wjgnet.com/1007-9327/full/v26/i21/2792.htm
- DOI: https://dx.doi.org/10.3748/wjg.v26.i21.2792


