Copyright
©The Author(s) 2019.
World J Gastroenterol. Mar 14, 2019; 25(10): 1197-1209
Published online Mar 14, 2019. doi: 10.3748/wjg.v25.i10.1197
Published online Mar 14, 2019. doi: 10.3748/wjg.v25.i10.1197
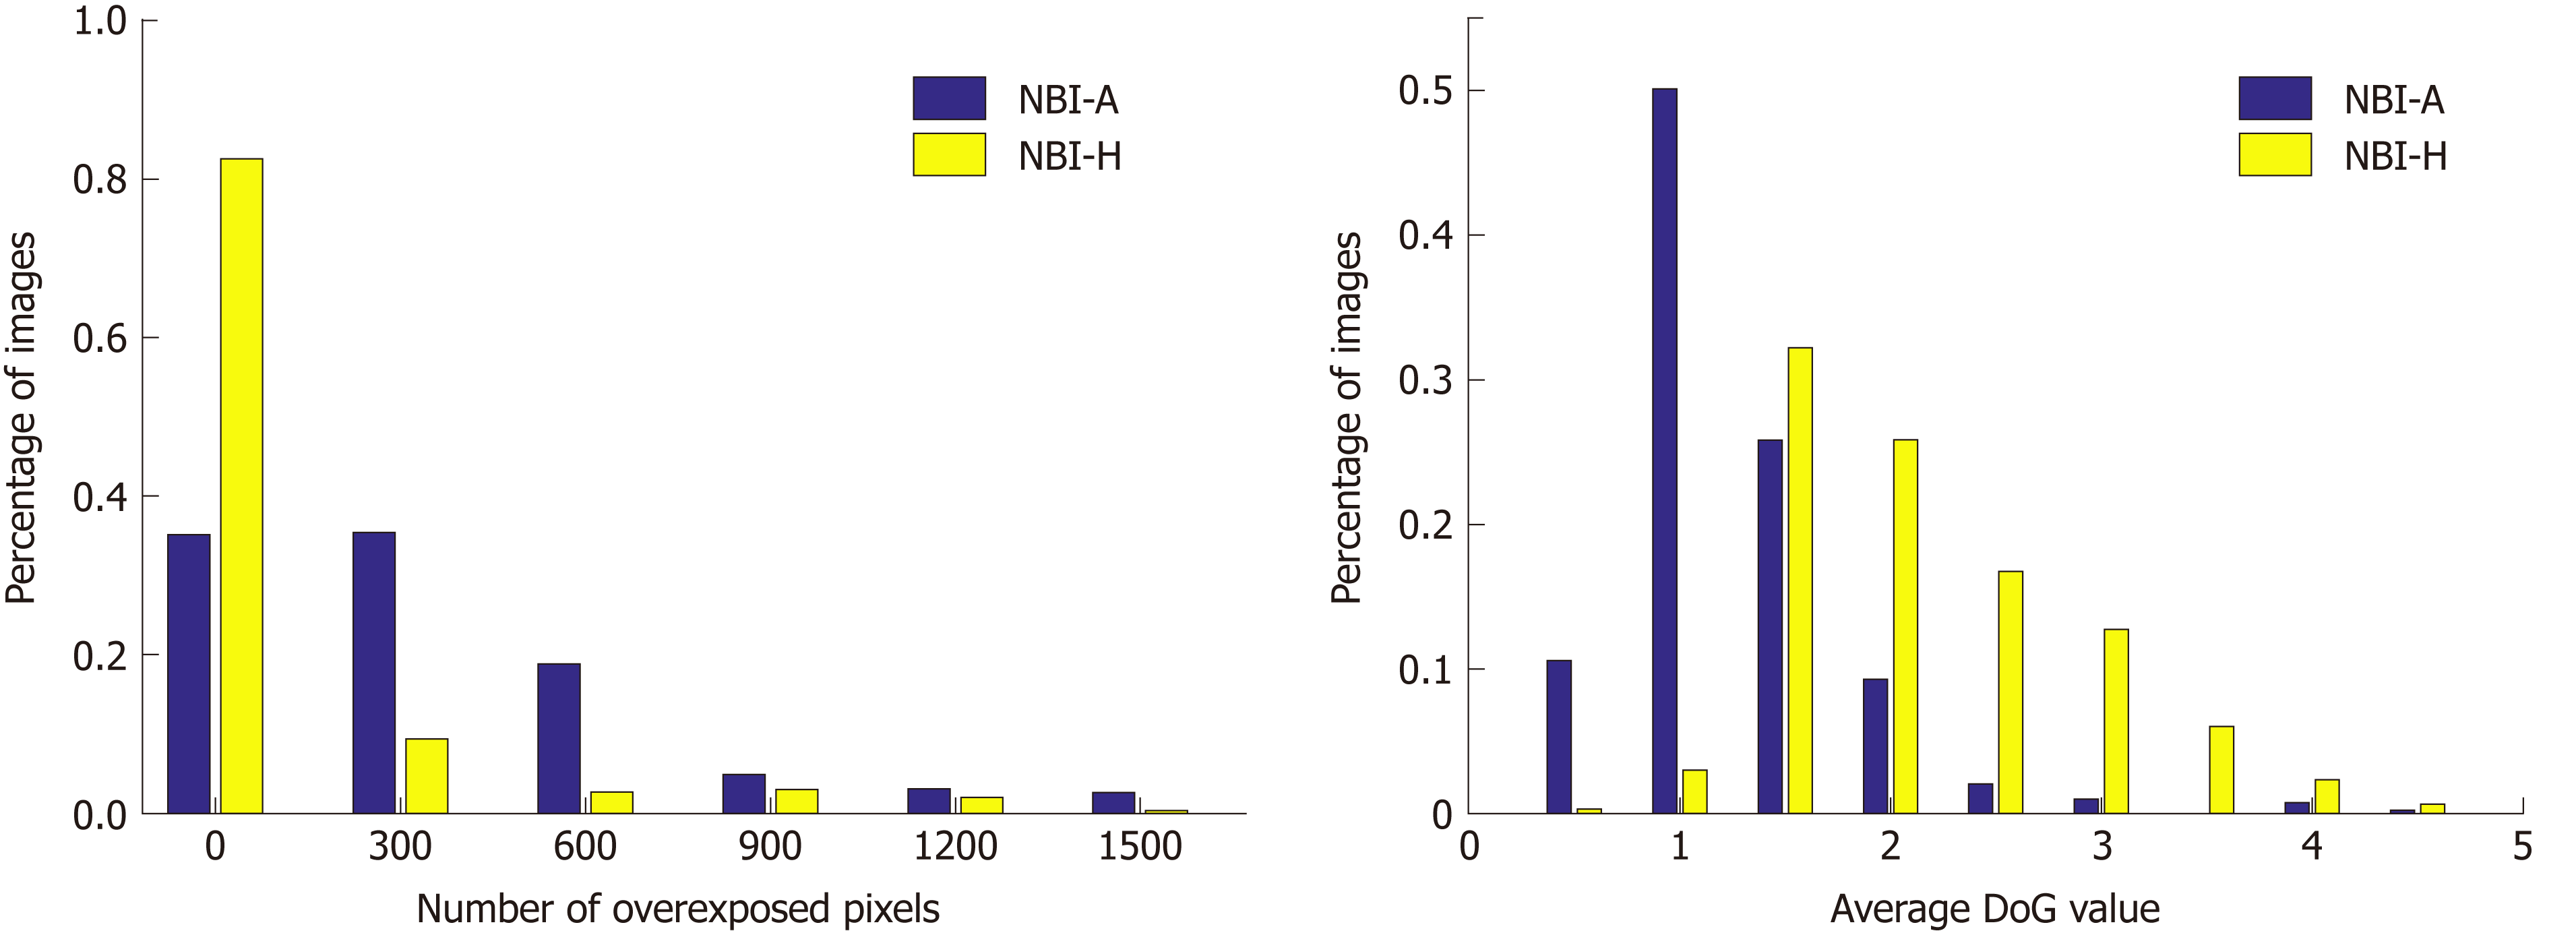
Figure 7 Histograms showing the number of overexposed pixels (A) respectively the average difference of Gaussians values (B) per image of the two narrow-band imaging databases.
NBI-A: High-magnification narrow-band imaging, Aachen; NBI-H: High-magnification narrow-band imaging, Hiroshima; DoG: Difference of Gaussians.
- Citation: Wimmer G, Gadermayr M, Wolkersdörfer G, Kwitt R, Tamaki T, Tischendorf J, Häfner M, Yoshida S, Tanaka S, Merhof D, Uhl A. Quest for the best endoscopic imaging modality for computer-assisted colonic polyp staging. World J Gastroenterol 2019; 25(10): 1197-1209
- URL: https://www.wjgnet.com/1007-9327/full/v25/i10/1197.htm
- DOI: https://dx.doi.org/10.3748/wjg.v25.i10.1197


