Copyright
©The Author(s) 2016.
World J Gastroenterol. May 28, 2016; 22(20): 4926-4935
Published online May 28, 2016. doi: 10.3748/wjg.v22.i20.4926
Published online May 28, 2016. doi: 10.3748/wjg.v22.i20.4926
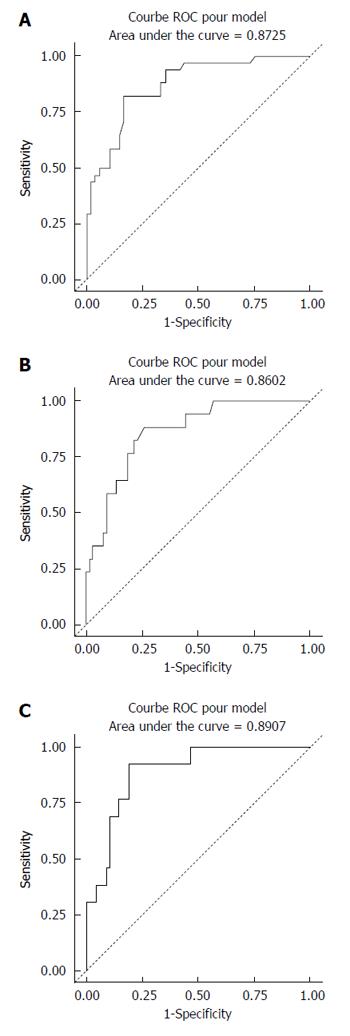
Figure 4 Receiver operating characteristic curves of acoustic radiation force impulse predicting liver fibrosis in patients with alcoholic liver disease.
A: ROC curve for F ≥ 2; B: ROC curve for F ≥ 3; C: ROC curve for F = 4.
- Citation: Kiani A, Brun V, Lainé F, Turlin B, Morcet J, Michalak S, Le Gruyer A, Legros L, Bardou-Jacquet E, Gandon Y, Moirand R. Acoustic radiation force impulse imaging for assessing liver fibrosis in alcoholic liver disease. World J Gastroenterol 2016; 22(20): 4926-4935
- URL: https://www.wjgnet.com/1007-9327/full/v22/i20/4926.htm
- DOI: https://dx.doi.org/10.3748/wjg.v22.i20.4926


