Copyright
©The Author(s) 2015.
World J Gastroenterol. Mar 14, 2015; 21(10): 2959-2966
Published online Mar 14, 2015. doi: 10.3748/wjg.v21.i10.2959
Published online Mar 14, 2015. doi: 10.3748/wjg.v21.i10.2959
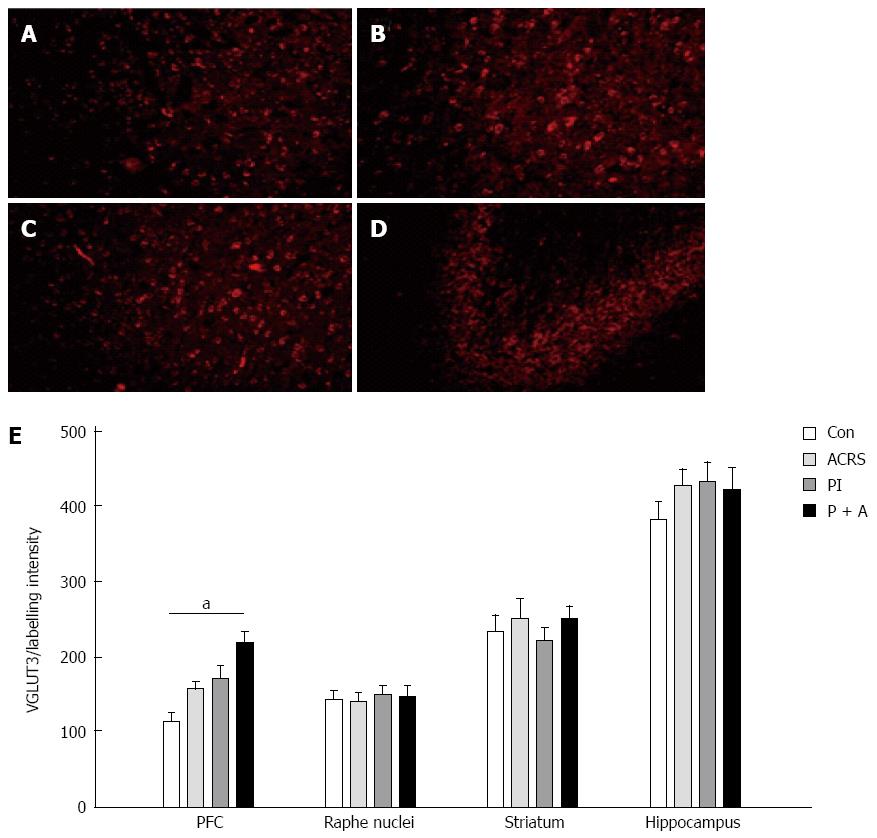
Figure 6 Representative immunofluorescence images of vesicular glutamate transporter-3-ir positive neurons in different brain regions.
A: Prefrontal cortex; B: Raphé nuclei; C: Striatum; D: Hippocampus; E: Quantification of vesicular glutamate transporter-3 (VGLUT3)-3-ir labeling intensity in the different regions of the brain. aP < 0.05. Original magnification, A-D: × 200.
- Citation: Yang CQ, Duan LP, Qiao PT, Zhao L, Guo LL. Increased VGLUT3 involved in visceral hyperalgesia in a rat model of irritable bowel syndrome. World J Gastroenterol 2015; 21(10): 2959-2966
- URL: https://www.wjgnet.com/1007-9327/full/v21/i10/2959.htm
- DOI: https://dx.doi.org/10.3748/wjg.v21.i10.2959


