Copyright
©2013 Baishideng Publishing Group Co.
World J Gastroenterol. Jun 21, 2013; 19(23): 3573-3582
Published online Jun 21, 2013. doi: 10.3748/wjg.v19.i23.3573
Published online Jun 21, 2013. doi: 10.3748/wjg.v19.i23.3573
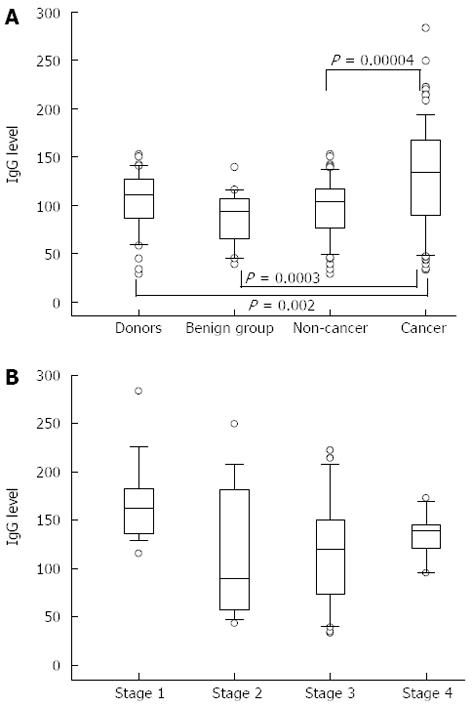
Figure 1 Thomsen-Friedenreich glycotope-IgG level in patients with stomach cancer and controls.
A: Box plots of anti-TF IgG levels (medians, ranges and quartiles) in controls and cancer patients; B: Anti-TF IgG levels in cancer patients by stage. Significantly higher in stage 1 compared with stages 2, 3 and 4 (P = 0.02, 0.001 and 0.01, respectively). P values were calculated by the Mann-Whitney U test.
- Citation: Kodar K, Izotova J, Klaamas K, Sergeyev B, Järvekülg L, Kurtenkov O. Aberrant glycosylation of the anti-Thomsen-Friedenreich glycotope immunoglobulin G in gastric cancer patients. World J Gastroenterol 2013; 19(23): 3573-3582
- URL: https://www.wjgnet.com/1007-9327/full/v19/i23/3573.htm
- DOI: https://dx.doi.org/10.3748/wjg.v19.i23.3573


