Copyright
©2012 Baishideng Publishing Group Co.
World J Gastroenterol. Oct 7, 2012; 18(37): 5197-5204
Published online Oct 7, 2012. doi: 10.3748/wjg.v18.i37.5197
Published online Oct 7, 2012. doi: 10.3748/wjg.v18.i37.5197
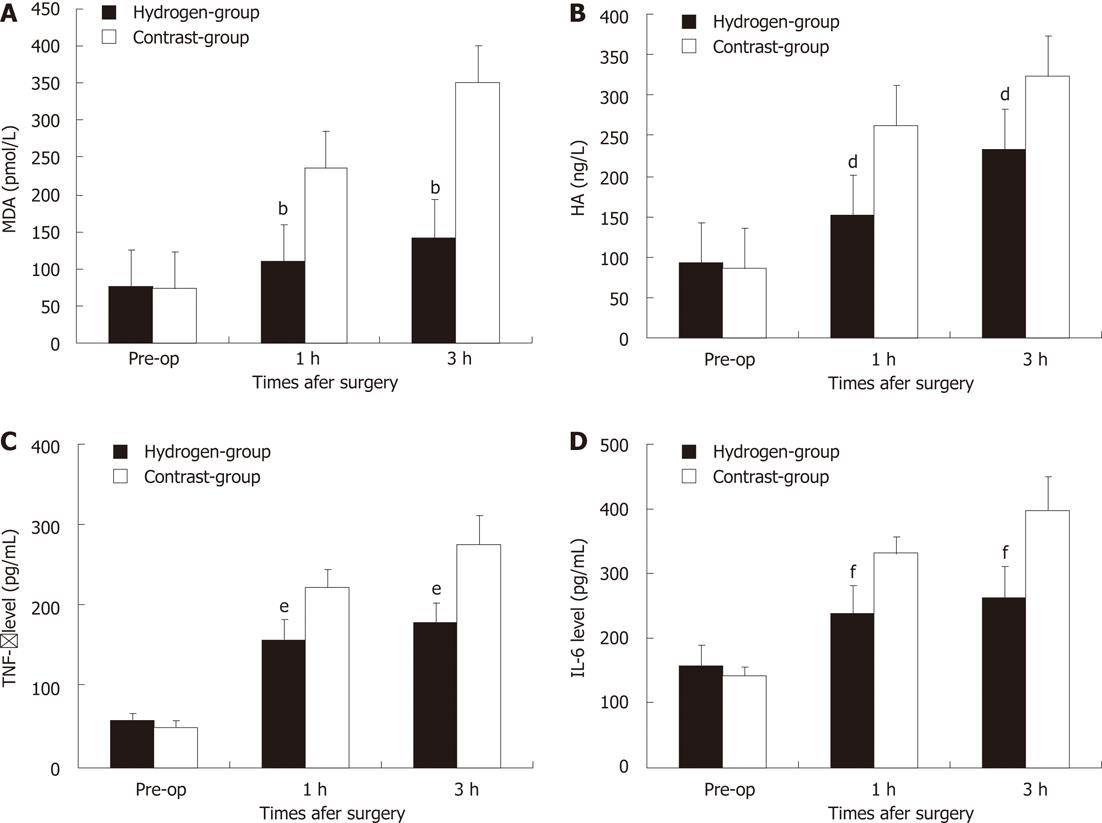
Figure 3 Changes of hepatic malondialdehyde, hyaluronic acid, tumer necrosis factor-α and interleukin-6 levels in two groups.
A bar graph shows the mean ± SD of hepatic malondialdehyde (MDA) (A), hyaluronic acid (HA) (B), tumer necrosis factor (TNF)-α (C) and interleukin (IL)-6 (D) level in two groups. Each group is represented by the mean of 7 swines. A, B: In hydrogen gas treated-group, the MDA (A) and HA (B) levels were significantly lower to Contrast-group; C, D: In hydrogen gas treated-group, the TNF-α (C) and IL-6 (D) levels were significantly lower to Contrast-group. Pre-op: Pre-operation. bP < 0.01 vs MDA level in Contrast-group; dP < 0.01 vs HA level in Contrast-group; eP < 0.01 vs TNF-α level in Contrast-group; fP < 0.01 vs IL-6 level in Contrast-group.
- Citation: Xiang L, Tan JW, Huang LJ, Jia L, Liu YQ, Zhao YQ, Wang K, Dong JH. Inhalation of hydrogen gas reduces liver injury during major hepatotectomy in swine. World J Gastroenterol 2012; 18(37): 5197-5204
- URL: https://www.wjgnet.com/1007-9327/full/v18/i37/5197.htm
- DOI: https://dx.doi.org/10.3748/wjg.v18.i37.5197


