Copyright
©2012 Baishideng Publishing Group Co.
World J Gastroenterol. Aug 21, 2012; 18(31): 4102-4117
Published online Aug 21, 2012. doi: 10.3748/wjg.v18.i31.4102
Published online Aug 21, 2012. doi: 10.3748/wjg.v18.i31.4102
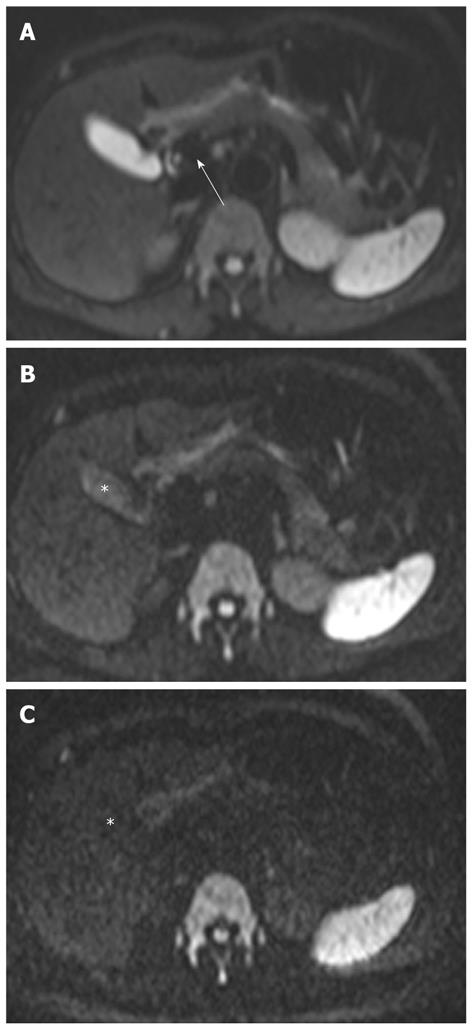
Figure 3 DWI of the normal liver, pancreas, and biliary tract.
A: DWI at b = 50 s/mm2 shows that the liver is hypointense compared to the kidney and spleen, and isointense compared to the pancreas; there is a signal void within the portal vein (arrow). DWI using low b values results in decreasing signals of fast motion of water molecules, such as that occurring within vessels. Such images are referred to as black-blood images; B: DWI at b = 500 s/mm2 shows that the signal intensity of bile is decreased (asterisk) and the wall of the gallbladder is not identified. The liver is isointense compared to the pancreas; C: DWI at b = 1000 s/mm2 shows a significant reduction in the signal intensity of bile in the gallbladder (asterisk). DWI: Diffusion-weighted magnetic resonance imaging.
- Citation: Lee NK, Kim S, Kim GH, Kim DU, Seo HI, Kim TU, Kang DH, Jang HJ. Diffusion-weighted imaging of biliopancreatic disorders: Correlation with conventional magnetic resonance imaging. World J Gastroenterol 2012; 18(31): 4102-4117
- URL: https://www.wjgnet.com/1007-9327/full/v18/i31/4102.htm
- DOI: https://dx.doi.org/10.3748/wjg.v18.i31.4102


