Copyright
©2011 Baishideng Publishing Group Co.
World J Gastroenterol. Sep 21, 2011; 17(35): 3976-3985
Published online Sep 21, 2011. doi: 10.3748/wjg.v17.i35.3976
Published online Sep 21, 2011. doi: 10.3748/wjg.v17.i35.3976
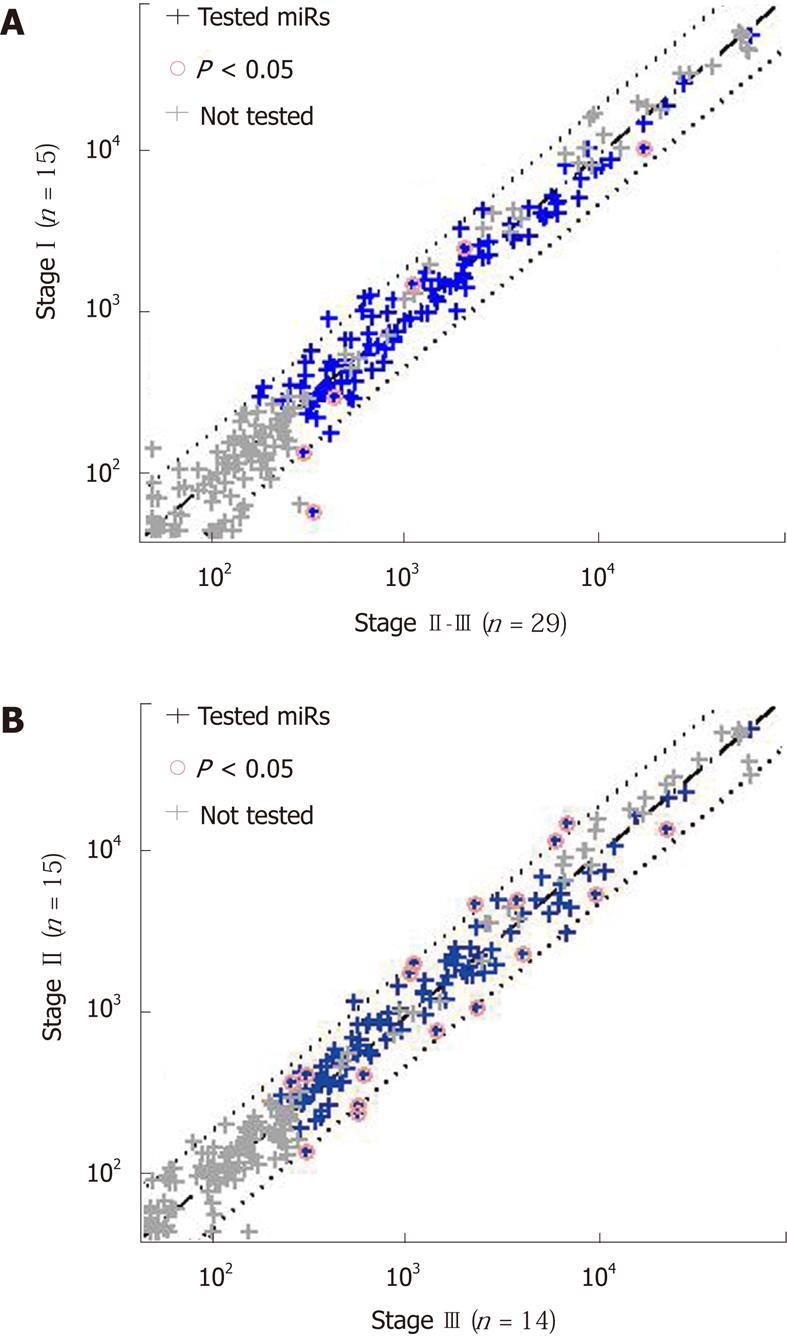
Figure 3 Differential expression of miRs in gastric cancer tumors by clinical disease stage (at surgery).
Median expression data (in normalized fluorescence units) are shown for all microarray probes (crosses). MiRs with low expression (below 300 units) in both groups and control probes were not tested for expression differences (grey crosses). A: 112 miRs (blue crosses) were tested by rank-sum test for expression between stage I tumors and stages II-III tumors. None of the miRs passed the false discovery rate (FDR) threshold of 0.2; 6 miRs had a P < 0.05 (pink circles). B: 111 miRs (blue crosses) were tested for expression between stage II tumors and stage III tumors. None of the miRs passed the FDR threshold of 0.2; 17 miRs had a P < 0.05 (pink circles). Diagonal lines show the equal median expression (dashed line) and the twofold change in median expression (dotted lines). miR: MicroRNA.
- Citation: Brenner B, Hoshen MB, Purim O, David MB, Ashkenazi K, Marshak G, Kundel Y, Brenner R, Morgenstern S, Halpern M, Rosenfeld N, Chajut A, Niv Y, Kushnir M. MicroRNAs as a potential prognostic factor in gastric cancer. World J Gastroenterol 2011; 17(35): 3976-3985
- URL: https://www.wjgnet.com/1007-9327/full/v17/i35/3976.htm
- DOI: https://dx.doi.org/10.3748/wjg.v17.i35.3976


