Copyright
©2011 Baishideng Publishing Group Co.
World J Gastroenterol. Apr 21, 2011; 17(15): 1947-1960
Published online Apr 21, 2011. doi: 10.3748/wjg.v17.i15.1947
Published online Apr 21, 2011. doi: 10.3748/wjg.v17.i15.1947
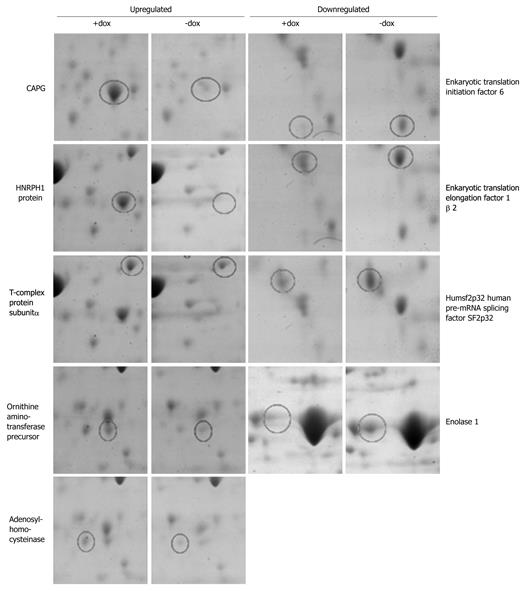
Figure 6 Two-dimensional gel analysis shows up- or downregulation of proteins associated with CapG overexpression.
Coomassie Blue stained gel insets displaying proteins found to be up- or downregulated in Sβtet29Cap35 (C35), Sβtet29Cap43 (C43) but not in control Sβtet29 (TET29) cells, following treatment for 18 h with 500 ng/mL doxycycline (+dox). Spots were excised from the gels, trypsin digested, and analysed by Maldi-Tof, leading to the identification of proteins.
- Citation: Tonack S, Patel S, Jalali M, Nedjadi T, Jenkins RE, Goldring C, Neoptolemos J, Costello E. Tetracycline-inducible protein expression in pancreatic cancer cells: Effects of CapG overexpression. World J Gastroenterol 2011; 17(15): 1947-1960
- URL: https://www.wjgnet.com/1007-9327/full/v17/i15/1947.htm
- DOI: https://dx.doi.org/10.3748/wjg.v17.i15.1947


