Copyright
©2010 Baishideng Publishing Group Co.
World J Gastroenterol. Nov 7, 2010; 16(41): 5211-5224
Published online Nov 7, 2010. doi: 10.3748/wjg.v16.i41.5211
Published online Nov 7, 2010. doi: 10.3748/wjg.v16.i41.5211
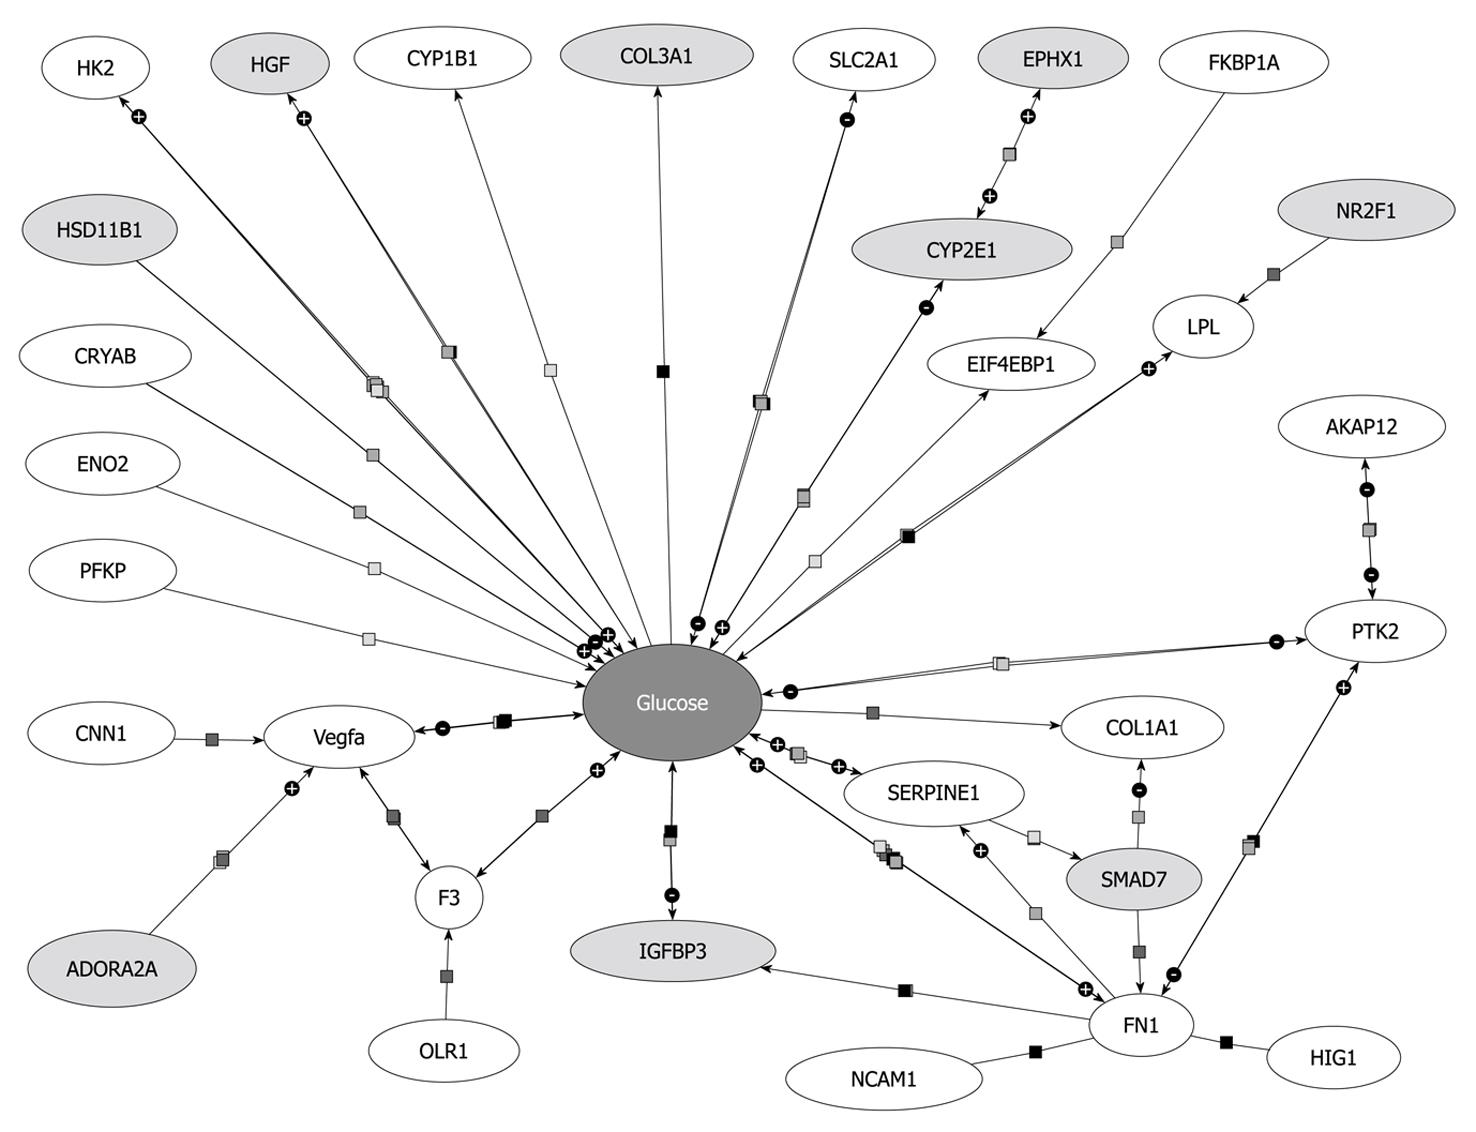
Figure 6 Biological interaction between glucose and genes up- (light grey) or down-regulated (white) in primary hepatic stellate cells after overexpression of Smad7.
Genes linked to glucose by binding or regulatory interactions are depicted as interconnecting lines between glucose and the gene symbols. Pathway analysis was done with Pathway Architect software (Stratagene).
- Citation: Denecke B, Wickert L, Liu Y, Ciuclan L, Dooley S, Meindl-Beinker NM. Smad7 dependent expression signature highlights BMP2 and HK2 signaling in HSC transdifferentiation. World J Gastroenterol 2010; 16(41): 5211-5224
- URL: https://www.wjgnet.com/1007-9327/full/v16/i41/5211.htm
- DOI: https://dx.doi.org/10.3748/wjg.v16.i41.5211


