Copyright
©2010 Baishideng Publishing Group Co.
World J Gastroenterol. Nov 7, 2010; 16(41): 5211-5224
Published online Nov 7, 2010. doi: 10.3748/wjg.v16.i41.5211
Published online Nov 7, 2010. doi: 10.3748/wjg.v16.i41.5211
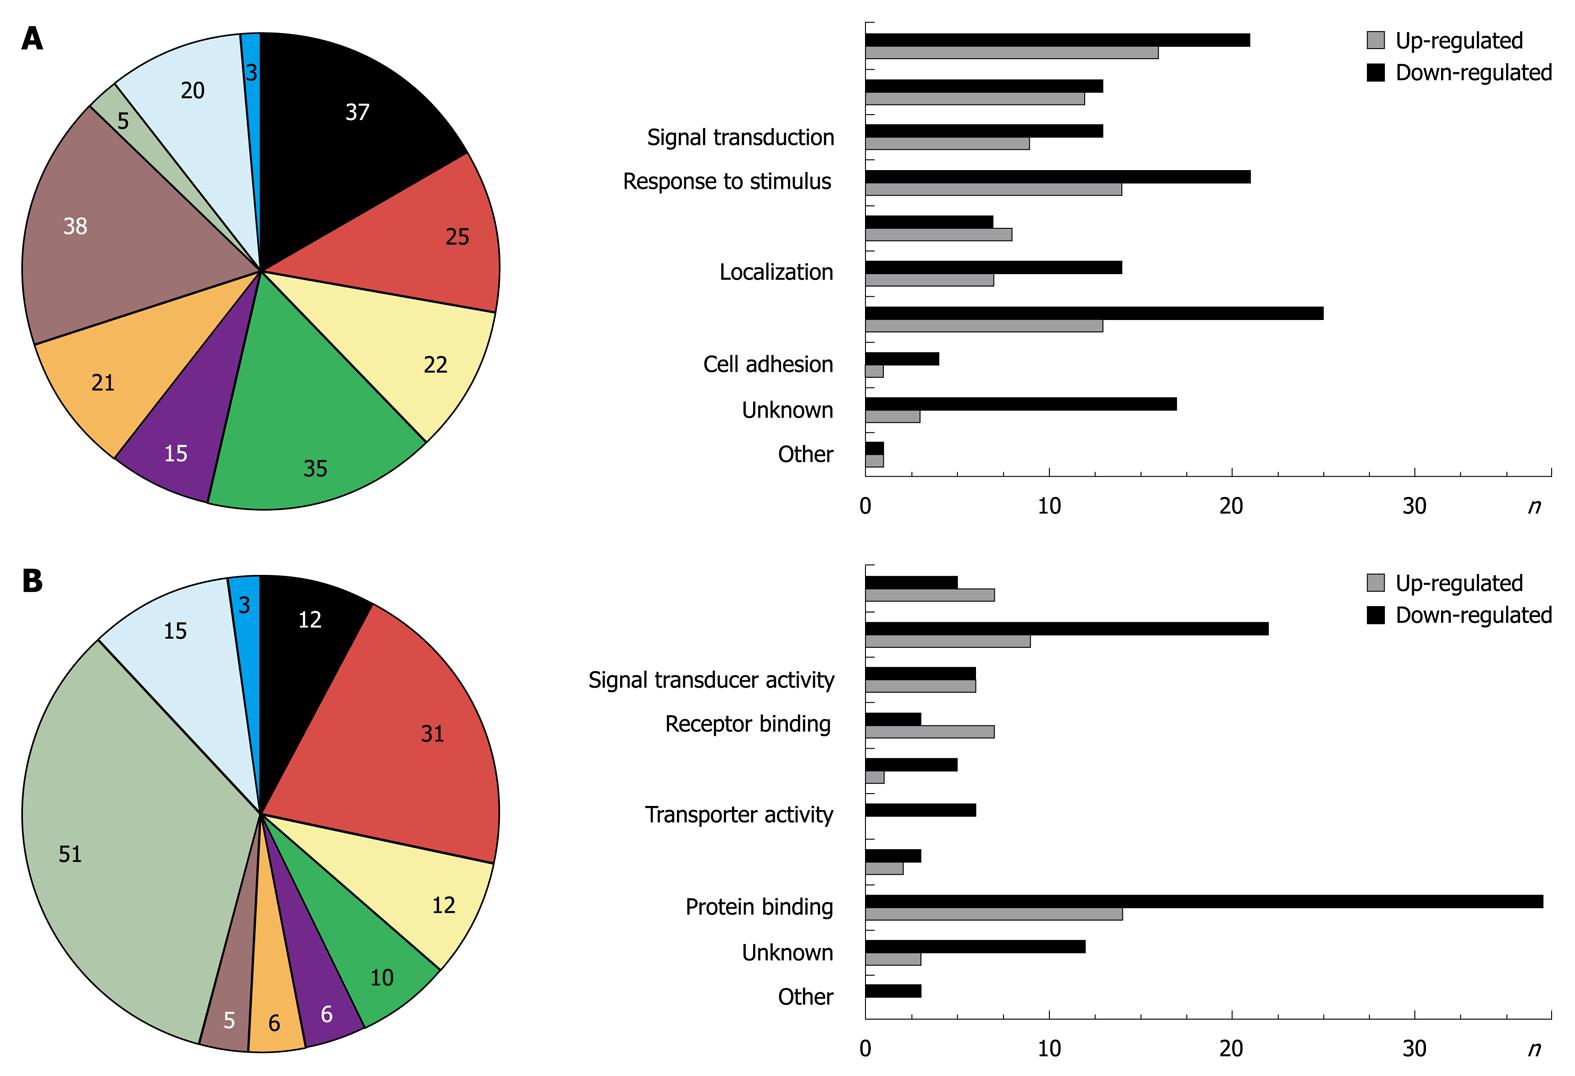
Figure 1 Genes whose expression levels were changed (n = 100) after overexpression of Smad7 in hepatic stellate cells are matched to 8 gene ontology annotations using GoMiner[13].
Left part: Percentage of genes matching to the given gene ontology. Note the total percentage is greater than 100% as the same regulated genes can be assigned to different annotations; Right part: Bar diagram shows number of upregulated (grey bars) and downregulated (black bars) genes matching to the given gene ontology (unknown = percentage/number of genes without annotation, other = percentage/number of genes which are not assignable to the given annotations). A: GO group: biological process; B: GO group: molecular function.
- Citation: Denecke B, Wickert L, Liu Y, Ciuclan L, Dooley S, Meindl-Beinker NM. Smad7 dependent expression signature highlights BMP2 and HK2 signaling in HSC transdifferentiation. World J Gastroenterol 2010; 16(41): 5211-5224
- URL: https://www.wjgnet.com/1007-9327/full/v16/i41/5211.htm
- DOI: https://dx.doi.org/10.3748/wjg.v16.i41.5211


