Copyright
©2010 Baishideng.
World J Gastroenterol. Aug 14, 2010; 16(30): 3816-3826
Published online Aug 14, 2010. doi: 10.3748/wjg.v16.i30.3816
Published online Aug 14, 2010. doi: 10.3748/wjg.v16.i30.3816
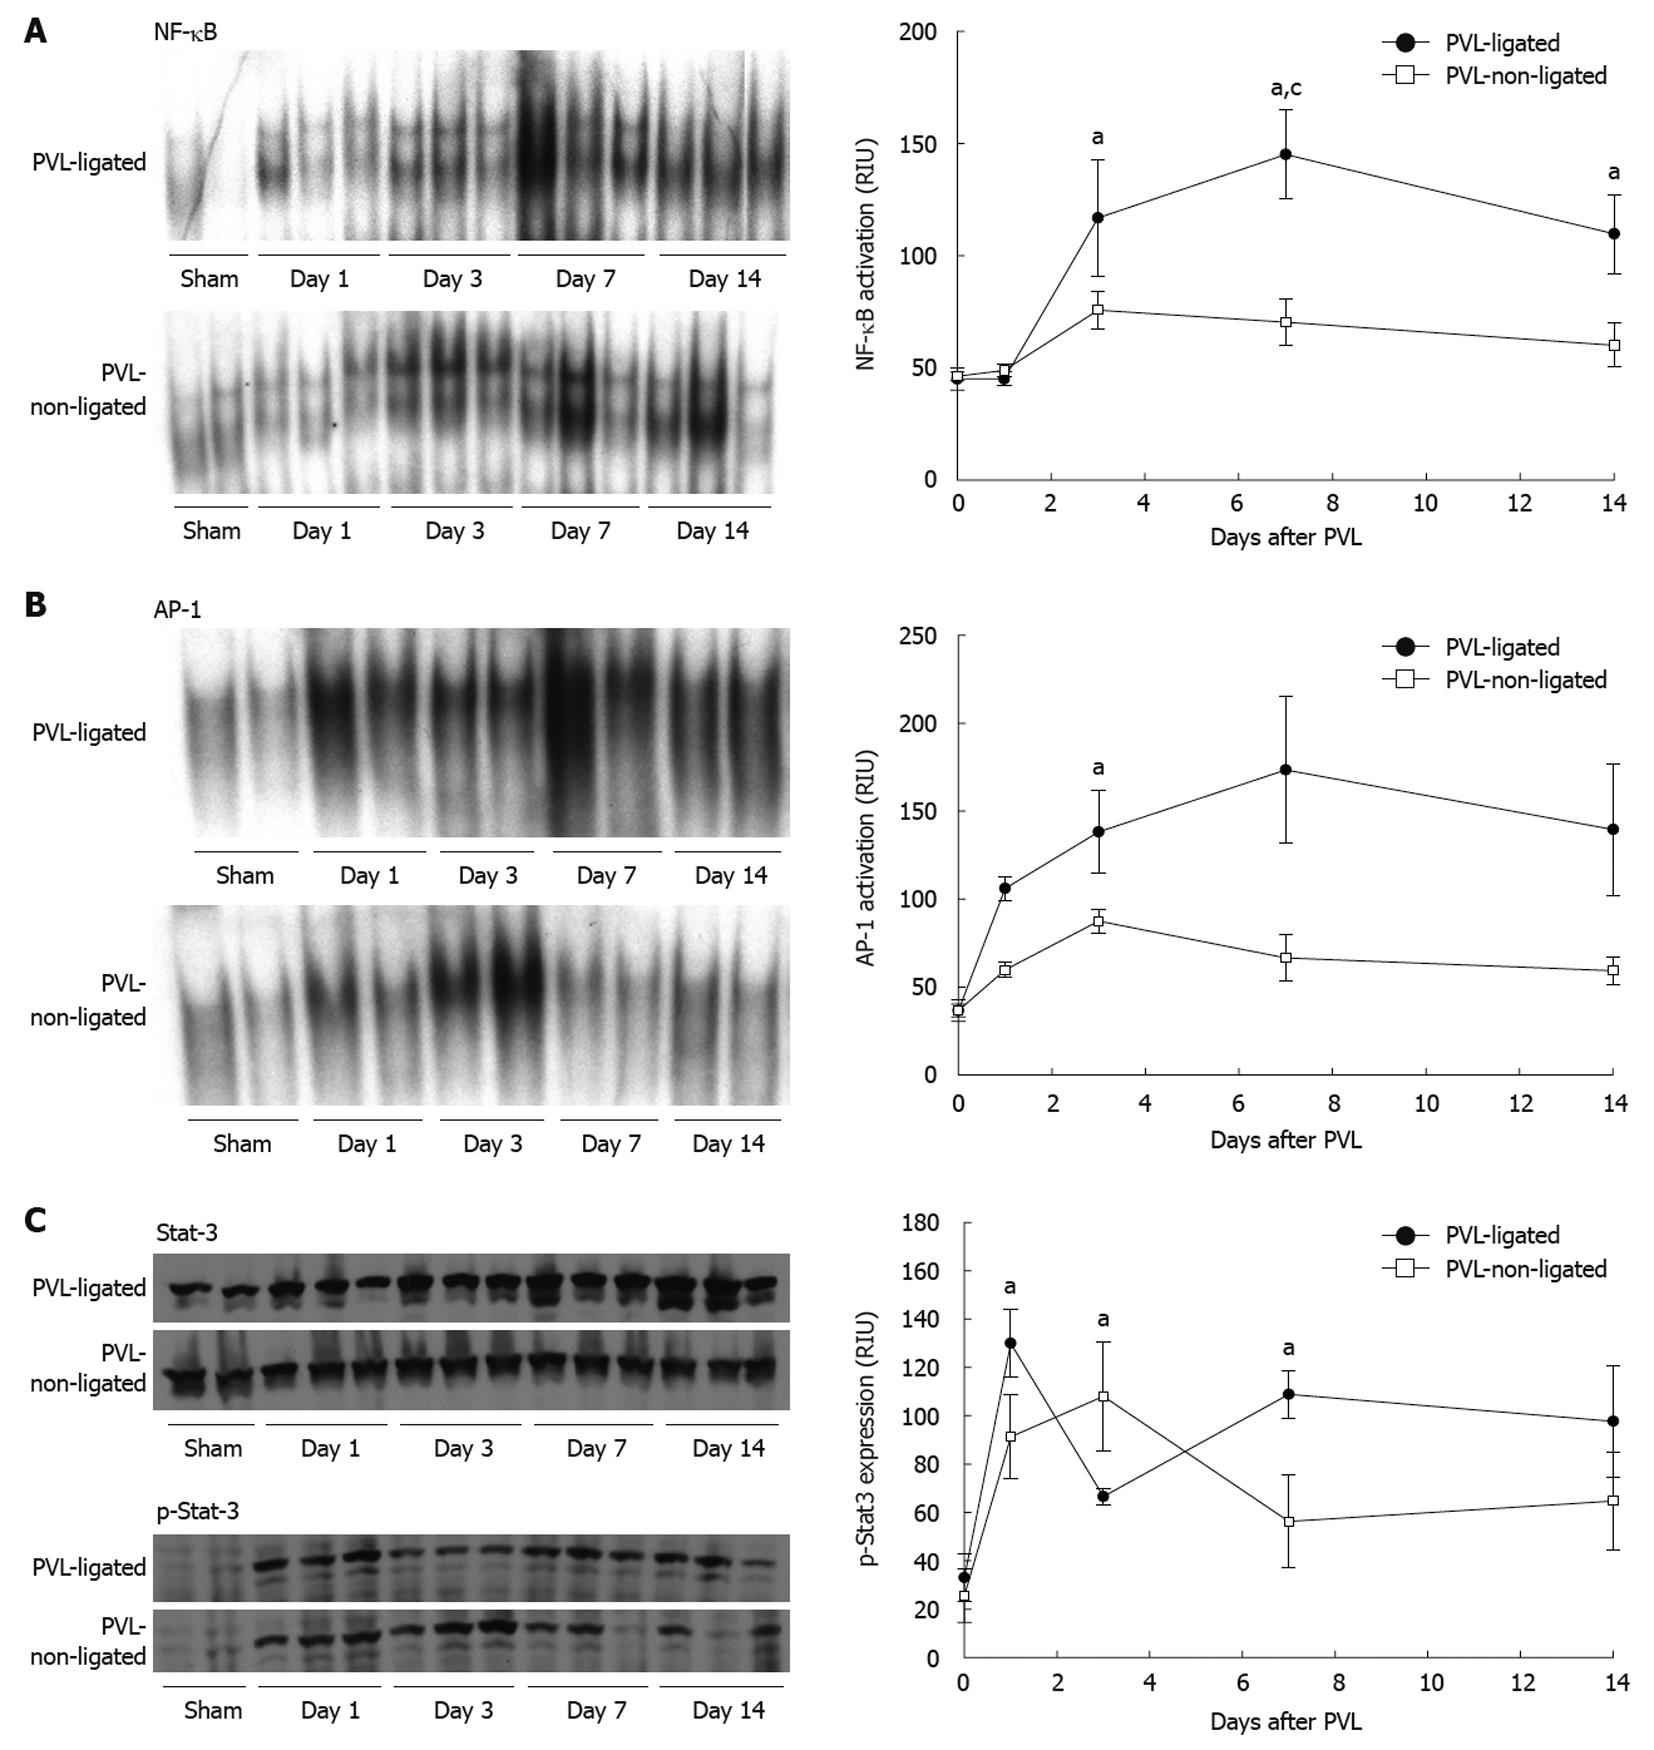
Figure 5 Transcription factor activation after portal vein ligation.
Nuclear factor (NF)-κB (A), activator protein (AP)-1 (B) and signal transducer and activator of transcription 3 (STAT3) (C) were examined in liver extracts. For NF-κB and AP-1, liver nuclear extracts were analyzed by electrophoretic mobility shift assay. For STAT3, liver lysates were assessed by Western blotting. Results were quantitated by image analysis of autoradiograms and chemiluminescence films. Data are mean ± SE with n = 4 per group. A: aP < 0.05 vs sham-operated group; cP < 0.05 vs portal vein ligation (PVL)-non-ligated group; B: aP < 0.05 vs PVL-non-ligated group; C: aP < 0.05 vs sham-operated group.
- Citation: Sakai N, Clarke CN, Schuster R, Blanchard J, Tevar AD, Edwards MJ, Lentsch AB. Portal vein ligation accelerates tumor growth in ligated, but not contralateral lobes. World J Gastroenterol 2010; 16(30): 3816-3826
- URL: https://www.wjgnet.com/1007-9327/full/v16/i30/3816.htm
- DOI: https://dx.doi.org/10.3748/wjg.v16.i30.3816


