Copyright
©2009 The WJG Press and Baishideng.
World J Gastroenterol. Mar 28, 2009; 15(12): 1443-1451
Published online Mar 28, 2009. doi: 10.3748/wjg.15.1443
Published online Mar 28, 2009. doi: 10.3748/wjg.15.1443
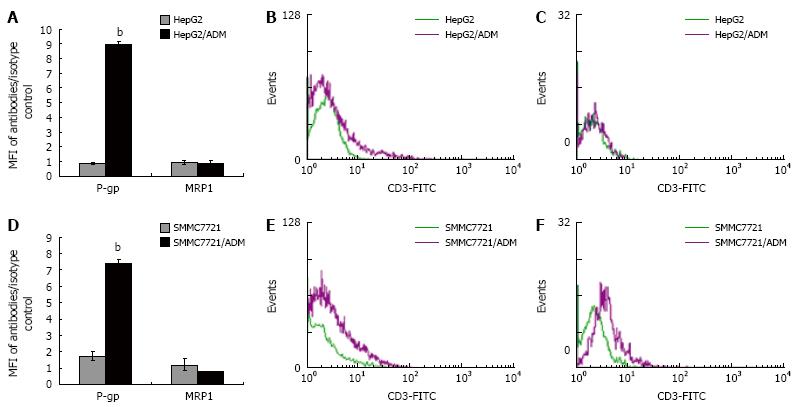
Figure 3 Expression of P-gp and MRP1 in MDR and parental cells.
Histograms showing that P-gp expression was over 10-fold higher in HepG2/ADM cells than in HepG2 cells, and over 4-fold higher in SMMC7721/ADM cells than in SMMC7721 cells, but MRP1 expression had no significant difference (A, D). Corresponding flow histograms for P-gp (B, E) and MRP1 (C, F) are presented. The results are shown as mean ± SE (n = 5). Statistical analyses comparing MDR cells with parental cells were performed using Student's t-test. bP < 0.001 vs SMMC7721 cells.
- Citation: Yan F, Wang XM, Pan C, Ma QM. Down-regulation of extracellular signal-regulated kinase 1/2 activity in P-glycoprotein-mediated multidrug resistant hepatocellular carcinoma cells. World J Gastroenterol 2009; 15(12): 1443-1451
- URL: https://www.wjgnet.com/1007-9327/full/v15/i12/1443.htm
- DOI: https://dx.doi.org/10.3748/wjg.15.1443


