Copyright
©2008 The WJG Press and Baishideng.
World J Gastroenterol. May 7, 2008; 14(17): 2740-2747
Published online May 7, 2008. doi: 10.3748/wjg.14.2740
Published online May 7, 2008. doi: 10.3748/wjg.14.2740
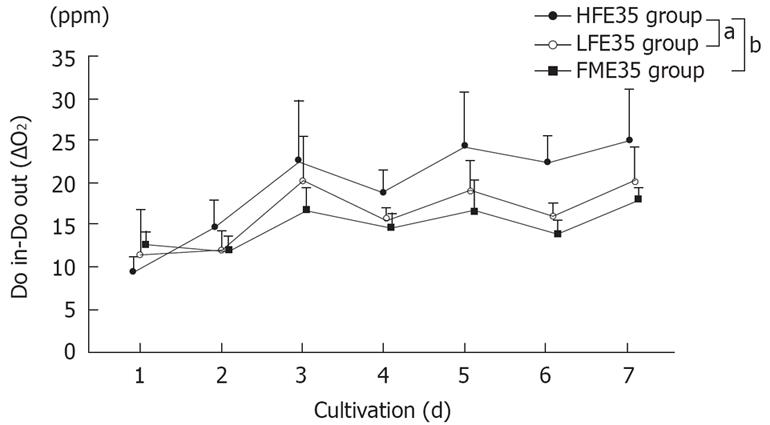
Figure 3 Changes of the oxygen consumption in the HFE35, LFE35, and FME35 groups.
HFE35 group vs FME35 group (P < 0.01), HFE35 group vs LFE35 group (P < 0.05), LFE35 group vs FME35 group (no significant). The data show the mean values, while error bars represent corresponding standard deviations. aP < 0.05, bP < 0.01.
- Citation: Ishii Y, Saito R, Marushima H, Ito R, Sakamoto T, Yanaga K. Hepatic reconstruction from fetal porcine liver cells using a radial flow bioreactor. World J Gastroenterol 2008; 14(17): 2740-2747
- URL: https://www.wjgnet.com/1007-9327/full/v14/i17/2740.htm
- DOI: https://dx.doi.org/10.3748/wjg.14.2740


