Copyright
©2007 Baishideng Publishing Group Co.
World J Gastroenterol. Jan 21, 2007; 13(3): 349-354
Published online Jan 21, 2007. doi: 10.3748/wjg.v13.i3.349
Published online Jan 21, 2007. doi: 10.3748/wjg.v13.i3.349
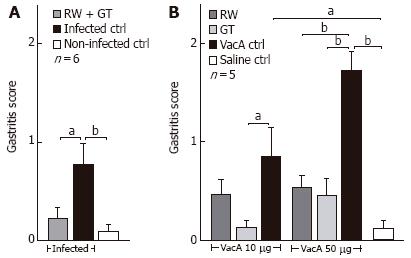
Figure 2 Gastritis score of H pylori-infected (A) or VacA-treated (B) mice in the presence or in the absence of RW and/or GT as indicated.
Mean of antrum, corpus and fundus scores of each group. Bars = SE. aP < 0.05, bP < 0.01 comparison between the indicated groups.
-
Citation: Ruggiero P, Rossi G, Tombola F, Pancotto L, Lauretti L, Del Giudice G, Zoratti M. Red wine and green tea reduce
H pylori- or VacA-induced gastritis in a mouse model. World J Gastroenterol 2007; 13(3): 349-354 - URL: https://www.wjgnet.com/1007-9327/full/v13/i3/349.htm
- DOI: https://dx.doi.org/10.3748/wjg.v13.i3.349


