Copyright
©2006 Baishideng Publishing Group Co.
World J Gastroenterol. Apr 21, 2006; 12(15): 2388-2393
Published online Apr 21, 2006. doi: 10.3748/wjg.v12.i15.2388
Published online Apr 21, 2006. doi: 10.3748/wjg.v12.i15.2388
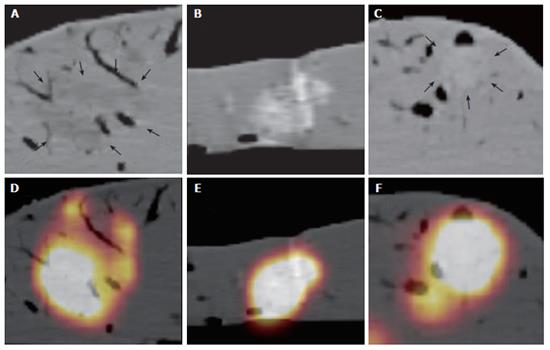
Figure 2 A: This shows a hypodense lesion.
The margins of the hypodense lesion are barely seen (fine black arrows). In comparison, the combined PET/CT image of the same lesion shows exactly the margins of the lesion (Figure 2D). Furthermore, the combined PET/CT suggests a different location and extent of the lesion, which was confirmed by the standard of reference. B: This shows a hyperdense lesion. The margins of the lesions are well seen. The combined PET/CT shows the same location and extent of the lesion within the liver tissue (Figure 2E). Thus, in hyperdense lesions, a high correlation of CT and combined PET/CT measurements was found. C: This shows a nearly isodense lesion. The margins of the lesions can only be anticipated (fine black arrows). The corresponding PET/CT (Figure 2 F) of the same lesion shows a different extent of the same lesion with well defined and sharp margins.
- Citation: Veit P, Kuehle C, Beyer T, Kuehl H, Bockisch A, Antoch G. Accuracy of combined PET/CT in image-guided interventions of liver lesions: An ex-vivo study. World J Gastroenterol 2006; 12(15): 2388-2393
- URL: https://www.wjgnet.com/1007-9327/full/v12/i15/2388.htm
- DOI: https://dx.doi.org/10.3748/wjg.v12.i15.2388


