Copyright
©The Author(s) 2004.
World J Gastroenterol. Aug 1, 2004; 10(15): 2284-2286
Published online Aug 1, 2004. doi: 10.3748/wjg.v10.i15.2284
Published online Aug 1, 2004. doi: 10.3748/wjg.v10.i15.2284
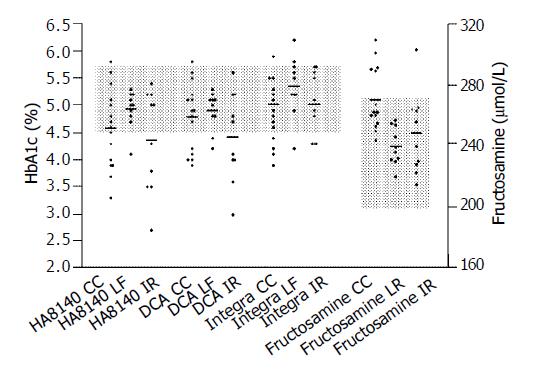
Figure 1 HbA1c level and fructosamine concentration in pa-tients with liver disease.
CC: Compensated cirrhosis; LF: Chronic hepatitis (liver fibrosis); IR: Chronic hepatitis with interferon and ribavirin treatment. Shaded areas represent the mean ± 2SD reference range for each test (HbA1c: 4.5-5.7%; fructosamine: 200-272 μmol/L)
- Citation: Lahousen T, Hegenbarth K, Ille R, Lipp RW, Krause R, Little RR, Schnedl WJ. Determination of glycated hemoglobin in patients with advanced liver disease. World J Gastroenterol 2004; 10(15): 2284-2286
- URL: https://www.wjgnet.com/1007-9327/full/v10/i15/2284.htm
- DOI: https://dx.doi.org/10.3748/wjg.v10.i15.2284


