Copyright
©The Author(s) 2003.
World J Gastroenterol. Sep 15, 2003; 9(9): 2117-2120
Published online Sep 15, 2003. doi: 10.3748/wjg.v9.i9.2117
Published online Sep 15, 2003. doi: 10.3748/wjg.v9.i9.2117
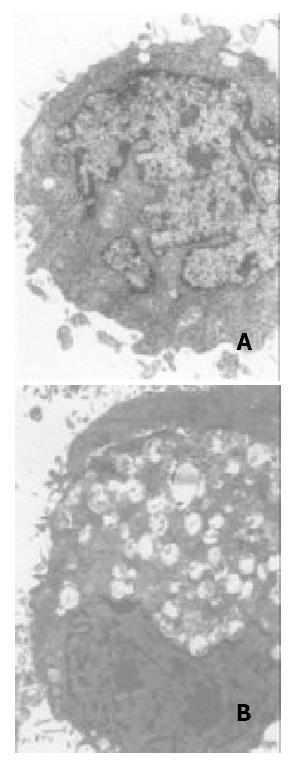
Figure 1 Morphology of SMMC-7721 observed under trans-mission electron microscope.
Untreated-cells have many microvilli, and their nuclei have a great of incisure (A). ATRA-treated cells have smaller volume, fewer microvilli on the surface, densed chromatin and increased heterochromatin. With the plasma increased, the nuclear/cytoplasmic ratio decreased. The mitochondria also increased. The Golgi com-plex became bigger. More vacuole and glycogen were seen. There were also many lipofuscin and tonofilaments (B).
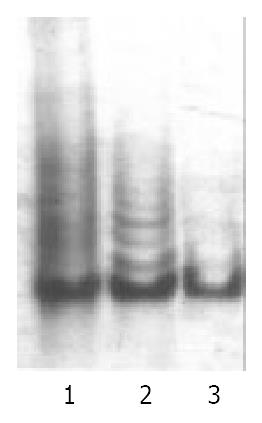
Figure 2 Telomerase activity of SMMC-7721.
The untreated cells showed 6 bp ladder pattern, suggesting the active telomerase. So it served as the positive control (Lane 2). The negative control did not show the DNA ladder because the sample was inactivated at 75 °C (Lane 3). The ATRA-treated cells showed no ladder as the negative control (Lane 1).
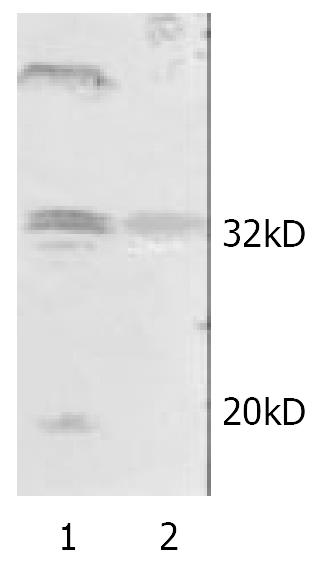
Figure 3 The expression of Caspase-3.
All the control groups showed weak signals at the position of 32kD, suggesting the presence of Caspase-3 (Lane 2). For the ATRA-treated cells, the 32kD signal was shown to be stronger. In addition, an-other signal at the position of 20kD was detected. The latter represented the p20 subunit of Caspase-3, an active form of the molecule (Lane 1).
- Citation: Piao YF, Shi Y, Gao PJ. Inhibitory effect of all-trans retinoic acid on human hepatocellular carcinoma cell proliferation. World J Gastroenterol 2003; 9(9): 2117-2120
- URL: https://www.wjgnet.com/1007-9327/full/v9/i9/2117.htm
- DOI: https://dx.doi.org/10.3748/wjg.v9.i9.2117


