Copyright
©The Author(s) 2003.
World J Gastroenterol. Sep 15, 2003; 9(9): 1915-1919
Published online Sep 15, 2003. doi: 10.3748/wjg.v9.i9.1915
Published online Sep 15, 2003. doi: 10.3748/wjg.v9.i9.1915
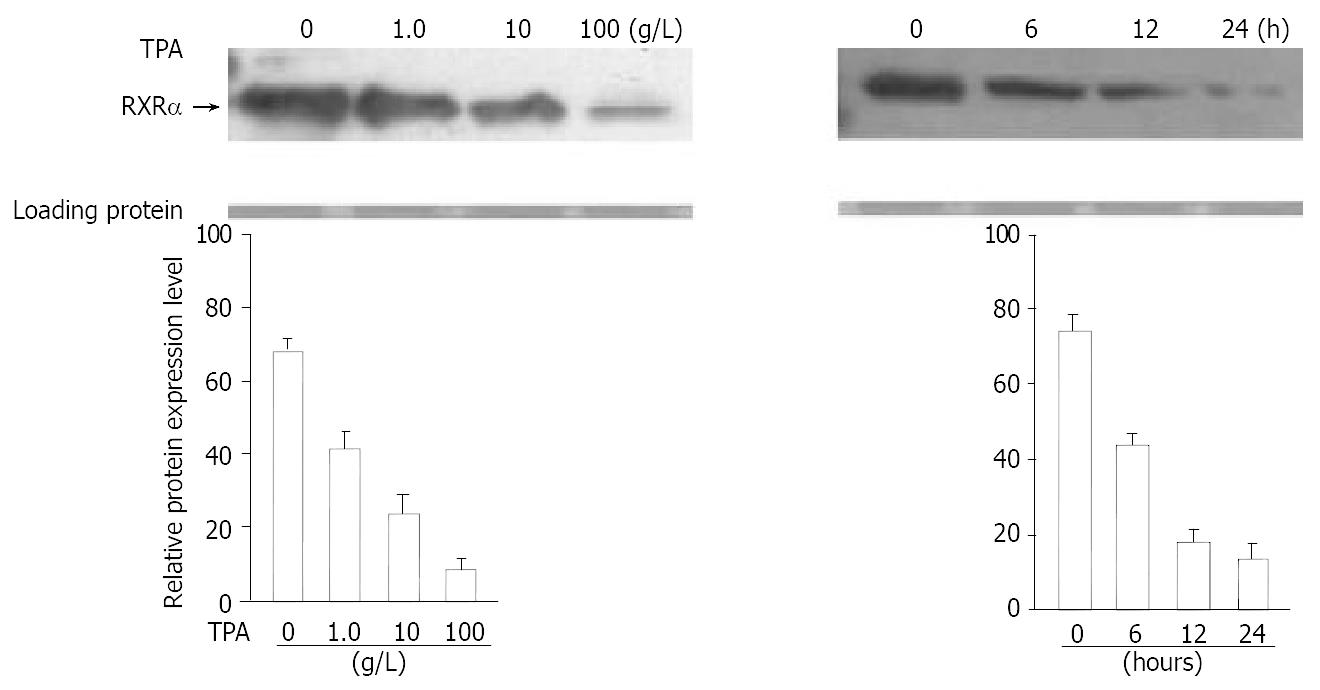
Figure 1 Effect of TPA on expression of RXRα protein.
Cells were treated at different concentrations of TPA or different time periods. (A) Expression of RXRα was detected by Western blot. The amount of protein used in each lane was indicated by staining with ponceau S. (B) The intensity of each band shown in Figure 1A was quantified by a densitometer.
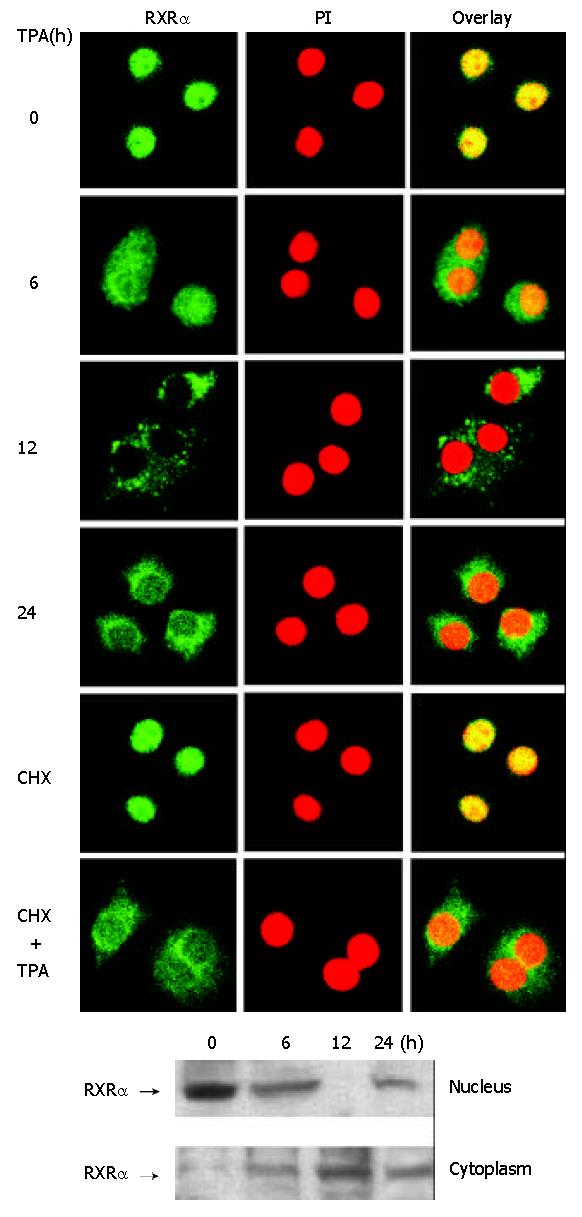
Figure 2 Translocation of RXRα from the nucleus to the cyto-plasm induced by TPA.
Cells were treated with TPA for differ-ent time periods or CHX (10 g/L) for 3 hrs as required. (A) Cells were immunostained with anti-RXRα antibody followed by corresponding FITC-conjugated anti-IgG secondary anti-body to show RXRα protein. Simultaneously, cells were stained with PI to display the nucleus. The fluorescent image was ob-served under laser-scanning confocal microscope. (B) Nuclear and cytoplasmic fractions were prepared as described in the Materials and Methods. RXRα was revealed by Western blot.
Figure 3 Effect of different agents, including TPA, MG132 (10 μmol/L) and PMSF (100 mg/L), on expression of RXRα.
Cells were pre-treated with MG132 or PMSF for 3 hrs, followed by TPA for another 24 hrs. RXRα expression was analyzed by Western blot.
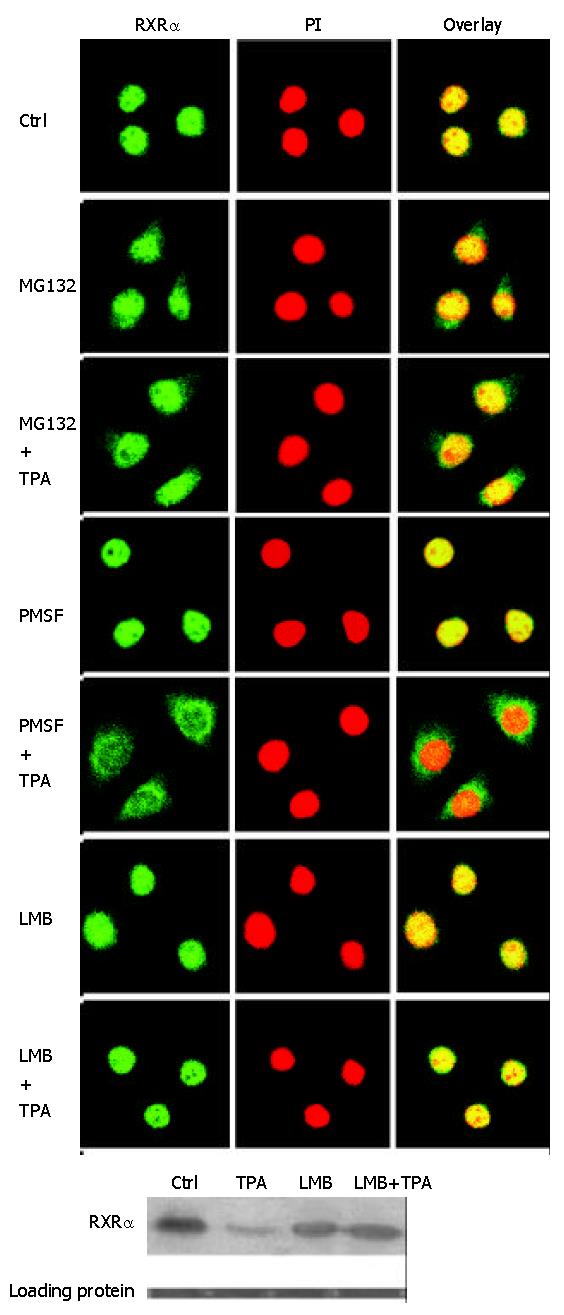
Figure 4 Effect of different agents, including TPA, MG132, PMSF and LMB (1 ng/mL), on translocation and expression of RXRα.
Cells were pre-treated with different inhibitors for 3 hrs as required, followed by TPA treatment for another 12 hrs. (A) Translocation of RXRα in response to different agents, observed under laser-confocal microscope. (B) Expression of RXRα in-duced by different agents, revealed by Western blot.
- Citation: Ye XF, Liu S, Wu Q, Lin XF, Zhang B, Wu JF, Zhang MQ, Su WJ. Degradation of retinoid X receptor α by TPA through proteasome pathway in gastric cancer cells. World J Gastroenterol 2003; 9(9): 1915-1919
- URL: https://www.wjgnet.com/1007-9327/full/v9/i9/1915.htm
- DOI: https://dx.doi.org/10.3748/wjg.v9.i9.1915


