Copyright
©The Author(s) 2003.
World J Gastroenterol. Jun 15, 2003; 9(6): 1356-1360
Published online Jun 15, 2003. doi: 10.3748/wjg.v9.i6.1356
Published online Jun 15, 2003. doi: 10.3748/wjg.v9.i6.1356
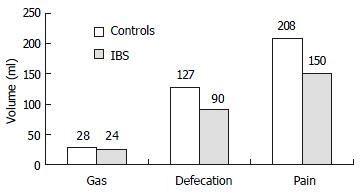
Figure 1 Rectal sensation test (the thresholds for sensation).
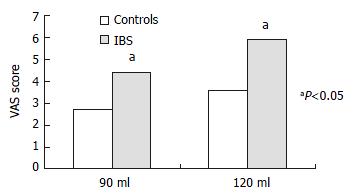
Figure 2 Subjective pain intensity.
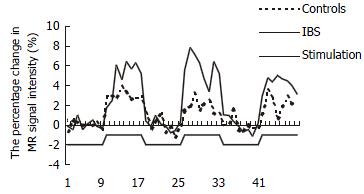
Figure 3 The percentage change in MR signal intensity time course of PFC in response to 3 rectal distentions at 90 mL.
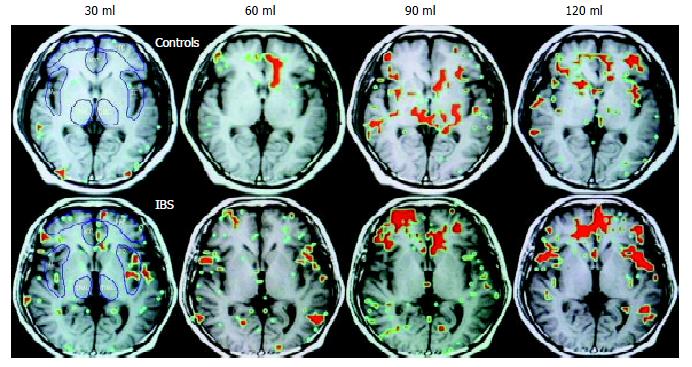
Figure 4 Functional brain map.
The red area is the ROI.
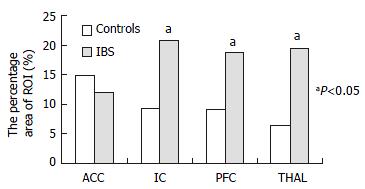
Figure 5 The average area of ROI at 120 mL rectal distention.
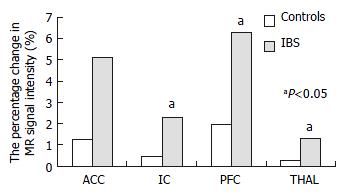
Figure 6 The percentage change in MR signal intensity of ROI at 120 mL rectal distention.
- Citation: Yuan YZ, Tao RJ, Xu B, Sun J, Chen KM, Miao F, Zhang ZW, Xu JY. Functional brain imaging in irritable bowel syndrome with rectal balloon-distention by using fMRI. World J Gastroenterol 2003; 9(6): 1356-1360
- URL: https://www.wjgnet.com/1007-9327/full/v9/i6/1356.htm
- DOI: https://dx.doi.org/10.3748/wjg.v9.i6.1356


