Copyright
©The Author(s) 2003.
World J Gastroenterol. Jun 15, 2003; 9(6): 1333-1336
Published online Jun 15, 2003. doi: 10.3748/wjg.v9.i6.1333
Published online Jun 15, 2003. doi: 10.3748/wjg.v9.i6.1333
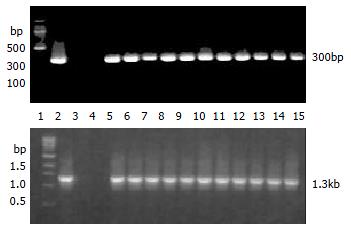
Figure 1 PCR results of transgenic mice.
1: DNA molecular weight marker, up 100 bp ladder, down 1 kb ladder; 2: Positive control (pcDNA3-hB1F); 3: Negative control (normal mouse); 4: Water as template; 515: Transgenic founder mice; Up: P1-P2 primers amplified; Down: P3-P4 primers amplified.
Figure 2 Genonic DNA Southern blotting results of transgenic mice.
1: Positive control (pcDNA3-hB1F); 2: Negative control (normal mouse); 313: Transgenic founder mice.
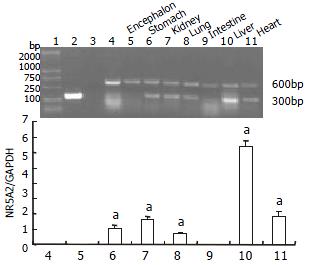
Figure 3 RT-PCR results of transgene expression.
1: DNA molecular weight marker DL 2000; 2: Positive control (pcDNA3-hB1F); 3: Negative control (non-reversely transcribed RNA); 4: C57 mouse liver; 511: Transgenic mice tissues.aP < 0.05.
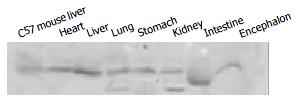
Figure 4 Western blotting analysis of transgene expression.
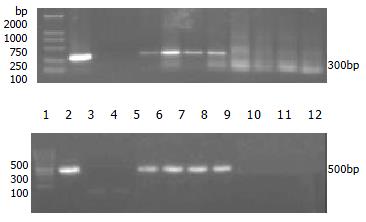
Figure 5 Partial PCR results of F1 transgenic mice.
1: DNA molecular weight marker, up DL 2000, down 100 bp ladder; 2: Positive control (pcDNA3-hB1F); 3: Negative control (normal mouse); 4: Water as control; 512: F1 mice; Up: P1-P2 primers amplified; Down: P5-P6 primers amplified.
- Citation: Wang SL, Yang H, Xie YH, Wang Y, Li JZ, Wang L, Wang ZG, Fu JL. Establishment of transgenic mice carrying the gene of human nuclear receptor NR5A2 (hB1F). World J Gastroenterol 2003; 9(6): 1333-1336
- URL: https://www.wjgnet.com/1007-9327/full/v9/i6/1333.htm
- DOI: https://dx.doi.org/10.3748/wjg.v9.i6.1333


