Copyright
©The Author(s) 2003.
World J Gastroenterol. Jun 15, 2003; 9(6): 1302-1306
Published online Jun 15, 2003. doi: 10.3748/wjg.v9.i6.1302
Published online Jun 15, 2003. doi: 10.3748/wjg.v9.i6.1302
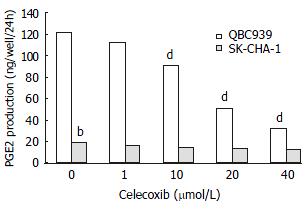
Figure 1 ELISA for PGE2 detection using supernatants from QBC939 and SK-CHA-1 cells pre-treated with celecoxib at various concentrations for 48 h.
Celecoxib at 10 μmol/L inhibited PGE2 production in QBC939 cells by 26%. With 20 μmol/L and 40 μmol/L of celecoxib, PGE2 production was further inhibited by 58% and 74%, which were statistically significant (dP < 0.01, vs control). The PGE2 level was much lower constitutively in SK-CHA-1 cells (18.6 ± 3.2) compared with that in QBC939 (121.9 ± 5.6) cells (t test, bP < 0.01). The PGE2 concentration in SK-CHA-1 cells was also reduced, but not significantly after treatment with celecoxib. The PGE2 concentration in SK-CHA-1 cells was (16.5 ± 2.9) ng/well, (14.8 ± 3.4) ng/well, (13.2 ± 2.0) ng/well and (12.6 ± 3.1) ng/well respectively, when pre-treated with 1 μmol/L, 10 μmol/L, 20 μmol/L and 40 μmol/L of celecoxib for 48 h (P > 0.05, vs control).
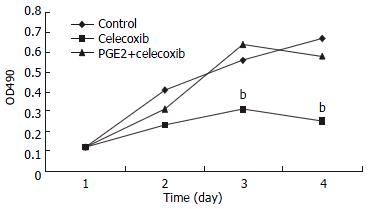
Figure 2 Growth curves of QBC939 cells in the presence of celecoxib, celecoxib + PGE2 and control group.
Proliferation inhibition of QBC939 by celecoxib (20 μmol/L) was time-dependent: it was noticeable on day 2 and became significant on day 3 to 4 (bP < 0.01, vs control). The anti-proliferation effect of celecoxib on QBC939 cells was abolished by pre-added PGE2 (200 pg/mL).
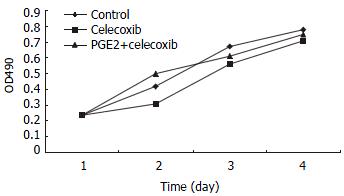
Figure 3 Growth curves of SK-CHA-1 cells in the presence of celecoxib, celecoxib + PGE2 and control group.
The proliferation of SK-CHA-1 cells was inhibited slightly by celecoxib, the cell density OD490 in the presence of celecoxib and in control group was 0.31 ± 0.04 and 0.42 ± 0.03 respectively on day 2 (P > 0.05), 0.58 ± 0.07 and 0.67 ± 0.09 respectively on day 3 (P > 0.05), and 0.71 ± 0.08 and 0.78 ± 0.06 respectively on day 4 (P > 0.05).
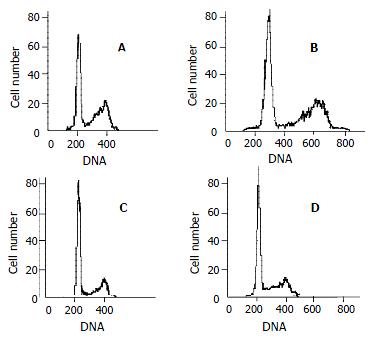
Figure 4 Cell cycle analysis.
Representative flow cytometry data from QBC939 cells after 48 h in the presence of various concentration of celecoxib: 0 μmol/L (A), 10 μmol/L (B), 20 μmol/L (C) and 40 μmol/L (D). The percentage of QBC939 cells in G0-G1 phase after treatment with 40 μmol/L (74.66 ± 6.21) and 20 μmol/L (68.63 ± 4.36) of celecoxib increased significantly compared with control cells (t test, P < 0.01).
-
Citation: Wu GS, Zou SQ, Liu ZR, Tang ZH, Wang JH. Celecoxib inhibits proliferation and induces apoptosis
via prostaglandin E2 pathway in human cholangiocarcinoma cell lines. World J Gastroenterol 2003; 9(6): 1302-1306 - URL: https://www.wjgnet.com/1007-9327/full/v9/i6/1302.htm
- DOI: https://dx.doi.org/10.3748/wjg.v9.i6.1302


